R E S E A R C H
Open Access
Transcriptome analysis of normal-appearing
white matter reveals cortisol- and
disease-associated gene expression profiles in
multiple sclerosis
Jeroen Melief
1, Marie Orre
2, Koen Bossers
3, Corbert G. van Eden
1, Karianne G. Schuurman
1, Matthew R. J. Mason
1,3,
Joost Verhaagen
3, Jörg Hamann
1,4and Inge Huitinga
1*Abstract
Inter-individual differences in cortisol production by the hypothalamus–pituitary–adrenal (HPA) axis are thought to contribute to clinical and pathological heterogeneity of multiple sclerosis (MS). At the same time, accumulating evidence indicates that MS pathogenesis may originate in the normal-appearing white matter (NAWM). Therefore, we performed a genome-wide transcriptional analysis, by Agilent microarray, of post-mortem NAWM of 9 control subjects and 18 MS patients to investigate to what extent gene expression reflects disease heterogeneity and HPA-axis activity. Activity of the HPA HPA-axis was determined by cortisol levels in cerebrospinal fluid and by numbers of corticotropin-releasing neurons in the hypothalamus, while duration of MS and time to EDSS6 served as indicator of disease severity. Applying weighted gene co-expression network analysis led to the identification of a range of gene modules with highly similar co-expression patterns that strongly correlated with various indicators of HPA-axis activity and/or severity of MS. Interestingly, molecular profiles associated with relatively mild MS and high HPA-axis activity were characterized by increased expression of genes that actively regulate inflammation and by molecules involved in myelination, anti-oxidative mechanism, and neuroprotection. Additionally, group-wise comparisons of gene expression in white matter from control subjects and NAWM from (subpopulations of) MS patients uncovered disease-associated gene expression as well as strongly up- or downregulated genes in patients with relatively benign MS and/or high HPA-axis activity, with many differentially expressed genes being previously undescribed in the context of MS. Overall, the data suggest that HPA-axis activity strongly impacts on molecular mechanisms in NAWM of MS patients, but partly also independently of disease severity.
Keywords:Multiple sclerosis, Normal-appearing white matter, HPA axis, Transcriptome
Introduction
Multiple sclerosis (MS) is a chronic neurodegenerative disease that is hallmarked by the presence of inflamma-tory demyelinating lesions in the central nervous system (CNS). Therefore, major efforts have been dedicated to identify the molecular mechanisms at play during
forma-tion and expansion of MS lesions [45,51,53]. Related to
this, there is an increasing interest for normal-appearing
white matter (NAWM) as starting point of MS patho-genesis, as NAWM in MS was found to contain numer-ous cellular and molecular changes in inflammatory and
neuroprotective pathways [60, 82, 89]. Studying these
pathways may lead to the identification of events that precede or determine permissiveness for development of new MS lesions [16].
Clinical and pathological heterogeneity is one of the most
striking features of MS [5,53,54,84]. A factor considered
to be associated with heterogeneity of MS is activity of the hypothalamus–pituitary–adrenal (HPA) axis [25,26,32,58, 75]. Recently, we found in a post-mortem study of 42 MS patients that high levels of cortisol in the cerebrospinal fluid
© The Author(s). 2019Open AccessThis article is distributed under the terms of the Creative Commons Attribution 4.0 International License (http://creativecommons.org/licenses/by/4.0/), which permits unrestricted use, distribution, and reproduction in any medium, provided you give appropriate credit to the original author(s) and the source, provide a link to the Creative Commons license, and indicate if changes were made. The Creative Commons Public Domain Dedication waiver (http://creativecommons.org/publicdomain/zero/1.0/) applies to the data made available in this article, unless otherwise stated. * Correspondence:[email protected]
1Department of Neuroimmunology, Netherlands Institute for Neuroscience,
Institute of the Royal Netherlands Academy of Arts and Sciences, Amsterdam, The Netherlands
(CSF) were associated with slow disease progression, in par-ticular in females with secondary-progressive MS, whereas patients with low cortisol levels had fast disease progres-sion, greater numbers of active lesions, and less
remyeli-nated plaques [58]. Moreover, NAWM of female
secondary-progressive MS patients with high cortisol levels displayed elevated expression of glucocorticoid-responsive genes, such as CD163, and decreased expression of pro-inflammatory genes, such as tumor necrosis factor, when compared to NAWM of patients with low cortisol levels. These data strongly suggest that high HPA-axis ac-tivity, by means of cortisol hypersecretion, impacts on mo-lecular mechanisms in the NAWM in such a way that it reduces permissiveness for lesion development. Defining the molecular pathways induced in NAWM by cortisol may therefore identify targets for the development of thera-peutic strategies to slow down or halt MS progression.
The heterogeneity of MS has been established at the clin-ical, radiologclin-ical, and neuropathological level, but not with
regard to molecular mechanisms in NAWM [5, 53, 54].
Without addressing disease heterogeneity, an earlier study on genome-wide expression in MS NAWM showed an up-regulation of genes involved in anti-inflammatory mecha-nisms in oligodendrocytes and increased mRNA levels of pro-inflammatory molecules [89]. Thus, no study thus far addressed the question whether and to what extent gene expression profiles in NAWM of MS patients reflect dis-ease severity and/or HPA-axis activity. Here, we applied an Agilent microarray to perform a genome-wide transcrip-tional analysis of post-mortem NAWM of 18 female sub-jects with secondary-progressive MS that displayed a strong heterogeneity in disease severity and HPA-axis ac-tivity. This allowed us to investigate gene expression in re-lation to disease severity and/or HPA-axis activity. No male subjects were included, as an earlier study by us indi-cate that the inverse correlation of HPA axis activity with both disease severity and pathology of MS was most prom-inent in females with secondary progressive MS [58]. As an added benefit, this provided us with a more homogeneous population, excluding possible confounding effects of gen-der on our findings.
We analyzed our data using various approaches, in-cluding WGCNA and group-wise comparisons of con-trol subjects and (subpopulations of ) MS patients. The WGCNA enabled us to identify clusters of co-regulated genes that correlate with one or more indicators of MS-disease severity and HPA-axis activity. In addition, individual genes were also studied for their association with the same clinical and endocrinological parameters. This led us to uncover many novel genes positively or negatively associated with HPA-axis activity and/or se-verity of MS. In general, gene expression profiles associ-ated with high cortisol production and mild MS were
characterized by molecules that actively regulate
inflammation, but also belong to pathways involved in proliferation of neural stem cells. The data indicate that HPA-axis activity strongly impacts on molecular mecha-nisms in NAWM of MS patients and strongly affects pathways associated with disease severity. In this way, our study identifies molecular targets that may be assessed for their potential to prevent MS pathology in NAWM or limit lesion formation.
Materials and methods
Brain tissue
Snap-frozen tissue from control and MS-brain donors
was obtained from the Netherlands Brain Bank,
Amsterdam, The Netherlands (http://www.brainbank.nl). Informed consent was obtained for brain autopsy and the use of tissue and clinical information for research purposes. Exclusion criteria were death due to sepsis and glucocorticoid treatment within 8 weeks prior to death. Clinical diagnoses of MS were confirmed by a neurologist (Prof. C.H. Polman, VUmc, Amsterdam or Dr. S. Luchetti, NIN, Amsterdam, The Netherlands). An overview of the pathological and clinical data of the
brain donors is depicted in Table1.
Quantification of CRH-producing neurons and cortisol levels
Numbers of corticotropin-releasing hormone (CRH)-ex-pressing neurons in the paraventricular nucleus (PVN) were quantified in fixed tissue as described previously [35, 58]. In short, serial 6-μm frontal sections were cut on a microtome. Delineation of the PVN was determined in thionine-stained sections. Each 100th section through the PVN was stained for CRH. Neurons that showed a nucle-olus and expressed CRH were counted blinded. The total number of CRH-expressing neurons in the PVN was calcu-lated on the basis of cell counts and the distance between the sections. Cortisol was measured by radioimmunoassay (Diagnostic Products Corporation, Los Angeles, CA, USA), using a radioactively labeled antibody that enables highly sensitive detection of cortisol levels in various types of fluid, including serum, CSF, and saliva.
Tissue processing and RNA isolation
Series of 10 cryostat sections (20μm each) of subcortical
NAWM were homogenized in Trizol (Invitrogen, Carls-bad, CA, USA). Sections preceding and following these series were stained by immunohistochemistry for proteoli-pid protein (PLP; Serotec, Oxford, UK) and HLA-DP,
−DQ, −DR (DakoCytomation, Glostrup, Denmark) to
snap-frozen tissue dissected from various anatomical re-gions of control and MS brains, including MS lesions and NAWM, as well from tonsil. This RNA which was pooled to create common reference complementary RNA (cRNA), which was co-hybridized to every microarray slide to enable accurate comparison of expression levels across different cDNA microarray experiments.
Microarray hybridization
Labeling of isolated RNA was done using the Low Input Quick Amp Labeling kit (Agilent Technologies, Palo Alto,
CA, USA), according to the manufacturer’s instructions.
For whole-genome expression analysis, samples were hy-bridized to Agilent 4x44K v2 Whole Human Genome ar-rays (G4845A; Agilent Technologies), covering 27,958 genes. In brief, equal amounts of total RNA (50 ng) were
amplified and labeled with either Cy3-CTP (experimental samples) or Cy5-CTP (reference material, obtained as de-scribed above) using the Low Input Quick Amp Labeling kit (Agilent Technologies). For hybridization, equal amounts (825 ng) of labeled samples were fragmented in Fragmentation Buffer (Agilent Technologies) for 30 min at 60 °C. Labeled and fragmented complementary RNA (cRNA) was hybridized to the array and incubated in a ro-tating hybridization chamber for 17 h at 60 °C. After hybridization, the array was washed subsequently for 5 min in 6 x saline sodium phosphate-EDTA (SSPE)/0.005%
N-lauroylsarcosine, 1 min in 0.006 x SSPE/0.005%
N-lauroylsarcosine, and 30 s in acetonitrile and dried quickly in nitrogen flow. The arrays were scanned at a resolution of 5 mm and at 5 and 100% photomultiplier tube settings using the Agilent DNA Microarray Scanner Table 1Overview of included subjects
NBB no. Sex Age PMD pH MS/C Onset Duration Time to EDSS6 Type EDSS Death cause
96–026 F 69 9:15 6.40 MS 44 25 16 SP 9 respiratory insufficiency
96–074 F 40 7:00 6.74 MS 26 14 11 SP 8–9 dehydration
96–076 F 81 4:15 6.93 MS 32 49 44 SP 6 cachexia
96–121 F 53 7:15 6.54 MS 35 18 8 SP 9 pneumonia
97–006 F 62 6:45 6.49 MS 33 29 22 SP 9 cardiac asthma
97–160 F 40 7:00 6.33 MS 29 11 8 SP 9 aspiration pneumonia with cardiac decompensation
98–009 F 70 6:30 6.30 MS 38 32 n/a SP 9 cardiac arrest
98–158 F 76 14:15 5.93 MS 23 53 24 SP 9 respiratory insufficiency
99–025 F 64 7:45 6.22 MS 29 35 21 SP 9 pneumonia and dehydration
99–054 F 58 8:10 6.30 MS 38 20 13 SP 9 legal euthanasia
99–073 F 71 8:00 6.80 MS 47 24 30 SP 9 pneumonia
99–086 F 71 10:25 6.35 MS 47 24 22 SP 9 respiratory insufficiency
99–119 F 38 5:15 6.55 MS 28 10 n/a RR 3 cardiac arrest
00–120 F 69 13:20 6.12 MS 43 26 10 SP 9 probable viral infection
01–018 F 48 8:10 6.55 MS 40 8 7 SP 6.5 legal euthanasia
01–093 F 66 6:20 6.44 MS 23 43 30 SP 9 liver failure due to cancer metastases
01–126 F 80 9:35 6.20 MS 21 59 51 SP 9 acute leukemia
02–053 F 48 5:50 6.64 MS 27 21 14 SP 8 heart failure
95–078 F 74 6:40 6.70 C – – – – – cachexia
96–014 F 54 8:00 6.45 C – – – – – acute renal failure
00–025 F 68 5:45 6.97 C – – – – – legal euthanasia
01–069 F 41 13:30 – C – – – – – pulmonary artery hemorrhage
97–068 F 61 7:15 7.20 C – – – – – cachexia
97–042 F 65 12:50 6.90 C – – – – – cardiac arrest
97–005 F 69 7:10 9.80 C – – – – – respiratory insufficiency
96–051 F 71 4:50 6.70 C – – – – – cardiac arrest
00–050 F 52 6:30 7.20 C – – – – – metastasized leiomyosarcoma
NBB no. = donor registration number of the Netherlands Brain Bank
Ageage at death (years),PMDpost-mortem delay (hours:minutes),pHpH of CSF,MS/CMS or control subject,Onsetage of disease onset (years),Durationdisease duration (years),Time to EDSS6time to EDSS6 (years),Typeclinical subtype of MS,Ffemale,SPsecondary progressive MS,RRrelapsing-remitting MS,n/a
(Agilent Technologies). Scan data were extracted using Agilent Feature Extraction software (version 8.5.1; Agilent Technologies).
Normalization of gene expression and gene extraction To allow for accurate comparison of expression levels across different cDNA microarray experiments, common reference cRNA was co-hybridized to every microarray. By using the reference cRNA, a ratio between the ex-perimental and reference material could be calculated for every spot, and expression levels across different hy-bridizations were compared. These data were used for analysis by weighted gene co-expression network ana-lysis (WGCNA) and by group-wise comparison between subgroups, which is further described below. For an
overview of the experimental setup, see Fig.1. Raw data
from the extraction software was imported to the R stat-istical processing environment using linear models for microarray data (LIMMA)/Bioconductor (version 3.12.3) package. Feature and background non-uniformity out-liers, as determined by the Agilent Feature Extraction software using default settings, were removed. The data
were normalized using “between array normalization”
with the “Gquantile” algorithm
(http://www.bioconduc-tor.org).
cDNA synthesis and quantitative real-time PCR
Using the same RNA from which cRNA was generated for hybridization, cDNA was synthesized with the
Quan-titect Reverse Transcription Kit (Qiagen, Hilden,
Germany) according to the manufacturer’s protocol.
Quantitative real-time polymerase chain reaction (PCR) was performed and analyzed as described elsewhere, with minor adaptations [40]. The amount of cDNA used per reaction was based on an input of 5 ng original RNA in a final volume of 20μl.
Statistical analysis
To obtain lists of genes associated with either disease se-verity or HPA-axis activity, a WGCNA was performed
on the 2log intensities to find gene modules [44, 61].
WCGNA defines, in an unbiased way, clusters of genes that show a co-expression pattern amongst samples, cre-ating (a network with) modules of genes that are co-regulated. A soft power threshold of 9 was deter-mined in the recommended way [44], a signed network was used, and dendrogram cluster detection was per-formed using a minimum cluster size of 27 and a deepS-plit value of 1.
In addition to the WCGNA, linear regression analysis was performed for group-wise comparisons, using the LIMMA/bioconductor package in R (version 3.12.3). This
was carried out using the limma function “lmscFit” for
single channel analysis on two-color arrays with
correction for intraspot correlation. A false discovery rate of 0.05 was used by multiple testing correction with the Benjamini-Hochberg method. All models were pairwise comparisons of two conditions. These group-wise com-parisons were made for gene expression between all MS patients and control subjects. Furthermore, the group of MS patients was separated into a high and a low cortisol subgroup by the median for this parameter for objective group-wise comparison to identify cortisol-associated gene expression. To perform unbiased group-wise com-parisons to find gene expression profiles associated with severity of MS, the patient population was divided into two subgroups by the median disease duration. Correl-ation coefficients were interpreted as follows: r < 0.1: no correlation; 0.1 < r < 0.3: weak correlation; 0.3 < r < 0.5: moderate correlation; r > 0.5: strong correlation. The sig-nificance level was set to 0.05. For all analyses that did not include the microarray data, we used SPSS software ver-sion 24 (IBM, Armonk, NY, USA).
All modules identified by WGCNA were subjected to the online tool DAVID, version 6.7 (http://david.abcc. ncifcrf.gov) for functional gene ontology (GO) analysis, using the whole human genome as background. For en-richment of top GO classes, the significance level was set to 0.05 (unadjusted). The minimum number of genes in each GO term was 3.
Results
Post-mortem NAWM of 18 female subjects with secondary-progressive MS that displayed a strong hetero-geneity in disease severity and HPA-axis activity and white matter of 10 matched control subjects was analyzed for differences in gene expression using Agilent Human Gene
Expression 4x44K v2 microarrays. Table 2 provides an
overview of the brain donor characteristics, including age, post-mortem delay (PMD), pH value of the CSF, and qual-ity of RNA from NAWM in control subjects and different subgroups of MS patients. This table also displays clinical characteristics of the MS patients, such as disease dur-ation and cortisol levels in CSF. No differences were present between control subjects and MS patients in age, PMD, or RIN. However, pH was significantly lower in MS
patients compared to controls (p = 0.001). At the same
time, pH and PMD did not correlate with RIN, cortisol levels, or numbers of CRH-expressing neurons, indicating that they had no confounding effects. There was a signifi-cant correlation between cortisol and numbers of
CRH-positive neurons in MS patients (r = 0.508, p =
0.031), corroborating the idea that indicators of HPA-axis activity measured after death reliably reflect the situation during life [58]. In addition, cortisol levels in CSF
corre-lated with duration of MS (r = 0.490,p= 0.039) and with a
trend towards significance with time to a score of 6 on the
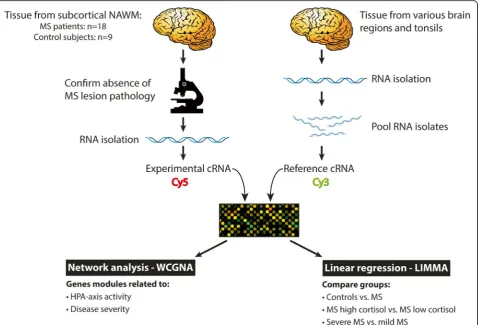
Fig. 1Schematic representation of the experimental approach. Series of cryostat sections of post-mortem brain tissue, dissected from subcortical NAWM of 18 MS patients and 9 control subjects, were used for RNA extraction. Sections preceding and following these series were stained by immunohistochemistry for proteolipid protein and HLA-DP,−DQ,−DR to confirm the absence of MS lesion pathology. In parallel, RNA was extracted from snap-frozen tissue dissected from a diversity of anatomical regions from control and MS brains, including MS lesions and NAWM, as well from tonsil, which was pooled and used to generate common reference cRNA. Common reference cRNA was co-hybridized to every microarray slide to allow for accurate comparison of expression levels across different cDNA microarray experiments. In this way, a ratio between the experimental and reference material could be calculated for every spot, and expression levels across different hybridizations could be compared. These data were subjected to WGCNA to identify clusters of co-regulated genes associated with HPA-axis activity and severity of MS. Furthermore, the data were used for group-wise comparisons between control subjects and MS patients subdivided into subgroups with high and low cortisol levels or subgroups with severe and mild disease using LIMMA
Table 2Overview of parameters used to match control subjects and (subgroups of) MS patients
Controls (n= 9)
All MS patients (n= 18)
MS Low cortisol (n= 9)
MS High cortisol (n= 9)
MS
Severe disease (n= 10)
MS Mild disease (n= 8)
Med IQR Med IQR Med IQR Med IQR Med IQR Med IQR
Age 66.5 53.0–70.0 65 48–71 58 44–69 70 62–71 51 40–70 70 65–79
Duration – – 24 17–37 20 11–31 29 21–48 19 11–22 39 30–52
Cortisol – – 221 86–492 86 20–178.0 492 289–669 146 29–461 242 183–639
PMD 7:10 6:00–10:25 7:30 6:25–9:20 7:45 5:30–8:45 7:15 6:45–10:00 7:40 6:40–8:25 7:15 6:20–12:25
pH CSF 7.0 6.7–7.1 6.4 6.3–6.6 6.4 6.3–6.6 6.4 6.3–6.6 6.5 6.3–6.7 6.3 6.1–6.5
RIN 7.4 7.1–8.3 7.8 7.0–8.3 7.7 7.0–8.4 7.4 6.6–7.9 7.6 7.1–8.3 7.7 6.9–8.4
0.095), confirming earlier findings that high HPA-axis ac-tivity coincides with slower disease progression and
rela-tively mild MS [35,58].
Weighted gene co-expression network analysis (WGCNA) A first analysis on the microarray data was done by WGCNA, which in an unbiased way identifies clusters of genes that display a similar expression pattern across the different samples in the whole data set; clusters of genes that show the same expression pattern are referred to as modules. WGCNA can also be used to investigate whether such modules are related to traits of particular interest. Each module has an eigengene (the first princi-pal component) that represents the average expression pattern of all genes within the module. Moreover, for each gene within a module, a correlation value to the module eigengene is calculated, which indicates to what extent the expression profile of an individual gene
re-sembles that of the whole module [44,61].
Two approaches were taken for WGCNA. The main analysis was performed on a dataset that included the
samples from both control subjects and MS patients. Another analysis was performed on data from MS pa-tients only, which was done to confirm findings made in the first approach and to identify additional gene expres-sion profiles associated with HPA-axis activity and dis-ease severity in MS. From both datasets, we selected out of a total of 27,958 genes covered by the microarray the 15,000 genes that showed the biggest variance across all samples for application of WGCNA. By hierarchical clustering using these data we found two outliers, one in the control group and one in the MS patient group
(donor 01–069 and 98–158 respectively), which were
ex-cluded from further analyses. All data described below in the text, tables, and figures were generated by our main WGCNA analysis that included both control sub-jects and MS patients, unless stated otherwise. To find gene clusters associated with disease severity and HPA-axis activity in MS, we studied the correlation be-tween gene modules identified by WCGNA and several clinical traits: disease duration and time to EDSS6 as pa-rameters of disease severity, CSF cortisol levels and
numbers of CRH-producing neurons as indicators of HPA-axis activity.
Modules generated by WCGNA correlate to HPA-axis activity and MS severity
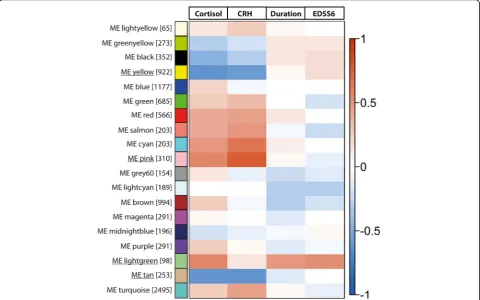
Using the WGCNA method, we identified a total of 19 modules, of which the biggest module contained 2495
genes and the smallest 65 genes (Fig. 2). Of the
identi-fied modules, 9 showed an expression pattern that corre-lated with one or more of the traits of interest: cortisol levels in CSF, number of CRH-positive neurons, disease duration, and time to EDSS6. Notably, all modules that were correlated to CSF cortisol levels also showed a
cor-relation in the same direction to numbers of
CRH-expressing neurons, substantiating their associ-ation with activity of the HPA axis. In total, eight mod-ules correlated only to indicators of HPA-axis activity,
i.e. cortisol levels in CSF and numbers of
CRH-expressing neurons in the PVN: the black module
(r =−0.47, p = 0.020; r =−0.31, p = 0.100, respectively),
yellow module (r =−0.63,p< 0.001; r =−0.57,p= 0.003,
respectively), red module (r = 0.43, p = 0.030; r = 0.46,
p = 0.020, respectively), salmon module (r = 0.40, p =
0.050; r = 0.52,p= 0.008, respectively), cyan module (r =
0.48, p = 0.010; r = 0.65, p < 0.001, respectively), pink
module (r = 0.56, p = 0.003; r = 0.77, p < 0.001,
respect-ively), tan module (r =−0.63, p < 0.001; r =−0.61, p =
0.001, respectively), and turquoise module (r = 0.25,p=
0.200; r = 0.46, p = 0.020, respectively).
Four modules stood out for their particular strong cor-relation to one or more traits. The first one is the light-green module, which positively correlated to cortisol levels, disease duration, and time to EDSS6. Secondly, the pink module showed a strong positive correlation to cortisol levels and to numbers of CRH-expressing neu-rons. In contrast, the tan and yellow module correlated negatively to cortisol levels and numbers of CRH
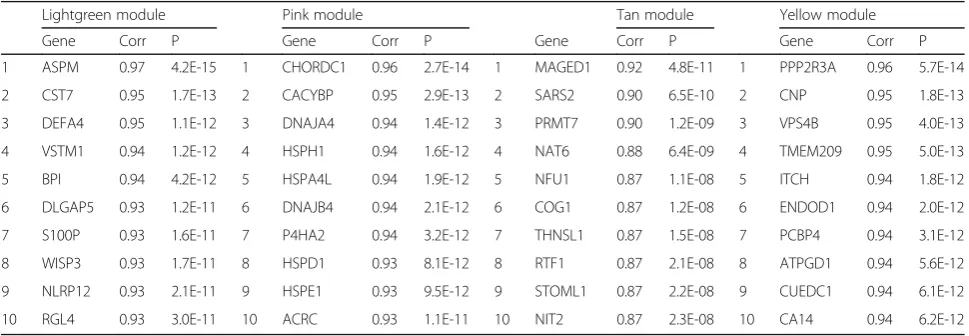
neurons. The 10 genes most strongly connected to the expression pattern of the four modules (module
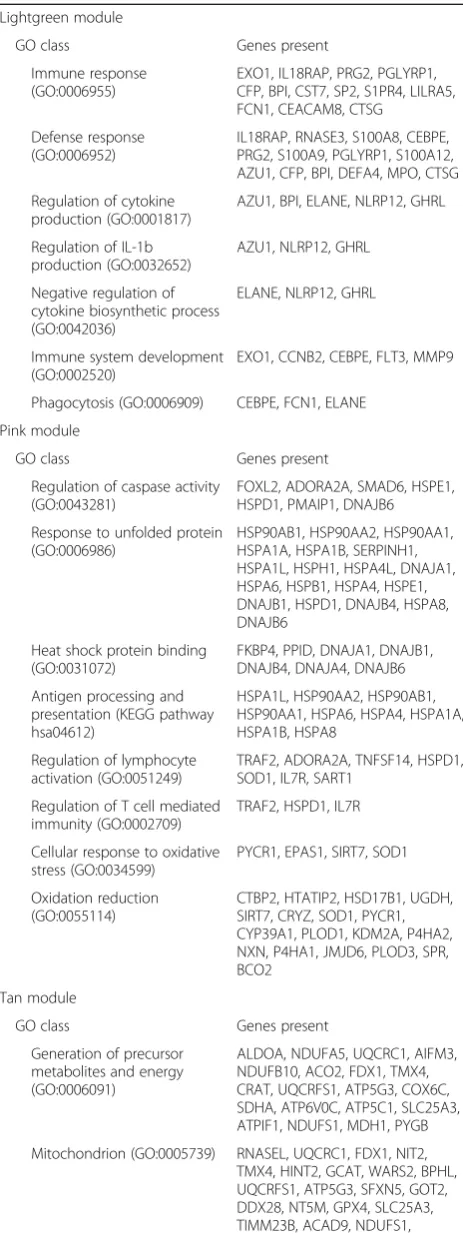
eigen-gene) are depicted in Table 3. The GO classes enriched
in these four modules according to functional
annota-tion clustering analysis are depicted in Table 4. The
re-sults of the GO analysis of all the other modules are
shown in Additional file1.
A module strongly correlated to both severity of MS and HPA-axis activity
Among the gene clusters identified by the WCGNA, as
depicted in Fig. 2, the lightgreen module had an
eigen-gene that was positively correlated to cortisol levels (r =
0.56, p = 0.003), disease duration (r = 0.50, p = 0.010),
and time to EDSS6 (r = 0.54, p = 0.006), indicating its
positive association with both HPA-axis activity and dis-ease severity. The module contained a total of 98 genes, encoding molecules, such as the S100 proteins S100A8, S100A9, and S100A12, which play a variety of roles in
inflammation [3, 13, 21]. Functional annotation
cluster-ing indicated that the lightgreen module was enriched
for genes involved in classes labeled by GO as ‘immune
response’ (p = 6.0E-09),‘negative regulation of cytokine
biosynthetic process’ (p = 4.3E-03), and ‘regulation of
IL-1β production’ (p = 4.3E-03), amongst others (Table
4). These GO classes contained several genes that are directly or indirectly implicated in MS, such as cystatin F (CST7), ghrelin (GHRL), IL-18 receptor accessory
pro-tein (IL18RAP), myeloperoxidase (MPO),
matrix-metalloproteinase 9 (MMP9), and FMS-like
tyrosine-3 (FLT3) [4, 11, 17, 24, 27, 29, 38, 43, 55, 70,
79]. The top 10 genes most strongly connected to the lightgreen module are involved in various molecular mechanisms, such as myelination (CST7), neurogenesis (ASPM), and inflammation (DEFA4, VSTM1, BPI, S100P, WISP3, NLRP12). Overall, the lightgreen module was characterized by molecules that actively regulate
Table 3Genes with the strongest connectivity to the modules identified by WGCNA
Lightgreen module Pink module Tan module Yellow module
Gene Corr P Gene Corr P Gene Corr P Gene Corr P
1 ASPM 0.97 4.2E-15 1 CHORDC1 0.96 2.7E-14 1 MAGED1 0.92 4.8E-11 1 PPP2R3A 0.96 5.7E-14
2 CST7 0.95 1.7E-13 2 CACYBP 0.95 2.9E-13 2 SARS2 0.90 6.5E-10 2 CNP 0.95 1.8E-13
3 DEFA4 0.95 1.1E-12 3 DNAJA4 0.94 1.4E-12 3 PRMT7 0.90 1.2E-09 3 VPS4B 0.95 4.0E-13
4 VSTM1 0.94 1.2E-12 4 HSPH1 0.94 1.6E-12 4 NAT6 0.88 6.4E-09 4 TMEM209 0.95 5.0E-13
5 BPI 0.94 4.2E-12 5 HSPA4L 0.94 1.9E-12 5 NFU1 0.87 1.1E-08 5 ITCH 0.94 1.8E-12
6 DLGAP5 0.93 1.2E-11 6 DNAJB4 0.94 2.1E-12 6 COG1 0.87 1.2E-08 6 ENDOD1 0.94 2.0E-12
7 S100P 0.93 1.6E-11 7 P4HA2 0.94 3.2E-12 7 THNSL1 0.87 1.5E-08 7 PCBP4 0.94 3.1E-12
8 WISP3 0.93 1.7E-11 8 HSPD1 0.93 8.1E-12 8 RTF1 0.87 2.1E-08 8 ATPGD1 0.94 5.6E-12
9 NLRP12 0.93 2.1E-11 9 HSPE1 0.93 9.5E-12 9 STOML1 0.87 2.2E-08 9 CUEDC1 0.94 6.1E-12
10 RGL4 0.93 3.0E-11 10 ACRC 0.93 1.1E-11 10 NIT2 0.87 2.3E-08 10 CA14 0.94 6.2E-12
inflammation, though it also indicated changes in mo-lecular pathways that affect multiple aspects of MS dis-ease activity to slow down clinical progression.
A module positively correlated to HPA-axis activity, independent of disease severity
The pink module was positively correlated to cortisol
levels (r = 0.56, p= 0.003) and numbers of CRH neurons
(r = 0.77,p< 0.001). The module contained 310 genes and
was enriched for molecules with the GO label‘regulation
of caspase activity’(p= 9.4E-04),‘heat shock protein
bind-ing’ (p = 8.0E-04), ‘regulation of lymphocyte activation’
(p = 2.0E-02), and ‘oxidation reduction’ (p = 1.1E-02),
amongst others (Table 4). Moreover, the module was
enriched for molecules involved in the Kyoto Encyclopedia
of Genes and Genomes (KEGG) pathway‘antigen
process-ing and bindprocess-ing’(p= 1.7E-03). The molecules involved in
regulation of caspase activity may be related to apoptosis of neurons and oligodendrocytes, but also play a role in microglia activation and neurotoxicity [7].
Interestingly, the pink module contained the
interleukin-7 receptor (IL7R, CD127) and tumor necro-sis factor ligand superfamily member 14 (TNFSF14), two molecules that are highly associated with genetic
suscep-tibility to MS [28,36]. In addition, the pink module
con-tained various heat-shock proteins (HSP), which have been associated with MS pathogenesis, including HSP90, which functions as a chaperone protein for the
gluco-corticoid receptor (GR) [14, 66]. Also, sirtuin 7 (SRT7)
was present in the GO class ‘cellular response to
oxida-tive stress’, which has been described as a protective
molecule in the brain and has been proposed as a thera-peutic agent [72].
Table 4GO classes overrepresented in modules identified by WGCNA
Lightgreen module
GO class Genes present
Immune response (GO:0006955)
EXO1, IL18RAP, PRG2, PGLYRP1, CFP, BPI, CST7, SP2, S1PR4, LILRA5, FCN1, CEACAM8, CTSG
Defense response (GO:0006952)
IL18RAP, RNASE3, S100A8, CEBPE, PRG2, S100A9, PGLYRP1, S100A12, AZU1, CFP, BPI, DEFA4, MPO, CTSG
Regulation of cytokine production (GO:0001817)
AZU1, BPI, ELANE, NLRP12, GHRL
Regulation of IL-1b production (GO:0032652)
AZU1, NLRP12, GHRL
Negative regulation of cytokine biosynthetic process (GO:0042036)
ELANE, NLRP12, GHRL
Immune system development (GO:0002520)
EXO1, CCNB2, CEBPE, FLT3, MMP9
Phagocytosis (GO:0006909) CEBPE, FCN1, ELANE
Pink module
GO class Genes present
Regulation of caspase activity (GO:0043281)
FOXL2, ADORA2A, SMAD6, HSPE1, HSPD1, PMAIP1, DNAJB6
Response to unfolded protein (GO:0006986)
HSP90AB1, HSP90AA2, HSP90AA1, HSPA1A, HSPA1B, SERPINH1, HSPA1L, HSPH1, HSPA4L, DNAJA1, HSPA6, HSPB1, HSPA4, HSPE1, DNAJB1, HSPD1, DNAJB4, HSPA8, DNAJB6
Heat shock protein binding (GO:0031072)
FKBP4, PPID, DNAJA1, DNAJB1, DNAJB4, DNAJA4, DNAJB6
Antigen processing and presentation (KEGG pathway hsa04612)
HSPA1L, HSP90AA2, HSP90AB1, HSP90AA1, HSPA6, HSPA4, HSPA1A, HSPA1B, HSPA8
Regulation of lymphocyte activation (GO:0051249)
TRAF2, ADORA2A, TNFSF14, HSPD1, SOD1, IL7R, SART1
Regulation of T cell mediated immunity (GO:0002709)
TRAF2, HSPD1, IL7R
Cellular response to oxidative stress (GO:0034599)
PYCR1, EPAS1, SIRT7, SOD1
Oxidation reduction (GO:0055114)
CTBP2, HTATIP2, HSD17B1, UGDH, SIRT7, CRYZ, SOD1, PYCR1, CYP39A1, PLOD1, KDM2A, P4HA2, NXN, P4HA1, JMJD6, PLOD3, SPR, BCO2
Tan module
GO class Genes present
Generation of precursor metabolites and energy (GO:0006091)
ALDOA, NDUFA5, UQCRC1, AIFM3, NDUFB10, ACO2, FDX1, TMX4, CRAT, UQCRFS1, ATP5G3, COX6C, SDHA, ATP6V0C, ATP5C1, SLC25A3, ATPIF1, NDUFS1, MDH1, PYGB
Mitochondrion (GO:0005739) RNASEL, UQCRC1, FDX1, NIT2, TMX4, HINT2, GCAT, WARS2, BPHL, UQCRFS1, ATP5G3, SFXN5, GOT2, DDX28, NT5M, GPX4, SLC25A3, TIMM23B, ACAD9, NDUFS1,
Table 4GO classes overrepresented in modules identified by WGCNA(Continued)
HSD17B8, PDK1, PDK2, NDUFA5, NDUFB10, AIFM3, ACO2, SLC25A5, AMACR, CRAT, SARS2, COX6C, SDHA, NFU1, MRPS18A, ATP5C1, ATPIF1, PRODH
Yellow module
GO class Genes present
Lipid biosynthetic process (GO:0008610)
TM7SF2, CYP51A1, ACSS2, PEX7, ELOVL1, FAR1, ELOVL5, DHCR7, SERINC1, PRKAA1, HSD17B3, PCYT1B, SCD5, PCYT2, AGPAT4, GAL3ST1, PLD1, PLP1, LPGAT1, FADS1, FA2H, PIGT, PIGS, CFTR, CERCAM, PIGP, PTGDS, C5ORF4, SMPD1, MVK, IDI1, DEGS1
Steroid metabolic process (GO:0008202)
TM7SF2, SREBF1, OSBPL5, MBTPS2, CYP51A1, CFTR, ABCA2, DHCR7, INSIG1, PRKAA1, MVK, HSD17B3, IDI1, LIPE, VLDLR, CLN6
Similar to the observations regarding the lightgreen module, the pink module is also characterized by a com-bination of genes involved in active regulation of im-munity and those involved in more neuroprotective mechanisms.
Modules negatively correlated to HPA-axis activity, independent of disease severity
The tan module had a module eigengene that was nega-tively correlated to cortisol levels (r =−0.63, p = 7.0E-04)
and numbers of CRH neurons (r=−0.61,p= 1.0E-03). The
module contained 253 genes and was enriched for
mole-cules in the GO class ‘generation of precursor metabolites
and energy’(p= 7.6E-10) and‘mitochondrion’(p= 1.3E-10), which are likely related to changes in mitochondrial func-tioning and energy metabolism known to occur in MS (Table4) .
The yellow module had a module eigengene that was strongly correlated negatively to cortisol levels (r=−0.63,
p = 7.0E-04) and numbers of CRH neurons (r =−0.57,
p = 3.0E-03). The module contained 922 genes and was
enriched for molecules belonging to the GO class ‘lipid
biosynthetic process’(p= 1.7E-05) and‘steroid metabolic
process’(p= 2.4E-02) (Table4). One particularly
interest-ing member of both enriched GO classes in the tan
module was aconitase (ACO2). ACO2 is activated by iron and is involved in glutamate production [57], while both iron accumulation and glutamate excitotoxicity are
impli-cated as pathogenic mechanisms in MS [30,68].
Genes associated with severity of MS and HPA-axis activity, independent of WGCNA modules
The WGCNA also produces direct correlations between genes and traits of interest, independent of gene mod-ules. These correlations can be used to select individual genes that may be strongly related to HPA-axis activity as well as to disease severity and may therefore offer po-tential in development of therapeutic strategies for MS. The 10 genes with the strongest positive or negative cor-relation with disease severity and cortisol are depicted in Table5.
Several molecules among the genes positively corre-lated to cortisol levels are well-known for their promin-ent role in shaping adaptive immune responses. For example, retinoic acid receptor alpha (RXRA) showed the strongest positive correlation with cortisol levels. Interestingly, RXRA-mediated signaling enhances
differ-entiation of functionally competent CD4+ regulatory T
cells and potently inhibits the formation of CD4+ T
helper 17 cells, the latter of which have been strongly
Table 5Genes most strongly associated to cortisol levels and disease duration
Cortisol Duration of MS
Gene Corr P Gene Corr P
Positive correlations
1 RXRA 0.88 9.1E-09 1 NFE2 0.74 6.8E-04
2 HEYL 0.83 2.1E-07 2 CHODL 0.72 1.1E-03
3 PDGFA 0.83 2.9E-07 3 SLC16A6 0.70 1.9E-03
4 RND3 0.83 3.5E-07 4 DEFB1 0.68 2.5E-03
5 GJA4 0.82 3.9E-07 5 PSPH 0.68 2.8E-03
6 IGFBP4 0.82 5.1E-07 6 MYB 0.67 3.2E-03
7 IL7R 0.81 8.7E-07 7 GDF10 0.67 3.2E-03
8 NPTX2 0.80 1.3E-06 8 CST7 0.67 3.3E-03
9 MAOA 0.80 1.8E-06 9 CNTN3 0.67 3.5E-03
10 TLN2 0.80 1.8E-06 10 HOXA6 0.67 3.6E-03
Negative correlations
1 ANKRD16 −0.82 5.5E-05 1 MSRA −0.80 1.2E-04
2 ALKBH3 −0.78 2.1E-04 2 NBR2 −0.71 1.6E-03
3 DNM2 −0.78 2.5E-04 3 GNG7 −0.67 3.1E-03
4 TMEM185B −0.77 2.7E-04 4 SFPQ −0.67 3.4E-03
5 FIBP −0.77 2.8E-04 5 APC −0.67 3.6E-03
6 SERAC1 −0.77 3.0E-04 6 SNX8 −0.63 7.0E-03
7 PLS3 −0.76 3.8E-04 7 COL20A1 −0.61 9.3E-03
8 ATP5C1 −0.76 4.0E-04 8 CTTNBP2NL −0.60 1.1E-02
9 PDE6B −0.76 4.2E-04 9 RAI14 −0.59 1.2E-02
10 OPALIN −0.75 4.9E-04 10 ADAM10 −0.58 1.4E-02
implicated in various autoimmune pathologies, including
MS [6, 15, 18, 19, 22, 39, 62, 78]. Indeed, retinoic acid
and other vitamin-A derivatives were shown to be pro-tective in animal models of autoimmune disease [56]. Notably, IL7R was also present among the 10 genes most positively correlated to cortisol levels. In combin-ation with its presence in the pink module, which showed the strongest positive correlation with cortisol levels in the CSF and numbers of CRH-expressing neu-rons on the PVN, this further confirms the positive asso-ciation of IL7R expression with HPA-axis activity in MS. Another interesting members of the 10 genes most posi-tively correlated to cortisol levels is gap junction alpha-4 protein (GJA4), as it is strongly expressed by endothelial cells and may affect leukocyte trafficking [71]. Expres-sion of ankyrin repeat domain-containing protein 16 (ANKRD16) showed the strongest negative correlation to levels of cortisol in CSF. However, not much is known about this protein. The gene most strongly correlated to disease duration is the transcription factor NF-E2 45 kDa subunit (NFE2), which has been shown to play a role in differentiation and maturation of erythroid cells [49]. The strongest negative association to duration was seen for the gene coding for methionine sulphoxide re-ductase A (MSRA), which is involved in protection against oxidative stress [85].
Group-wise comparisons using linear regression (LIMMA) The median cortisol level (220.5 nmol/l) was used to ob-jectively divide the MS-patient population into two
sub-groups, allowing comparison of groups for gene
expression profiles that might reveal associations with HPA-axis activity. Similarly, the median duration of MS was used to create an objective subdivision between pa-tients with relatively severe or mild disease (i.e., having a disease course shorter or longer than 24 years, respect-ively), to compare these groups for identification of dif-ferences in gene expression profiles related to disease severity. Two patients in the study population had a dis-ease duration of exactly 24 years. These were included in the group of patients with severe MS, as their disease duration was shorter than the median disease duration of 24.5 years in the entire MS-donor population of the Netherlands Brain Bank. The results of the different
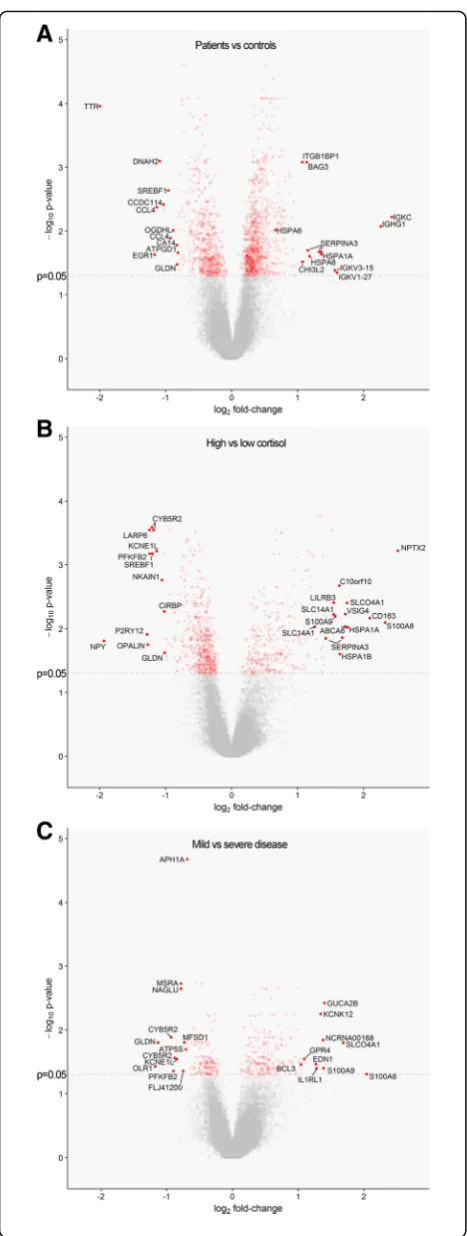
comparisons are shown in Fig. 3 and Additional file 2,
direction highlighted. The GO classes enriched in the comparisons according to functional annotation
cluster-ing analysis are depicted in Table6.
Comparison of MS patients and controls
Compared to control subjects, a total of 778 genes was sig-nificantly upregulated in MS patients, whereas 544 genes were downregulated. The four most strongly upregulated genes in NAWM of MS patients code for antibody sub-units, which is possibly related to the synthesis of
auto-antibodies in MS (Fig.3a) [20]. Furthermore, NAWM
of MS patients showed an increased expression of heat-shock proteins, HSPA1A and HSPA6. Among the genes upregulated in NAWM of MS patients compared to that of control subjects, there was an enrichment for mole-cules in GO classes associated with induction of apoptosis, activation of caspases, regulation of T-cell activation, and cytokines binding (Table6).
Compared to control NAWM, the gene showing the most strongly decreased expression in MS NAWM was transthyretin (TTR), which was downregulated 4-fold (Fig. 3a). TTR is an important carrier in serum and CSF for the thyroid hormone thyroxin (T4) and for retinol, a form of vitamin A. Importantly, both TTR and T4 have been im-plicated in MS. Oxidative modifications of TTR protein and decreased levels of T4 were present in the CSF, and not in the serum, of MS patients and were correlated with disease duration [67]. Moreover, T4 was shown to play an important role in activating oligodendrocyte precursor ac-tivation and instill myelination [9].
GO classes overrepresented among the genes down-regulated in NAWM of MS relative to control NAWM were related to neuron differentiation, cell projection,
and regulation of lipid metabolism (Table6).
Comparison of MS patients with high and low cortisol In MS patients with high cortisol a total of 270 genes was upregulated, whereas 472 genes were downregulated Table 6GO classes overrepresented in genes differentially
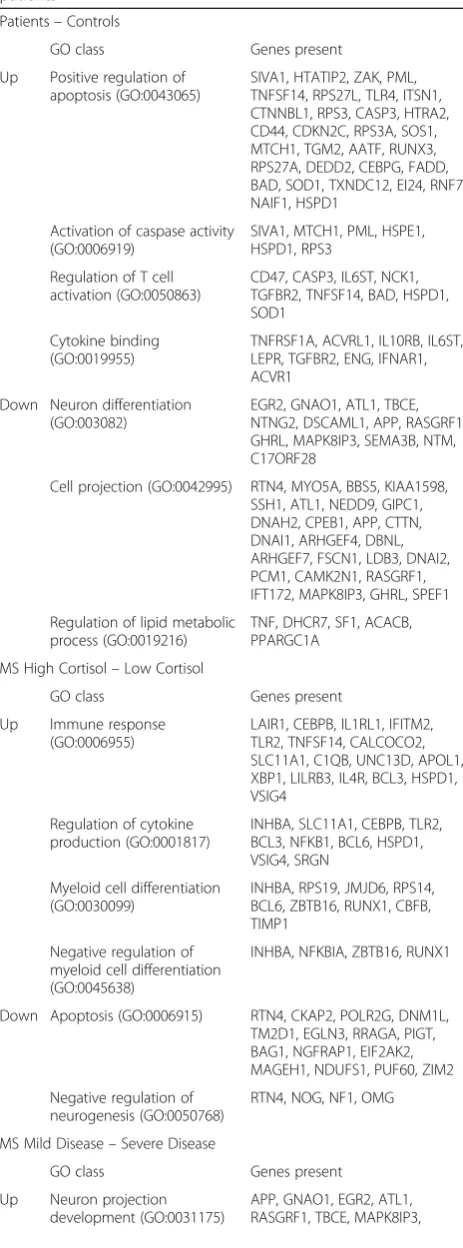
expressed between control subjects and (subgroups of) MS patients
Patients–Controls
GO class Genes present
Up Positive regulation of apoptosis (GO:0043065)
SIVA1, HTATIP2, ZAK, PML, TNFSF14, RPS27L, TLR4, ITSN1, CTNNBL1, RPS3, CASP3, HTRA2, CD44, CDKN2C, RPS3A, SOS1, MTCH1, TGM2, AATF, RUNX3, RPS27A, DEDD2, CEBPG, FADD, BAD, SOD1, TXNDC12, EI24, RNF7, NAIF1, HSPD1
Activation of caspase activity (GO:0006919)
SIVA1, MTCH1, PML, HSPE1, HSPD1, RPS3
Regulation of T cell activation (GO:0050863)
CD47, CASP3, IL6ST, NCK1, TGFBR2, TNFSF14, BAD, HSPD1, SOD1
Cytokine binding (GO:0019955)
TNFRSF1A, ACVRL1, IL10RB, IL6ST, LEPR, TGFBR2, ENG, IFNAR1, ACVR1
Down Neuron differentiation (GO:003082)
EGR2, GNAO1, ATL1, TBCE, NTNG2, DSCAML1, APP, RASGRF1, GHRL, MAPK8IP3, SEMA3B, NTM, C17ORF28
Cell projection (GO:0042995) RTN4, MYO5A, BBS5, KIAA1598, SSH1, ATL1, NEDD9, GIPC1, DNAH2, CPEB1, APP, CTTN, DNAI1, ARHGEF4, DBNL, ARHGEF7, FSCN1, LDB3, DNAI2, PCM1, CAMK2N1, RASGRF1, IFT172, MAPK8IP3, GHRL, SPEF1
Regulation of lipid metabolic process (GO:0019216)
TNF, DHCR7, SF1, ACACB, PPARGC1A
MS High Cortisol–Low Cortisol
GO class Genes present
Up Immune response (GO:0006955)
LAIR1, CEBPB, IL1RL1, IFITM2, TLR2, TNFSF14, CALCOCO2, SLC11A1, C1QB, UNC13D, APOL1, XBP1, LILRB3, IL4R, BCL3, HSPD1, VSIG4
Regulation of cytokine production (GO:0001817)
INHBA, SLC11A1, CEBPB, TLR2, BCL3, NFKB1, BCL6, HSPD1, VSIG4, SRGN
Myeloid cell differentiation (GO:0030099)
INHBA, RPS19, JMJD6, RPS14, BCL6, ZBTB16, RUNX1, CBFB, TIMP1
Negative regulation of myeloid cell differentiation (GO:0045638)
INHBA, NFKBIA, ZBTB16, RUNX1
Down Apoptosis (GO:0006915) RTN4, CKAP2, POLR2G, DNM1L, TM2D1, EGLN3, RRAGA, PIGT, BAG1, NGFRAP1, EIF2AK2, MAGEH1, NDUFS1, PUF60, ZIM2
Negative regulation of neurogenesis (GO:0050768)
RTN4, NOG, NF1, OMG
MS Mild Disease–Severe Disease
GO class Genes present
Up Neuron projection development (GO:0031175)
APP, GNAO1, EGR2, ATL1, RASGRF1, TBCE, MAPK8IP3,
Table 6GO classes overrepresented in genes differentially expressed between control subjects and (subgroups of) MS patients(Continued)
NTNG2, DSCAML1, GHRL, SEMA3B
Neuron differentiation (GO:0030182)
EGR2, GNAO1, ATL1, TBCE, NTNG2, DSCAML1, APP, RASGRF1, GHRL, MAPK8IP3, SEMA3B, NTM, C17ORF28
Inflammatory response (GO:0006954)
HDAC5, YWHAZ, TNF, NDST1, TOLLIP, CCL3L3, ITIH4, CCL4L1, CCL4
Down Lysosome (GO:0005764) HGSNAT, SGSH, NAGLU, MFSD8, LIPA, GM2A, PPT1, CD63, ASAH1
Steroid metabolic process (GO:0008202)
compared to patients with low cortisol. Of note, the third most-strongly upregulated gene in MS patients with high cortisol by more than 4-fold was CD163 (Fig. 3b), which is a glucocorticoid-responsive gene that can be induced in myeloid immune cells, such as
macro-phages and microglia [59,80].
Neuronal pentraxin-2 (NPTX2) was the gene most strongly increased in NAWM of MS patients with high cortisol, showing an almost 6-fold higher expres-sion in comparison to NAWM of patients with low
cortisol (Fig. 3b). NPTX2 is an immune-related
mol-ecule with structural similarities to several acute phase proteins that is thought to be essential in the compensatory synaptic response that occurs during prolonged neuronal inactivity [69]. An interesting finding regarding the 10 most strongly downregulated genes in NAWM of MS patients with high cortisol was the
pres-ence of the purinergic receptor P2RY12 (Fig.3b), a
micro-glia signature gene shown to play a major role in microglial activation, synaptic plasticity, and closure of the injured blood-brain barrier [8,52,76].
Interestingly, analysis by functional annotation cluster-ing on the genes that are upregulated in MS patients with high cortisol levels, in comparison to patients with low cortisol levels, are enriched for several GO classes
associated with (regulation of ) inflammation (Table 6).
In contrast, there is an overrepresentation of GO classes associated with apoptosis and negative regulation of neurogenesis among the genes showing decreased ex-pression in MS patients with high cortisol.
Comparison of MS patients with severe and mild disease In total 202 genes were upregulated in patients with mild MS, whereas 154 genes were downregulated compared to those with severe MS. There is a clear overlap between genes upregulated in MS patients with mild disease and those with high cortisol, as for example S100A8 and solute carrier organic anion
transporter family member 4A1 (SLCO4A1) are
present in the top 10 most strongly upregulated genes in both groups. IL-1 receptor like 1 (IL1R1) is among the 10 most strongly upregulated genes in mild MS
(Fig. 3c), and is known to be a receptor for IL-33 and
has been shown to be involved in induction of Th2 responses during allergic inflammation [73]. The oxi-dized low-density lipoprotein receptor 1 (OLR1) gene, also known as LOX-1, was the most downregulated
gene in NAWM of MS patients mild disease (Fig. 3c).
Interestingly, this gene was found to be strongly re-lated to the extent of demyelination in white matter MS lesions [33]. The upregulated genes in NAWM of MS patients with mild disease were enriched for GO classes involved in neuron development and differen-tiation as well as the inflammatory response.
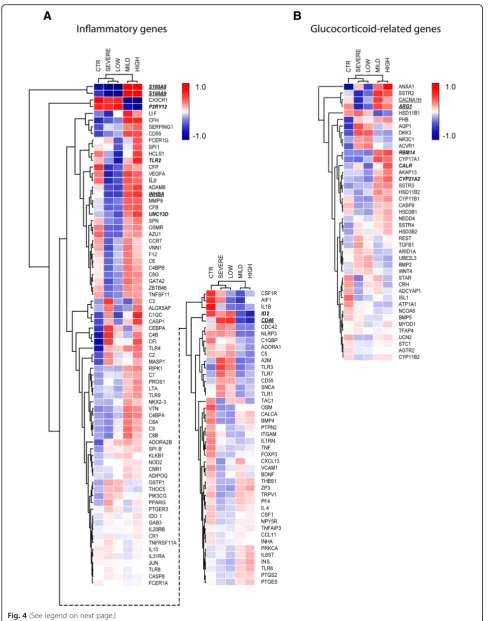
Distinct expression profile of inflammatory and GC-related genes in patients with high cortisol or mild MS For the next analysis, we selected genes included in GO classes related to either inflammation or glucocorticoid
signaling, including:‘regulation of acute inflammatory
re-sponse’ (GO:0002673), ‘chronic inflammatory response’
(GO:0002544),‘macrophage differentiation’(GO:0030225),
‘microglial cell activation’ (GO:0001774), ‘
glucocorticoi-d-receptor signaling pathway’(GO:0042921), and‘cellular
response to glucocorticoids’ (GO:0071385) and ‘
gluco-corticoid biosynthetic process’ (GO:0006704). These GO
classes were selected to specifically study to what extent HPA-axis activity impacts on molecular mechanisms in NAWM of MS and how this affects neuroinflammation and disease severity. To this end, the selected genes were compared for their expression between five groups: con-trol subjects, MS patients with high and low cortisol levels, and MS patients with severe and mild disease. This was done by cluster analysis, to find out which groups most strongly resemble each other in expression profiles for the selected genes. Interestingly, a distinct expression profile was present for inflammatory and glucocorticoid-associated genes in MS patients with high cortisol and those with mild
MS (Fig.4a and b). These subgroups differed in this respect
from MS patients with low cortisol or severe MS, and con-trol subjects. Remarkably, the subgroups of MS patients with high cortisol and those with mild MS were especially similar with respect to higher average expression values for inflammatory genes, when compared to the other three subgroups.
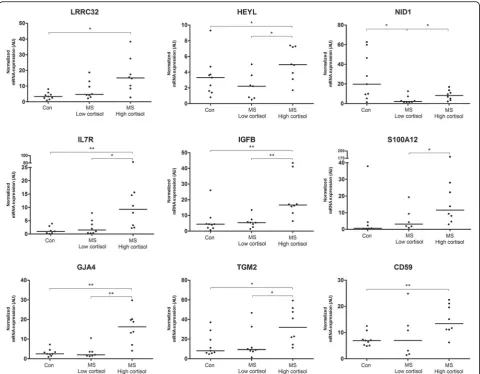
Molecules selected for validation
Expression of in total 14 genes strongly associated with HPA-axis activity and/or disease duration was validated by qPCR. For this purpose, the same tissue was used as for generating the original microarray data. For several of the validated targets no alterations have been de-scribed in the context of MS before, such as leucine-rich repeat-containing protein 32 (LRRC32) and nidogen-1 (NID1). Others have been implicated in MS pathogen-esis, but were never studied in human subjects for their association with disease severity or HPA-axis activity,
such as IL7R, tissue transglutaminase (TGM2),
MAC-inhibitory protein (CD59), and gap junction
alpha-4 (GJA4) [10, 41, 77, 83]. For 11 out of 14 genes
the expression profile was indeed confirmed by qPCR
(Fig.5). Genes for which the qPCR data did not confirm
subgroups was detected by qPCR, but apparently those differences were not large enough to be significant.
Discussion
This is the very first study, to our knowledge, that reports on genome-wide transcriptional changes in NAWM of MS in relation to disease severity as well as activity of the HPA axis. To this end, we purposefully included female MS brain donors that differed strongly in rate of disease progression and HPA-axis activity. This enabled us to
define gene expression profiles associated with disease se-verity in NAWM that are cortisol-dependent and inde-pendent, thereby giving a novel and comprehensive insight into the molecular underpinnings of the clinical heterogeneity that is so characteristic for MS. Importantly, we identified a range of molecular changes associated with a more benign or aggressive disease course in MS that may be targeted for development of new therapeutic strat-egies. In addition, we uncovered disease-associated gene expression profiles by comparative analysis with white (See figure on previous page.)
Fig. 4Cluster analysis of absolute expression of genes involved in inflammation and gluco-corticoid signaling. a Cluster analysis based on genes included in the GO classes‘regulation of acute inflammatory response’,‘chronic inflammatory response’,‘macrophage differentiation’, and‘microglial cell activation’. b Cluster analysis based on genes included in the GO classes‘glucocorticoid-receptor signaling pathway’,‘cellular response to glucocorticoids’, and‘glucocorticoid biosynthetic process’. Underlined are genes for which expression differed significantly between MS patients with mild and severe disease. Genes written in bold and italic show a significant difference between patients with high and low cortisol
matter from control brain donors, yielding additional mo-lecular targets that may be exploited therapeutically as well.
Data analysis was done using various approaches, in-cluding WGCNA and group-wise comparisons of con-trol subjects and (subpopulations of ) MS patients. By
WGCNA, we were able to identify clusters of
co-regulated genes that correlate with one or more indi-cators of MS-disease severity and HPA-axis activity. Irre-spective of their module membership, genes were also studied individually for their association with the same clinical and endocrinological parameters. In this way, the data uncovered many novel genes positively or nega-tively associated with HPA-axis activity and/or severity of MS. In general, gene expression profiles associated with high cortisol production and mild MS were charac-terized by molecules that actively regulate inflammation, but also belong to pathways involved in proliferation of neural stem cells. Together, these data reveal that HPA-axis activity strongly impacts on molecular mecha-nisms/changes in NAWM of MS patients, but these changes are in part independent of the transcriptional changes associated with disease severity.
We show that gene expression profiles associated with high cortisol production and mild MS patients are char-acterized by molecules that negatively regulate inflam-mation and immunity, such as NLRP12, S1PR4, S100A8,
S100A9, and S100A12 [1,3,13,64,74]. In this way, our
study identifies various molecular targets that may be assessed for their potential to prevent MS pathology in NAWM or limit lesion formation.
The light green gene module is the most relevant
mod-ule for unraveling the molecular mechanisms of
cortisol-mediated suppression of MS-disease progression, as it was correlated to numbers of CRH neurons, cortisol levels, and duration of MS. Functional annotation cluster-ing analysis pointed out that the lightgreen module con-tained several genes that may be associated with slower progression of MS by regulation of inflammation. Notable molecules present in the lightgreen cluster are S100A8 and S100A9, which are strongly expressed by myeloid im-mune cells, have well-established immunoregulatory prop-erties and are implicated in protection against oxidative stress [34]. The endogenous danger signal S100A9 plays a key role in immune escape of solid tumors, where its chronic expression in myeloid cells inhibits their matur-ation and thereby skews them to an immunosuppressive phenotype [13]. Moreover, S100A8 and S100A9 serve as inflammatory biomarkers in several autoimmune disor-ders, such as systemic lupus erythematosus and
inflamma-tory bowel disease [42, 46, 63]. The anti-inflammatory
role of S100A8 and S100A9 are further indicated by the finding that glucocorticoids directly induce these proteins in human monocytes and dendritic cells, and that
S100A8-positive macrophages are increased in synovial fluid after treatment of rheumatoid arthritis patients with high-dose methylprednisolone [34].
Another prominent immunoregulatory molecule in the lightgreen module was NLR family, pyrin domain-containing 12 (NLRP12), which was present in several enriched GO classes, such as‘regulation of IL-1b production’and‘negative
regulation of cytokine biosynthetic process’. Moreover,
NLRP12 expression was highly correlated to cortisol levels. NLRP12 is strongly expressed by myeloid cells and has been
found to suppress canonical and non-canonical NF-κB
sig-nalling [1,2,37,50,86]. As such, NLRP12 is able to inhibit Toll-like receptor-induced activation and chemokine produc-tion in monocytes and other myeloid cells [50] .
In our WGCNA analysis, we also assessed to what ex-tent the expression pattern of a gene resembles that of the whole module by looking at the connectivity of genes to the module eigengene. Interestingly, GJA4 (gap-junction alpha-4) not only was among the 10 genes most strongly correlated to cortisol, but was also signifi-cantly upregulated in mild MS. The expression of GJA4 has been shown to protect against the formation of ath-erosclerotic plaques by decreased recruitment and local adhesion of monocytes, a mechanism that is thought to be crucially involved in formation of MS lesions [87]. Therefore, high levels of cortisol in MS patients may in-crease expression of GJA4 on monocytes to diminished their recruitment into the CNS and thereby limit MS pathology.
By studying direct correlations between individual genes with cortisol levels and/or duration of MS, we found several genes that are implicated in (inhibition of )
remyelination. Examples are ASPM (abnormal
spindle-like microcephaly-associated protein) and TLR2 (Toll-like receptor 2) [31]. Other genes may be more re-lated to neuroprotection. One of these is NPTX2 (neur-onal pentraxin-2), which showed a strong correlation to cortisol and was highly increased in MS patients with high cortisol compared to those with low cortisol. This gene is also known as neuronal activity-regulated pentra-xin (NARP) and has been shown to be essential for long-term synaptic plasticity, in particular in formation
and maintenance of excitatory synapses [69, 88]. As
such, NPTX2 may be an important neuroprotective gene in MS that is induced by glucocorticoids.
The pink module showed the strongest positive correl-ation with HPA-axis activity, both for its correlcorrel-ation with cortisol levels in CSF and numbers of CRH-positive neu-rons in the PVN. The module was enriched for genes
in-volved in several GO classes, such as ‘regulation of
caspase activity’ and ‘heat shock protein binding’. In
addition, also genes belonging to the GO class ‘
regula-tion of lymphocyte activaregula-tion’ were enriched. Among
striking, as it shows a high allelic association with MS
susceptibility [28,41]. IL7R was also found to be induced
by dexamethasone in human blood leukocytes, which may explain why its expression was strongly correlated to levels of CSF cortisol in MS patients [23]. Ligation of IL7R by IL-7 was found to be required for autoimmune neuroinflammation in experimental autoimmune en-cephalomyelitis [47]. Moreover, it was recently reported that downregulation of IL7R expression in oligodendro-cytes contributes to CNS demyelination in zebrafish [48]. Thus, IL7R may play opposing roles in MS patho-genesis depending on the cell type it is expressed on. This may also explain why no correlation between IL7R expression and disease severity was observed.
HSPA1A (heat shock protein family A member 1A, Hsp70) and SERPINA3 (serpin family A member 3,
alpha1-antichymotrypsin) were higher expressed in
NAWM of MS patients with high cortisol compared to those with low cortisol. Heat-shock proteins have been shown to play an important role in limiting T-cell
medi-ated (chronic) inflammation [65,81]. However, expression
of these genes was increased in NAWM of all MS patients when compared to control subjects. This may indicate that upregulation of this pathway represents a general pro-tective mechanism in NAWM of MS that is further en-hanced under the influence of high HPA-axis activity.
Importantly, the expression profile of most genes se-lected for validation could be confirmed by qPCR. How-ever, for the few genes selected for further analysis at the protein level, the signal generated by the antibodies used was not specific enough to enable us to draw clear con-clusions about cellullar distribution and potential ex-pression differences. Still, the qPCR data provide valuable biological evidence that observed expression differences in the microarray data are real. In this re-spect, LRRC32 is particularly notable gene, as qPCR ana-lysis indicated clearly elevated levels of expression in MS patients with high cortisol or mild MS. LRRC32 is a key
regulator of transforming growth factor beta (TGF-β),
which is known to be involved maintaining the molecu-lar and functional signature of microglia [8]. Moreover,
TGF-β is known to promote development of either
CD4+
regulatory T cells [12]. It is tempting to speculate that, in concert with increased IL7R expression in pa-tients with high cortisol and mild MS, this may indicate the presence of mechanism that serves to maintain a population of T cells with a regulatory phenotype to limit autoimmunity. As the expression of LRRC32 was also very significantly increased in all MS patients com-pared to controls subjects (data not shown), this could be a general mechanism that is is at play in MS NAWM. In summary, our data indicate that HPA-axis activity strongly impacts on molecular mechanisms in NAWM of MS patients and thereby has modulatory effects on
MS-disease activity. This extends the findings we re-ported previously [58]. When observing the molecular profiles associated with high HPA-axis activity and rela-tively mild MS, what is in general most striking is the enhanced expression of genes that actively regulate in-flammation. At the same time, NAWM does not show signs of active inflammation. While this has also been indicated by previous studies, our data are the first to in-dicate more clearly how MS patients may benefit from approaches that promote specific physiological mecha-nisms for immunosuppression under conditions of chronic inflammation, such as induction of NLRP12, S100A8, and S100A9. At the same time, our data also indicate that high HPA-axis activity is associated with changes in molecular pathways that may affect multiple aspects of MS disease activity to slow down clinical pro-gression. For example, there is a clear increase in the
ex-pression of genes involved in remyelination and
pathways that likely exert a protective effect against for example oxidative stress, synaptic disintegration, and axonal damage. Most importantly, the study led us to uncover a range of molecular changes associated with a more benign or aggressive disease course in MS that may be targeted for development of new therapeutic strategies. This brings up the important question whether the current regimens for glucocorticoid treat-ment of MS patients actually promote the molecular mechanisms associated with slow disease progression detected in our study and, if not, how these regimens can be adjusted to ensure that they do. Additionally, it would be important to find out of those same molecular mechanisms associated with slow progression of MS in this study can be induced more effectively or directly without the use of glucocorticoids, especially in those MS patients that respond poorly to glucocorticoids treat-ment. By comparing MS patients to control subjects, we were able to define disease-associated gene expression profiles in NAWM, which revealed additional molecular targets that may be used for therapeutic exploitation. Since only females were included in this study, it would be important to verify to what extent our findings are also relevant for male patients. This strongly warrants in vitro and in vivo studies to validate which of the molecu-lar targets identified here display the biggest therapeutic potential for the treatment of MS.
Additional files
Additional file 1:GO analyses. (XLSX 15 kb)
Additional file 2:DE genes. (XLSX 266 kb)
Acknowledgements
Funding
This study was financed by MS Research grant MS03-525ext and Vriendenlo-terij grant MS09–666.
Availability of data and materials
Microarray data have been uploaded in the Gene Expression Omnibus (GEO) database. The GEO accession number to access the complete dataset is: GSE126802.
Authors’contributions
In order of the author list: JM performed and interpreted all analyses and wrote the manuscript. MO, KB, and MRJM contributed to the data analysis. KGS and CGvE helped with the experimental work. JV provided critical intellectual input. JH and IH supervised all of the work and provided feedback on the manuscript. All authors read and approved the final manuscript.
Ethics approval and consent to participate
The Netherlands Brain Bank received permission to perform autopsies and to use tissue and medical records from the Ethical Committee of the VU University medical center (VUmc, Amsterdam, The Netherlands). All donors have given informed consent for autopsy and use of their brain tissue for research purposes.
Consent for publication
All authors have approved the manuscript for submission.
Competing interests
The authors declare that they have no competing interests.
Publisher’s Note
Springer Nature remains neutral with regard to jurisdictional claims in published maps and institutional affiliations.
Author details
1Department of Neuroimmunology, Netherlands Institute for Neuroscience,
Institute of the Royal Netherlands Academy of Arts and Sciences, Amsterdam, The Netherlands.2Department of Astrocyte Biology and
Neurodegeneration, Netherlands Institute for Neuroscience, Institute of the Royal Netherlands Academy of Arts and Sciences, Amsterdam, The Netherlands.3Department of Neuroregeneration, Netherlands Institute for Neuroscience, Institute of the Royal Netherlands Academy of Arts and Sciences, Amsterdam, The Netherlands.4Department of Experimental Immunology, Amsterdam Infection & Immunity Institute, Amsterdam UMC, University of Amsterdam, Amsterdam, The Netherlands.
Received: 3 August 2018 Accepted: 21 March 2019
References
1. Allen IC, Wilson JE, Schneider M et al (2012) NLRP12 suppresses colon inflammation and tumorigenesis through the negative regulation of noncanonical NF-κB signaling. Immunity 36(5):742–754
2. Arthur JC, Lich JD, Aziz RK, Kotb M, Ting JP-Y (2007) Heat shock protein 90 associates with monarch-1 and regulates its ability to promote degradation of NF-kappaB-inducing kinase. J Immunol 179(9):6291–6296
3. Baillet A, Trocmé C, Berthier S et al (2010) Synovial fluid proteomic fingerprint: S100A8, S100A9 and S100A12 proteins discriminate rheumatoid arthritis from other inflammatory joint diseases. Rheumatology 49(4):671– 682
4. Berilgen MS, Bulut S, Ustundag B, Tekatas A, Ayar A (2005) Patients with multiple sclerosis have higher levels of serum ghrelin. Neuro Endocrinol Lett 26(6):819–822
5. Bielekova B, Kadom N, Fisher E et al (2005) MRI as a marker for disease heterogeneity in multiple sclerosis. Neurology 65(7):1071–1076
6. Brucklacher-Waldert V, Stuerner K, Kolster M, Wolthausen J, Tolosa E (2009) Phenotypical and functional characterization of T helper 17 cells in multiple sclerosis. Brain 132(Pt 12):3329–3341
7. Burguillos MA, Deierborg T, Kavanagh E et al (2011) Caspase signalling controls microglia activation and neurotoxicity. Nature 472(7343):319–324
8. Butovsky O, Jedrychowski MP, Moore CS et al (2014) Identification of a unique TGF-β-dependent molecular and functional signature in microglia. Nat Neurosci 17(1):131–143
9. Calza L, Fernandez M, Giuliani A, Aloe L, Giardino L (2002) Thyroid hormone activates oligodendrocyte precursors and increases a myelin-forming protein and NGF content in the spinal cord during experimental allergic encephalomyelitis. Proc Natl Acad Sci U S A 99(5):3258–3263
10. Carrette F, Surh CD (2012) IL-7 signaling and CD127 receptor regulation in the control of T cell homeostasis. Semin Immunol 24(3):209–217 11. Chandler S, Coates R, Gearing A, Lury J, Wells G, Bone E (1995) Matrix
metalloproteinases degrade myelin basic protein. Neurosci Lett 201(3): 223–226
12. Chen W, Jin W, Hardegen N, Lei K-J, Li L, Marinos N, McGrady G, Wahl SM (2003) Conversion of peripheral CD4+CD25- naive T cells to CD4+CD25+ regulatory T cells by TGF-beta induction of transcription factor Foxp3. J Exp Med 198(12):1875–1886
13. Cheng P, Corzo CA, Luetteke N et al (2008) Inhibition of dendritic cell differentiation and accumulation of myeloid-derived suppressor cells in cancer is regulated by S100A9 protein. J Exp Med 205(10):2235–2249 14. Cid C, Alvarez-Cermeño JC, Camafeita E, Salinas M, Alcázar A (2004)
Antibodies reactive to heat shock protein 90 induce oligodendrocyte precursor cell death in culture. Implications for demyelination in multiple sclerosis. FASEB J 18(2):409–411
15. Coombes JL, Siddiqui KRR, Arancibia-Cárcamo CV, Hall J, Sun C-M, Belkaid Y, Powrie F (2007) A functionally specialized population of mucosal CD103+ DCs induces Foxp3+ regulatory T cells via a TGF-beta and retinoic acid-dependent mechanism. J Exp Med 204(8):1757–1764
16. de Groot M, Verhaaren BFJ, de Boer R, Klein S, Hofman A, van der Lugt A, Ikram MA, Niessen WJ, Vernooij MW (2013) Changes in normal-appearing white matter precede development of white matter lesions. Stroke 44(4): 1037–1042
17. DeBoy CA, Rus H, Tegla C, Cudrici C, Jones MV, Pardo CA, Small D, Whartenby KA, Calabresi PA (2010) FLT-3 expression and function on microglia in multiple sclerosis. Exp Mol Pathol 89(2):109–116 18. Denning TL, Wang Y-C, Patel SR, Williams IR, Pulendran B (2007) Lamina
propria macrophages and dendritic cells differentially induce regulatory and interleukin 17-producing T cell responses. Nat Immunol 8(10):1086–1094 19. Elias KM, Laurence A, Davidson TS, Stephens G, Kanno Y, Shevach EM,
O'Shea JJ (2008) Retinoic acid inhibits Th17 polarization and enhances FoxP3 expression through a Stat-3/Stat-5 independent signaling pathway. Blood 111(3):1013–1020
20. Elliott C, Lindner M, Arthur A et al (2012) Functional identification of pathogenic autoantibody responses in patients with multiple sclerosis. Brain 135(Pt 6):1819–1833
21. Foell D, Wittkowski H, Vogl T, Roth J (2007) S100 proteins expressed in phagocytes: a novel group of damage-associated molecular pattern molecules. J Leukoc Biol 81(1):28–37
22. Fujino S, Andoh A, Bamba S, Ogawa A, Hata K, Araki Y, Bamba T, Fujiyama Y (2003) Increased expression of interleukin 17 in inflammatory bowel disease. Gut 52(1):65–70
23. Galon J, Franchimont D, Hiroi N, Frey G, Boettner A, Ehrhart-Bornstein M, O'Shea JJ, Chrousos GP, Bornstein SR (2002) Gene profiling reveals unknown enhancing and suppressive actions of glucocorticoids on immune cells. FASEB J 16(1):61–71
24. Gillett A, Thessen Hedreul M, Khademi M, Espinosa A, Beyeen AD, Jagodic M, Kockum I, Harris RA, Olsson T (2010) Interleukin 18 receptor 1 expression distinguishes patients with multiple sclerosis. Mult Scler 16(9):1056–1065
25. Gold SM, Raji A, Huitinga I, Wiedemann K, Schulz K-H, Heesen C (2005) Hypothalamo-pituitary-adrenal axis activity predicts disease progression in multiple sclerosis. J Neuroimmunol 165(1–2):186–191
26. Grasser A, Möller A, Backmund H, Yassouridis A, Holsboer F (1996) Heterogeneity of hypothalamic-pituitary-adrenal system response to a combined dexamethasone-CRH test in multiple sclerosis. Exp Clin Endocrinol Diabetes 104(1):31–37
27. Gray E, Thomas TL, Betmouni S, Scolding N, Love S (2008) Elevated myeloperoxidase activity in white matter in multiple sclerosis. Neurosci Lett 444(2):195–198