World Maritime University
The Maritime Commons: Digital Repository of the World
Maritime University
World Maritime University Dissertations
Dissertations
2001
Chartering policies in the dry bulk market
Jie Liu
World Maritime University
Follow this and additional works at:
http://commons.wmu.se/all_dissertations
This Dissertation is brought to you courtesy of Maritime Commons. Open Access items may be downloaded for non-commercial, fair use academic purposes. No items may be hosted on another server or web site without express written permission from the World Maritime University. For more information, please [email protected].
Recommended Citation
Liu, Jie, "Chartering policies in the dry bulk market" (2001).World Maritime University Dissertations. 202.
WORLD MARITIME UNIVERSITY
Malmö, Sweden
CHARTERING POLICIES
IN THE DRY BULK MARKET
By
LIU JIE
The People’s Republic of China
A dissertation submitted to the World Maritime University in partial fulfilment of the requirements for the award of the degree of
MASTER OF SCIENCE
in
MARITIME AFFAIRS (Shipping Management)
2001
DECLARATION
I certify that all the material in this dissertation that is not my own work has been identified, and that no material is included for which a degree has previously been conferred on me.
The contents of this dissertation reflect my own personal views, and are not necessarily endorsed by the University.
(Signature) ...
(Date) ...
Supervised by:
Name: Prof. Tor Wergeland
Office: Shipping & Port management
Institution: World Maritime University
Assessor:
Name: Prof. Patrick Donner
Office: Shipping & Port Management
Institution: World Maritime University
Co-assessor:
Name: Prof. Patrick M. Alderton.
ACKNOWLEGEMENTS
My special thanks and appreciation go to the Ship & Ocean Foundation of Tokyo, Japan. Thanks for sponsoring the scholarship, which make my studies at World Maritime University possible.
I would like to thank all the professors, lectures, visiting professors and fellow students on the degree course, particularly Professor Shou Ma, for sharing his invaluable knowledge and experience and encouragement during my study; Professor Tor Wergeland, for providing supervision and all kinds of new thinking during the writing of this disseration; Professor Patrick Donner and Capt. Ian Horck, for sharing their treasured knowledge and comments with me; also, Mr. Bjorn Bodding of R.S. Platou Economic Research a.s, for supporting my study with his kind encouragement and valuable data.
My special thanks also extend to all staff of World Maritime University, especially, Susan Wangeci-Eklow and Cecilia Denne for their great assistance and encouragement during my research, and Clive Cole, for his assistance in the language correction of my dissertation.
ABSTRACT
Title of Dissertation: Chartering policies in the dry bulk market
Degree: M. Sc
This dissertation is a study of the dry bulk market, with main focus on trying to find fixed chartering rules, which enable ship owners to switch tonnage between spot market and time charter market, in order to obtain optimum revenue.
This dissertation is composed of three main chapters, plus the introduction and the conclusion.
In the introduction, the background and the purpose of the study are stated.
Chapter two deals with the economic analysis of the dry bulk shipping industry. Emphasis is put on the description of characteristics of the dry bulk market, and a discussion of the relationships between the spot market and the time charter market.
Chapter three focuses on developing potential chartering rules by analysing dry bulk market behaviour and market information.
In Chapter four, tests of potential chartering rules are carried out for different dry bulk segments. The results of the tests are analysed in order to provide useful information to shipowners.
Keywords:
TABLE OF CONTENTS
Declaration ii
Acknowledgement iii
Abstract iv-v
Table of contents vi-viii List of abbreviations ix
List of figures x
List of tables xi
Chapter I Introduction 1-2
Chapter II Characteristics of the dry bulk market 3-32
2.1 The Dry bulk commodities 3 2.2 The world dry bulk fleet 7 2.3 The dry bulk market 11 2.4 The dry bulk market characteristics 14
2.4.1 cyclical market 14 2.4.2 market of high risks and low return 16 2.4.3 perfect competition market 16 2.5 The spot market 17 2.5.1 freight rate determination in the spot market 17 2.5.2 reasons for trading in the spot market 19 2.6 The time charter market 21 2.6.1 determination of time charter rates 21
Chapter III Potential chartering rules 33-50
3.1 Dry bulk market behavior 33 3.1.1 analysis of the spot market 33 3.1.2 strategic decisions for ship owners 36
3.1.3 information needed 37 3.2 Market information tools 37 3.2.1 historical data 38
3.2.2 BIFFEX 40
3.3 Assessment of market performance 42 3.3.1 assessment by cash flow 42 3.3.2 assessment by return of investment 42 3.3.3 assessment by optimum revenue 43 3.4 Potential chartering rules on time charter decision 45 3.4.1 chartering rule based on capital cost 45 3.4.2 chartering rule based on BIFFEX 47
Chapter IV Tests of chartering rules 51-62
4.1 Tests on the Handysize market 51 4.1.1 the Handysize market 51 4.1.2 assessement of Handysize performance 52
4.1.3 tests of chartering rule and results anyalsis 53 4.2 Tests on the Handymax market 55 4.2.1 the Handymax market 55 4.2.2 assessement of Handymax performance 55
4.2.3 tests of chartering rule and results anyalsis 56 4.3 Tests on the Panamax market 58
4.3.1 the Panamax market 58 4.3.2 assessement of Panamax performance 58
4.4 Tests on the Capesize market 60 4.4.1 the Capesize market 60 4.4.2 assessement of Capesize performance 61
4.4.3 tests of chartering rule and results anyalsis 61
Chapter V Conclusion 63-65
Reference 66-67
Appendix I 68
Appendix II 69
Appendix III 70
Appendix IV 73
Appendix V 77
Appendix VI 79
Appendix VII 80
LIST OF ABBREVIATIONS
COA : Contract of Affreightment DWT : Deadweight
COMBI : Combined Carriers OBO : Ore/Bulk/Oil
OO : Ore/Oil OB : Ore/Bulk
PROBOS : Oil Products, Ore, Bulk BFI : Baltic Freight Index BDI : Baltic Dry Index
LIST OF FIGURES
LIST OF TABLES
CHAPTER I
INTRODUCTION
Background and purpose of study
Shipping is an industry with high risk and low return. In the dry bulk shipping market, volatility of spot freight rates is a major problem and concern for shipowners. Some of this volatility can be reduced by using existing forward and futures markets.
In the dry bulk sector, time charter rates tend to be less volatile than spot rates and the time charter market can be used to reduce risk. It is often used as a way to keep higher freight rates longer or to maintain a more stable freight rate level. In order to sign a time charter contract at the right time, shipowners need efficient tools to help them analyse the market situation, make strategic time charter decisions, and of course, the right decision will optimise their earnings.
Instead of trying to develop forecasting models in the dry bulk market, which is very difficult, it is more practical to identify simple criteria, which may help shipowners make time charter decisions. The purpose of this thesis is to find fixed chartering rules, which can help shipowners to obtain revenues closer to a theoretical optimum, without the need for perfect forecasts of future market conditions. The chartering rules are based on simple market information, available to every market player.
Two pairs of factors are chosen to develop the potential chartering rules: I. Capital cost of new buildings and historical time charter rates; II. BIFFEX and BFI (BDI)
The conclusion is that for the smaller bulk vessels, it is little if anything to be gained from using a fixed rule chartering policy, if the last 10 years is a representative period. For the Panamax and Capesize vessels, however, a fixed rule may increase daily incomes relative to a pure spot or time charter policy by some 200-300 $/day.
Methodology of research and difficulties encountered
The main methodology of research in this thesis is based on economic analysis. Calculations are based on the last 10 years’ spot freight rates (time charter equivalents), time charter hire rates, capital cost of new buildings, BFI and BFIFFEX on every segment of the dry bulk market.
CHAPTER II
CHARACTERISTSICS OF THE DRY BULK MAKET
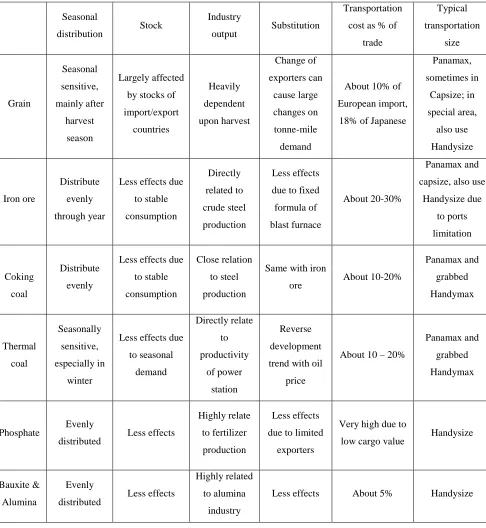
2.1 The dry bulk commodities
Five main bulk cargoes, namely iron ore, coal, grain, bauxite and alumina and phosphate
rock, contribute to about one-quarter of total seaborne cargo, and almost 70% of total
dry bulk cargoes. There are steadily growing trends of the five main bulk cargoes both in
tonnage and in tonne-mile following the rise in the world economy as illustrated in the
figures 2.1 and 2.2 in the recent 3 decades. The growth of the main dry bulk
commodities provides a solid ground for the development of dry bulk shipping.
The other minor bulk cargoes include steel products, forest products, sugar, non-ferrous
metal ores, fertilizers and various industrial materials. Not all of these minor bulk
cargoes are transported in the dry bulk market, some of them being traded by specialist
shipping, and some of them transported by liner shipping.
Despite the general trend of long-term grow each main dry cargo type follows its own
distinctive growth pattern. Some cargoes tend to be seasonally sensitive, such as grain
and thermal coal. Some others, such as bauxite and alumina are directly linked with
industrial productivity. Most of them are closely correlated to world economic
Figure 2.1 Dry bulk seaborne trade- main commodities
Source:
SSY annual dry bulk outlook 2000
Figure 2.2 Seaborne trade five major bulks in Tonne-miles
Source:
SSY annual dry bulk outlook 2000
Grain cargo is a seasonally sensitive cargo. First, grain cargo transportation is required
from the export countries strongly affect trade in grain. Thirdly, any changes of
exporters for substitution, i.e. shift from S. America to Australia or in reverse direction,
will cause large changes in tonne-mile demand, which makes the demand for grain
transportation difficult to forecast.
Iron ore and coking coal offer more stable demands on transportation. There is no
seasonal influence involved the cargo flow is evenly distributed throughout the year. The
affect on stock is also less due to a large volume of stock being considered
uneconomical. The impacts of substitution are also not so big. As formulas of blast
furnaces are often fixed, changes in suppliers are very rare. Therefore, the trader often
prefers to seek long-term contracts, either long–term time charter contracts or COA
(contracts of affreightment). In fact, only 30% of iron ore is traded on the spot market
(Stopford, 1997, p.85).
Thermal coal has a close relationship with the world oil price. As a substitution of crude
oil for power station demand thermal coal moves in the same direction to the oil price. It
is therefore very sensitive to the oil price. It also has a seasonal peak in winter.
The steadily growth of phosphate rock, bauxite & alumina for the last 3 decades is
highly related to industrial output. They are used as raw materials to produce fertilizers
and aluminum products respectively. Uncertainties of price and demand of the final
Table 2.1 Characteristics of five main bulk cargoes
Seasonal
distribution Stock
Industry
output Substitution
Transportation
cost as % of
trade Typical transportation size Grain Seasonal sensitive, mainly after harvest season Largely affected
by stocks of
import/export countries Heavily dependent upon harvest Change of exporters can cause large changes on tonne-mile demand
About 10% of
European import,
18% of Japanese
Panamax, sometimes in Capsize; in special area, also use Handysize Iron ore Distribute evenly through year
Less effects due
to stable consumption Directly related to crude steel production Less effects
due to fixed
formula of
blast furnace
About 20-30%
Panamax and
capsize, also use
Handysize due to ports limitation Coking coal Distribute evenly
Less effects due
to stable
consumption
Close relation
to steel
production
Same with iron
ore About 10-20%
Panamax and grabbed Handymax Thermal coal Seasonally sensitive, especially in winter
Less effects due
to seasonal demand Directly relate to productivity of power station Reverse development
trend with oil
price
About 10 – 20%
Panamax and
grabbed
Handymax
Phosphate Evenly
distributed Less effects
Highly relate
to fertilizer
production
Less effects
due to limited
exporters
Very high due to
low cargo value Handysize
Bauxite &
Alumina
Evenly
distributed Less effects
Highly related
to alumina
industry
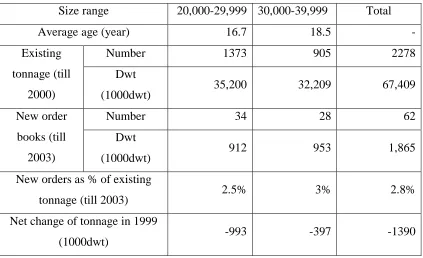
2.2 The world dry bulk fleet
There are four main sizes of dry bulk ships:
•
Handysize, with a deadweight range from 20,000 to 39,999dwt; typical
deadweight of 25,000dwt. This is a generic term derived from the fact that
these relatively small bulk carriers are capable of trading into most ports of
the world. Table 2.2 shows the newest development of Handysize fleet:
Table 2.2 Handysize fleet statistics (up to end of 2000)
Size range
20,000-29,999 30,000-39,999
Total
Average age (year)
16.7
18.5
-Number 1373
905
2278
Existing
tonnage (till
2000)
Dwt
(1000dwt)
35,200
32,209 67,409
Number 34
28
62
New order
books (till
2003)
Dwt
(1000dwt)
912
953 1,865
New orders as % of existing
tonnage (till 2003)
2.5%
3% 2.8%
Net change of tonnage in 1999
(1000dwt)
-993
-397 -1390
Source: Author derived from data in
SSY Annual Dry Bulk Outlook 2000
Compared with the development of the other dry bulk sector (11% of new order
books of Handymax fleet, 17.7% of Panamax and 14.6% of capsize, see figures in
table 2.3, 2.3 and 2.5), the development of the Handysize fleet is the slowest, and also
•
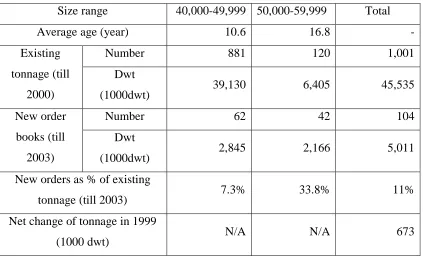
Handymax, with a deadweight range from 40,000 to 59,999dwt, typically
45,000dwt. This is the newly developed energetic branch of the dry bulk fleet.
The concept of Handymax with good cranes (normally 25 tons or even 50
tons) and often with self-loading/discharging facilities (grabs) emerged in the
1980’s and soon became the new trend of development in the dry bulk sector.
Table 2.3 Handymax fleet statistics (to the end of 2000)
Size range
40,000-49,999 50,000-59,999
Total
Average age (year)
10.6
16.8
-Number 881
120
1,001
Existing
tonnage (till
2000)
Dwt
(1000dwt)
39,130
6,405 45,535
Number 62
42
104
New order
books (till
2003)
Dwt
(1000dwt)
2,845
2,166 5,011
New orders as % of existing
tonnage (till 2003)
7.3%
33.8% 11%
Net change of tonnage in 1999
(1000 dwt)
N/A
N/A 673
Source: Author derived from data in
SSY Annual Dry Bulk Outlook 2000
The newly emerged Handymax sector of 50,000-59,999dwt enjoys great increase
in new orders, which most of them are geared dry bulk carriers with
self-discharging equipment. The distinctive between handymax over 50,000dwt and
old panamax vessels is unclealr. The average age of this category showed in
above table reflects the relatively older age of Panamax vessels in the
•
Panamax, with a deadweight range from 60,000 to 79,999dwt, typically
65,000dwt. These vessels are so named as they are designed to carry a
maximum amount of cargo whilst still being able to navigate the Panama
Canal, which has a maximum width of 32.3 meters.
Table 2.4 Panamax fleet statistics (up to the end of 2000)
Size range
60,000-79,999
Combined
fleet
60,000-79,999
Total
Average age (year)
11.6
16.8
-Number 915
41
956
Existing
tonnage (till
2000)
Dwt
(1000dwt)
63,098
3,032 66,130
Number 150
-
150
New order
books (till
2003)
Dwt
(1000dwt)
11,149
- 11,149
New orders as % of existing
tonnage (till 2003)
17.7%
- 16.8%
Net change of tonnage in 1999
(1000dwt)
2,749
-200 2,549
Sourec: Author derived from data in
SSY Annual Dry Bulk Outlook 2000
There are also Panamax vessels with optimized design can pass the Panamax
Canal with deadweight up to 80,000-85,000dwt. Shipowners of Panamax fleet
will face more sever competition in future due to large new orders on Panamax
•
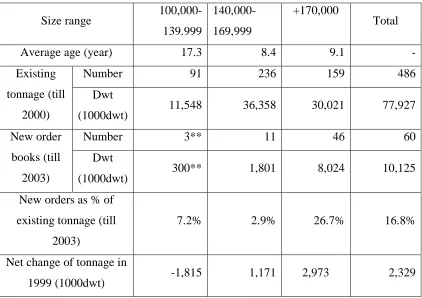
Capesize, with a deadweight over 80,000dwt, typically 140,000dwt. In theory
this is any vessel unable to pass through the Panamax canal and thus forced to
round the Cape of Good Hope to get from the Atlantic to the Pacific.
However, due to economies of scale this category really starts around 100,000
dwt up until the latest generation of ultra large bulk carriers of 365,000dwt
capacity.
Table 2.5 Capesize fleet statistics (to end of 2000)
Size range
100,000-139.999
140,000-169,999
+170,000
Total
Average age (year)
17.3
8.4
9.1
-Number 91
236
159
486
Existing
tonnage (till
2000)
Dwt
(1000dwt)
11,548
36,358
30,021 77,927
Number 3**
11
46 60
New order
books (till
2003)
Dwt
(1000dwt)
300**
1,801
8,024 10,125
New orders as % of
existing tonnage (till
2003)
7.2%
2.9%
26.7% 16.8%
Net change of tonnage in
1999 (1000dwt)
-1,815
1,171
2,973 2,329
** only for 100,000- 109,999 deadweight
Source: Author derived from data in
SSY Annual Dry Bulk Outlook 2000
•
In addition to this there are the so-called combination carriers COMBI, which
can be OBO, OO, OB and PROBOS (oil products, ore, bulk). OBO
2.3 The dry bulk market
When studying shipping markets, one realizes that there is more than one market
existing. Shipping markets can be divided into a freight market, a second hand market, a
newbuilding market and a demolition market according to different functions. Within
these markets, the freight market is the market where transportation services can be
bought and sold, the others all being concerned with trading the ‘asset’, the ship. The
freight market is the place where maritime services are sold and bought. The freight
rates, either spot rates or time charter rates are the prices of transportation services. The
main factors that decide the level of the freight rate, just like other commodities, are the
supply and demand of transportation services. The freight market often changes
dramatically due to the imbalance of these two factors. The dry bulk market is one of the
most important parts of the freight market. Figure 2.3 shows how the dry bulk freight
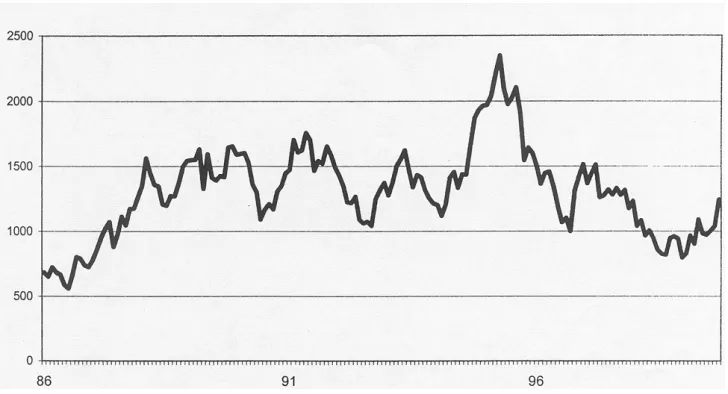
market developed during the recent 15 years (1986-2000) by Baltic Freight Index (BFI).
It is apparent that the market has passed through several significant phases from 1986 to
2000. The freight index has changed greatly with the highest point of 2,352 in 1995 and
the lowest point of 554 in 1986, a variation of 5 times from the highest to the lowest.
There were thirteen occasions on which the index moved several hundred points up or
down in a period of a few months. The reasons for these dramatic changes are the
never-ending changes in the balance of supply and demand. A detailed picture of the freight
market was drawn in
‘Bulk shipping freight markets and investment prospects’
,as
follows (Ocean Shipping Consultants Ltd. 2000. pp.99-101):
1. In the early 1980s the freight market was at very low levels. Severe over-tonnag
had been a feature of the dry bulk sector since around 1981, with massive
newbuilding deliveries swamping limited growth in demand.
2. Between late 1987 and early 1990 the freight market evidenced a period of rapid
peak of over 1500 in late 1989/early 1990. This increase was funded by a steady
expansion in demand, with only limited fleet capacity increases.
3. This increase in earnings resulted in a rapid increase in ordering of new vessels
to meet expanding demand. The early 1990s were charaterised by a period of
severe recession in the OECD – especially in Europe and North America. The
net effect was a stagnation in demand growth, this coinciding with the delivery
of significant volumes of new vessels onto the market.
Figure 2.3 The Baltic freight index (BFI 1986 – 2000)
Source
:
Ocean Shipping Consultants Ltd. (2000)
4. The market strengthened notably over 1994/95. Although the order book had
remained at fairly high levels over the early 1990s - with owners seeking to
modernize their fleets against a background of relatively strong demand growth –
5. Once again, this surge in the market was immediately reflected in a rapid
increase in vessel ordering. The total capacity of bulk vessels on order peaked in
mid-1995 at over 35.1m dwt. This over-exuberance immediately placed great
supply-side pressure on the freight market. The BFI fell to around 1000 in the
early part of 1996.
6. Subsequent developments have been extremely complex. The balance of the
market was upset by both the continued high level of order book activity and –
much more importantly – demand side uncertainties. The Asian economic crisis
adversely affected anticipated demand growth, with total tonne-mileages
showing very little growth between late 1997 and early 1999. The net effect was
a weakening in the supply / demand balance and a further collapse in freight
rates.
7. More recently, since mid-1999, the market has begun to firm once again. Orders
are now at lower levels and the stabilization of the world economy – with
renewed growth in Asian economies – is once again improving the supply /
demand balance and more importantly, renewed confidence is being noted in the
market.
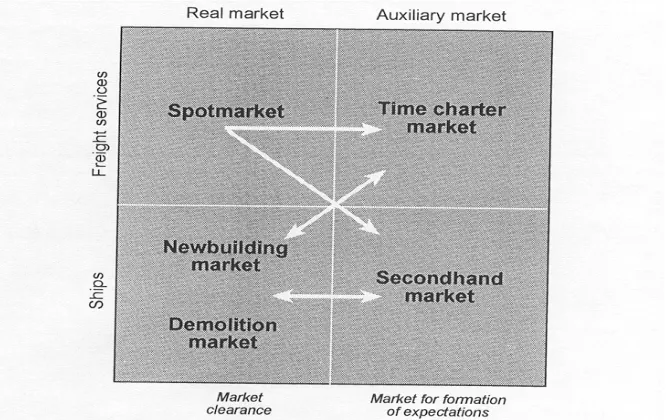
Another distinction of the markets is to divide the shipping market by their roles. As
mentioned in ‘
Shipping
’ (Wijnolst & Wergeland, 1997, p.292), shipping markets can be
segmented into the real market, where supply can balance demand, such as the spot
market and newbuilding/demolition market, and the auxiliary market, which deal with
expectations about the future such as the time charter market and the second hand
market. The spot market has the function of clearing the market in the short run, while
the classification of shipping market. The main focus of this dissertation is the spot and
the time charter markets in dry bulk shipping.
Figure 2.4 A classification of shipping market
Source:
Shipping,
Wijnolst and Wergeland (1997)
2.4 Dry bulk market characteristics
2.4.1. Cyclical market
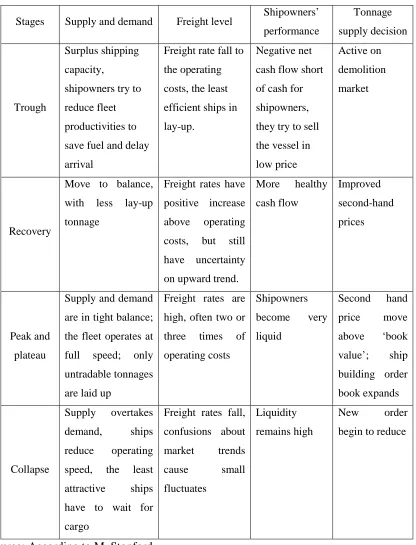
Noticed by most market players, the bulk shipping market follows a cyclical pattern.
There were twelve dry freight cycles during the period 1896-1995, which shows
dramatic ups and downs of the freight market. Although each full completion cycle
has different features with others such as the duration of the cycle, fluctuation
between the highest point and lowest point, length of different steps, most cycles
experience 4 steps: trough, recovery, peak and collapse. Each stage shows
approximately the same characteristics. The characteristics of different stages can be
Table 2.6 Characteristics of market cycles
Stages Supply and demand Freight level Shipowners’ performance Tonnage supply decision Trough Surplus shipping capacity,
shipowners try to reduce fleet productivities to save fuel and delay arrival
Freight rate fall to the operating costs, the least efficient ships in lay-up.
Negative net cash flow short of cash for shipowners, they try to sell the vessel in low price
Active on demolition market
Recovery
Move to balance, with less lay-up tonnage
Freight rates have positive increase above operating costs, but still have uncertainty on upward trend.
More healthy cash flow Improved second-hand prices Peak and plateau
Supply and demand are in tight balance; the fleet operates at full speed; only untradable tonnages are laid up
Freight rates are high, often two or three times of operating costs Shipowners become very liquid Second hand price move above ‘book value’; ship building order book expands Collapse Supply overtakes demand, ships reduce operating speed, the least attractive ships have to wait for cargo
Freight rates fall, confusions about market trends cause small fluctuates Liquidity remains high New order begin to reduce
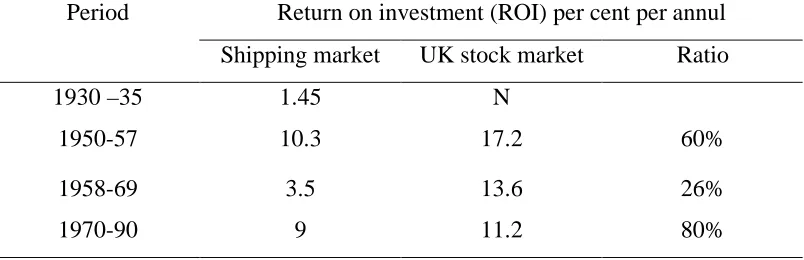
2.4.2. Market of high risks and low return
No one in this market always makes money. Some of them never even make any
profit at all. Money earned in the market peak is eaten up by poor years, which is
often the case. Only a few owners or speculators with ‘special sense’ can earn a good
fortune. Return on capital in dry cargo shipping is lower than other investment
opportunities in the long-run. Freight market earning can seldom meet the
requirements of newbuilding projects in the recently decades. Shipowners have to
use the profit earned from their older and cheaper vessels to feed their new fleets.
Table 2.7 shows the comparison of the ROI of shipping industry and UK stock
market. The annul ROI of shipping is always lower than stock investment.
Table 2.7 Return on capital
Period
Return on investment (ROI) per cent per annul
Shipping market
UK stock market
Ratio
1930 –35
1.45
N
1950-57 10.3 17.2 60%
1958-69 3.5 13.6 26%
1970-90 9 11.2 80%
Source: Stopford
2.4.3. Perfectly competitive market
The dry bulk freight market is the place where dry bulk transportation demand meets
supply. This market can be regarded as one of perfect competition as most specific
of the assumptions of perfect competition are met:
•
As there are a large number of relatively small firms, both shipowners and
•
Identical service: dry bulk transportation services provided by each shipowner
are homogeneous, only freight rate matters.
•
Freedom of entry and exit of firms: thanks to a well-developed newbuilding
market and second-hand ship market firms can enter/exit the dry bulk market
easily.
•
Perfect information or knowledge: the worldwide broker network enables market
information to flow quickly to every player in the market.
There are no ‘giants’ who can influence the dry bulk freight rates, market trends are
always reflecting the balance of demand and supply.
2.5 The spot market
To operate in the spot market is the most traditional way of trading in the dry bulk
shipping. A deep-sea tramp ship in the spot market is prepared to carry any cargo
between any port at any time and the most important thing is that it must always be
prepared to accept the ‘market price’.
2.5.1 Freight rate determination in the spot market
A freight rate is purely decided by how supply and demand meets in the spot market.
Normally shipowners will calculate a freight rate when they receive a cargo offer
according to their costs. This freight rate will always cover their capital cost,
operational cost, voyage cost plus a certain level of profit. However, more often than
not, ships are not fixed at the rate
When a cargo offer comes out, many shipowners are invited to quote. If there is
the freedom to choose the lowest rate, or they can take advantage of the market
information system (brokers’ network) to release sensitive information (such as
freight rate level of other shipowners or charterers’ idea to fix) to shipowners in
order to make a good bargain on the freight. On the other hand, if there are more
cargoes on the market than vessels trading, shipowners have the upper hand and way
to enjoy a higher freight rate. At certain times and regions the supply and demand
are temporarily constant. In such situations, freight rates will also be constant, and
any players (both cargo owners and shipowners) not accepting this price will be
without contract. They have to keep an eye on the market ‘last done’, which will
provide a useful reference for the present negotiations.
As mentioned above, supply and demand at a certain time and region is relatively
fixed, but they are still elastic sometimes when the market goes to an extreme level
(such as too high or too low). Shipowners and /or cargo owners may do something to
adjust their productivity of supply/demand to some extent according to the freight
level. Shipowners may ballast their vessels to near regional markets where the
freight level is relatively high; they may change the speed of vessels in order to save
fuel oil consumption in a low market or to increase productivities of fleet in high
market; they may decide to lay-up or dry dock vessels if the freight level is lower
than various costs; of course, order newbuildings or scrap old tonnage more directly
change the supply, but newbuilding projects will normally have 2-years time lag for
ships to enter into the freight market. Cargo owners may choose to postpone
transportation of a cargo if the market is too high; or they can try to find a substitute
supplier with a shorter distance, who can reduce the freight cost; or not so often they
can change the size of cargo in order to achieve economies of scale. Effects of cargo
owners are relatively small, but any changes of these (both supply and demand) may
2.5.2. Reasons for spot market trading
Normally, owners trade on the spot market for the following reasons:
a. Preference: in fact, a lot of shipowners do not see too many differences between
the spot market and the time charter market. Their decision to trade on the spot
market is based purely on their preferences such as enjoying the flexibility of the
trading pattern or having more control on ship operations.
b. Asset play: Shipowners put more emphasis on the value of ships. They want to
keep ‘free ships’ in hand for possible marginal selling. Any binding time charter
contracts will make them loose opportunities.
c. Strategy planning: considerable shipowners who see there are potential profits by
shifting ships between spot market and time charter market. Operations in both
markets are temporary.
There are both advantages and disadvantages for charterers and shipowners who trade
on the spot market. According to a study in ‘Freight Future’, the advantages and
disadvantages are as follows (Veldhuizen, 1988, p.6):
The advantages of voyage charter
Owners: advantages
•
Secure employment for a single voyage up to six months forward
•
Ability to benefit from temporary or sudden rises in freight rates
•
Flexibility in selecting a specific voyage in order to position for a future fixture
•
Not tied long term to a single charterer who may be in financial difficulties
Disadvantages
•
No long-term guaranteed income posing the possibility of problems with
cash-flow and debt servicing requirements
•
High degree of constant commercial management and decision-making needed,
high brokerage and communication costs
•
When forward voyage charter has been fixed, inflexibility with respect to other
chartering out opportunities
•
Compared to other forms of chartering a high degree of commercial operational
risk, e.g. strikes, delays, adverse weather, bunker price developments, war risk,
etc.
Charterers: advantages
•
Immediate fixing of any tonnage requirement up to about six months forward can
be achieved.
•
Flexibility in matching tonnage with the actual cargoes
•
Limited exposure to traditional shipping risks, including fuel costs
•
Opportunity to make an extra profit by fixing at market troughs when agreed CIF
price is actually higher.
Disadvantages
•
Exposure to upturns in the market and positioning problems
•
Necessity of dealing with a great variety of owners who may not all be efficient
or reliable, constant monitoring required.
2.6 The time charter market
A time charter is a contract where a shipowner puts the ship at the disposal of a charterer
for a certain time period. Shipowners will get a fixed payment from the charterer during
the charter party period.
Normally time charters can be divided into 3 groups, short–term time charters with a
period of under 12 months; medium-term charters with a period of 12-24 months and
long-term time charters with duration of more than 24 months.
2.6.1. Determination of time charter rates
The determination of time charter rates is a function of how expectations are formed in
the market. From a theoretical point of view, expectations can vary from the very
myopic, where only the current situation matters for assessing the future to the extreme
of perfect foresight, where the future is known. In shipping, neither of those extremes
can be found. In an empirical study where the aim was to test what kind of expectations
one could find in bulk time charter markets, the conclusion was that semi-rational
expectations seems to best be able to explain the formation of prices in bulk time charter
markets (Wijnolst and Wergeland, 1997)
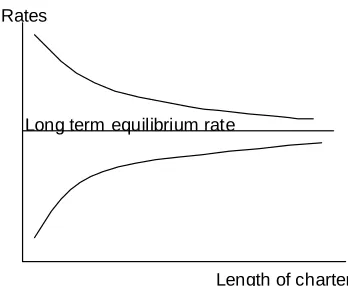
Semi-rational expectations imply that all players have a notion of the freight rate level
towards which the long-term market equilibrium should move. This implies that if the
spot rate is far below this expected long-term equilibrium, all agents will expect the
market to start to rise. Conversely, if the spot rate is very high today, well above the
expected long-term equilibrium, the players will expect freight rates to start falling. The
implication of this is that the pricing of time charter contracts will depend both on the
difference between spot rates and the long-term equilibrium rate and the length of the
Rates
Length of charter Long term equilibrium rate
Figure 2.5 The term structure of prices in time charter markets
Source: Wijnolst and Wergeland, 1997
In the longer run it is reasonable to assume that prices will move towards a freight rate
level where investors can get a return for investing in a new ship. This may be a level,
which is not obtained for more than very short periods of time, but still it is an indication
of where the freight rate levels should move towards. By calculating the break-even
rates for newbuildings, agents in the market will have a notion of where the longer term
freight levels may be. The break even rates can then be used as a proxy for the long term
equilibrium rate. If the current spot rate is higher than this equilibrium rate, short time
charter contracts will tend to be priced higher than long term contracts, and if the spot
rate is lower than the long term equilibrium rate, long term charter contracts tend to be
priced higher than the short term contracts. This is normally referred to as the term
structure of prices.
If the spot rate is very much lower than the equilibrium rate, it is an indication of a very
high supply surplus in the market, and longer term contracts will hardly be signed at all,
partly because the charterers have little incentive to fix ships for a long term, partly
2.6.2. Reasons for trading in the time charter market
There are many reasons for a shipper to offer a time charter contract:
1. The shipper may not wish to be a ship owner, but the business requires the use of a
ship under his control. This happens very often as industrial shipping.
2. The time charter may work out cheaper than buying, especially when owners have
lower costs, due to lower overheads and larger fleet.
3. Charterers may be speculators taking a position in anticipation of a change in the
market.
From a shipowners’ point of view, a time charter contract must be in line with his own
market expectation during the time charter period.
The advantages and disadvantages of time charter contracts concluded in ‘
Freight
Future’
(Veldhuizen, 1988, p7) are as follows:
Owners: advantages
•
Guaranteed earnings and, likewise, regular cash-flow for a relative long (up to
two years) period.
•
A quality time charter may still be used as a security against a loan – especially
for the purchase of secondhand tonnage
•
As with trip charters, many risks are transferred to the charterers
Disadvantages
•
Inflexibility of the vessel’s earning potential: once committed it is tied-in with
the agreed hire.
•
Quality of the prospective charterer, especially when dealing with an operator,
must be carefully examined: the quality of the charter is only as good as that of
the charterer.
Charterer: advantage
•
Guaranteed tonnage available at a known price over a known period: easy to
budget.
•
Little exposure to spot market fluctuations
•
Surplus tonnage can be relet
•
In a rising market there is a comparative advantage over spot tonnage
Disadvantages
•
Greater burden of risk which now also includes positioning of the vessel
•
These charters are difficult to obtain in a rising market and likewise there is a
comparative disadvantage compared to the spot market when the market drops
•
No flexibility in available tonnage-matching consignments, especially if these
are normally sold on a spot basis
•
If agreed at a very low rate, the owner may run into financial difficulties and
become unreliable, default on a loan, etc
2.7 Relations between the spot market and the time charter market
2.7.1 Time charter activities vs. spot rates
Operating in the dry bulk freight market, shipowners have the freedom to shift between
the spot market and time charter market. It depends on either the availability of a time
charter contract or the willingness of shipowners to have a time charter contract. The
last consideration depends on the shipowners’ expectation of future freight levels for the
purpose of pursuing maximum revenue. Figures 2.6 to 2.9 show the relations between
time charter activities and spot freight levels for the past decade. The number of time
charter activities was given by different lengths of charter periods, namely 0-6 months,
6-12 months, 12-24 months and over 24 months. BFI is used as an indication of the spot
market level.
From these figures, some points can be read:
1. The numbers of activities of short and medium term time charter generally
follow the same development trends as the BFI. When BFI reached its highest
peak in 1995, all 0-6 month, 6-12 month and 12-24 month groups reached their
highest numbers. When the market was low, numbers of these time charter
contracts were also less. Shipowners’ decisions on whether to enter into the time
charter contract are largely affected by the current spot freight level. This is
mainly because shipowners want to keep the higher freight longer by signing
time charter contracts when market is high, and try to avoid have low freight rate
longer by signing time charter when market is low.
Numbers of long-term time charter contracts obviously are very much less
related to the spot freight level. As mentioned above the long-term time charter
Another reason for looser relations between long-term time charter activities and
the spot rate is that a lot of fixtures are done under market by industry shipping
without being reported.
2. The number of time charter contracts decreases as the time-charter period
increases. A 0-6 month time charter contract has the highest number of 58 in the
peak month with an average of 24 per month for the last 10 years, 36 contracts
for 6-12 month in the peak month with an average of 9 contracts per month, 15
contracts for the 12-24 month time charter in the peak month with an average of
3 contracts per month, and 6 contracts for 24 and above month time charter in the
peak month with an average of less than one contract per month. The main
reason for this phenomenon is that both charterers and shipowners are more
cautious to sign long-term time charter contract as higher risks is involved due to
the longer time charter period.
3. Figures of short and medium-term time charter show that numbers of time
charter contracts changed greatly within one year. The biggest changes for 0-6
months t/c contracts is 42 in 1995, for 6-12 months t/c contracts is 34 in 1997,
for 12-24 months t/c contracts is 14 in 1995. During other years in the research
period, ranges of changes are also significant, even if the BFI only changed a
little. This indicates that shipowners always adjust their strategy according to the
spot freight rate. Bigger changes of short-term time charters show flexibility of
this kind of contract and a willingness of shipowners to use short-term time
0-6 months t/c numbers vs. BFI
0 500 1000 1500 2000 2500
Jan-90 Jan-91 Jan-92 Jan-93 Jan-94 Jan-95 Jan-96 Jan-97 Jan-98 Jan-99 Jan-00 Jan-01
BF
I (
1985=
1000)
0 10 20 30 40 50 60 70
t/c
numbe
r
BFI
t/c numbers
6-12 months t/c numbers vs. BFI
0 500 1000 1500 2000 2500
Jan-90 Jan-91 Jan-92 Jan-93 Jan-94 Jan-95 Jan-96 Jan-97 Jan-98 Jan-99 Jan-00 Jan-01
BF
I (
1985 =
1000)
0 5 10 15 20 25 30 35 40
BFI
6-12 months
12-24 months t/c numbers vs. BFI
0 500 1000 1500 2000 2500
Jan-90 Jan-91 Jan-92 Jan-93 Jan-94 Jan-95 Jan-96 Jan-97 Jan-98 Jan-99 Jan-00 Jan-01
BF
I (
1985=
1000)
0 2 4 6 8 10 12 14 16
BFI
12-24 months
24+ months t/c numbers vs. BFI
0 500 1000 1500 2000 2500
Jan-90 Jan-91 Jan-92 Jan-93 Jan-94 Jan-95 Jan-96 Jan-97 Jan-98 Jan-99 Jan-00 Jan-01
BF
I (1985=1000)
0 1 2 3 4 5 6 7
BFI 24+
2.7.2. Time charter rates vs. spot rates
Although time charter rates share the same trend with spot rates, time charter rates have
less fluctuation. This can be seen from figure 2.9 . That is mainly because time charter
rates are based on spot rates and market expectation. When the spot market is high, some
shipowners will forecast that freight may go down in the future. These shipowners
would like to accept a time charter rate, which is lower than the current market but still
higher than future expectation. Of course, some charterers would also like to fix at a rate
below the high market rate. When the market is low, expectation of future rates will be
high. Shipowners will deploy ships on the spot market until the market goes up. To fix
some time charter contracts in a low market, charterers have to offer hire rates higher
(even a little) than spot rates to attract shipowners. So in most cases time charter rate
fluctuations are always within spot rate changes. Figure 2.10 shows the correlation
between spot rates and time charter rates.
spot rate index vs. time charter rate index
0 50 100 150 200 250 300 350 400
J
an-90 Jan-91 Jan-92 Jan-93 Jan-94 Jan-95 Jan-96 Jan-97 Jan-98 Jan-99 Jan-00 Jan-01
LSE tramp trip charter index combined index 1985=100 time charter index over 6 months 1972=100
Figure 2.10 relations between spot rates and time charter rates
2.8
Challenges to shipowners
A fast changing and cyclical market raises the question of the possibility of making
money by using the fixed chartering rules.
A steady growth in world trade results in a reliance on international transportation to
complete the physical delivery of large volumes of cargo. A well-developed world dry
bulk fleet is looking for more profitable operations. Perfect competition in the dry
freight market combined with fluctuation demand make market forecasting almost
impossible. Both parties are looking for possible methods to hedge risks and make
profits.
As mentioned in the previous section, time charter is a way to deal with market
expectation. Shipowners can use the time charter contract to secure a certain level of
revenue when markets surge. Because the time charter market is a semi-rational market,
the players will have some ideas about what the market is going to be in the future.
When to enter a time charter contract, what is a reasonable hire rate, how long should
the time period be are all functions of these expectations. The topic of this dissertation is
to test some fixed rules for chartering policy and to see if, by following these rules,
shipowners can make more money than using a pure spot or pure time charter chartering
CHAPTER III
POTENTIAL CHARTERING RULES
3.1 Dry bulk market behavior
As mentioned in the previous chapter, the dry bulk market is a perfectly competitive market. Market levels change overnight following the balance of supply and demand. Both shipowners and charterers try to update their expectations and do every effort they can to change or maintain their positions in the market. It is also very hard to forecast. Many attempts of predicting the freight rates have not been very successful. Shipowners may put their emphasis on how to improve their profits by choosing suitable ways to deploy their tonnage. The time charter market, as an auxiliary market, can provide opportunities to shipowners to reach this goal.
3.1.1. Analysis of freight market
Shipowners should know their position in a specific market situation before they make any decisions to deploy their vessels. By studying the developing trend of the spot market for the recent 10 years, some hints can be found:
compensation for the loss of opportunity so as to earn more from the coming high market. Therefore, shipowners should enter into a time charter contract within a certain range. This range should either be not too high or too low. Because when the market is high, spot rate will be higher than time charter rate, it is better to enjoy higher the spot market than time charter contract. On the contrary, if the market is too low, lower than the fixed cost of the ship, there is no point for the shipowners to have a time charter contract to maintain this rate for a longer period. Shipowners need a parameter to help them define the range.
2. The same level of freight rate may imply vastly different chartering profits. Figure 3.1 shows that to enter a time charter at point A, the time charter rate will help shipowners to stay above the low spot market and keep their revenue above the market level. On the other hand, if owners sign a time charter contract at point B, although it is at the same level as point A, the ship owner will lose the opportunities to earn a higher freight rate from the coming spot market boom.
TIME
Figure 3.1 Entry points of time charter contract
BFI
0 200 400 600 800 1000 1200 1400 1600 1800 2000 2200 2400
1990 1991 1992 1993 1994 1995 1996 1997 1998 1999 2000 2001
Figure 3.2 Baltic Dry Index 1990-2001
Source: Lloyds shipping economics (1990-2001) B
A
C ?
? F
3.1.2 Strategic decisions for shipowners
There are several options, which shipowners can choose to deploy their ships in the dry bulk market:
1. Always trade in the spot market, accepting the volatile freight rate
2. Sign long-term contracts, such as 5 years or 10 years, or even longer to avoid market fluctuations
3. Seek a perfect combination of spot trading, short and /or medium-term time charter, which can enable shipowners to get the optimum profit.
Of course the third one is the preferable one, but also the most difficult, sometimes almost impossible to implement. Shipowners may face several problems indicated as below, when they try to achieve such a combination.
First, the availability of time charter contracts. A time charter contract is signed at the point when transportation needs meet market expectations. Both charterers and shipowners have their own expectations; sometimes they are reluctant to enter into a time charter when the expectation is still too high or too low. There will be no time charter contract if they cannot match each other. This often happens when the market is extremely high or low. In practice, the availability of a time charter contract should be the first question shipowners should ask when making their strategic decisions. However, this is often out of the shipowners’ control. This problem will not be discussed in this thesis.
Third, there is difficulty to decide the acceptable entry level of the time charter contract. Although different shipowners will have different strategies on managing their cash flow, most of them still want to find an optimum level of freight, which can maximum their revenue. This level, could be between operational cost (lay up level) and required rates for newbuilding, which can bring the investment back.
3.1.3. Information needed
As mentioned above, if shipowners want to find a good way to combine spot market trading and time charter market trading in order to get optimum revenue, they have to:
1. find a right parameter, which is relatively fixed to each ship, in order to assess the market level
2. find a practical, well-recognized forecasting tool of the freight market, which can generally help shipowners understand market developments in the short run.
3.2 Market information tools
The dry bulk market works as an open market; fixture rates can be disclosed already the next day. Shipowners enjoy quick access to massive amount of information. However, such a large amount of information may not help shipowners to make the right decisions, if they misunderstand of market situation delivered by this information.
There are several categories of information available from typical market reports, which including:
• World seaborne trade
• Freight market development, report on freight rate (current rate, and historical rate)
• Investment information, newbuilding, second hand, demolition price
• Market forecast information
In this dissertation, historical data of the dry bulk market and BIFFEX are used as data to test various chatering policy strategies.
3.2.1 Historical data.
The following market data has been used:
• Spot freight rates, either physical records or various indices such as BDI;most freight rates are published for typical routes, but some ship broker companies such as R.S. Platou and Fearnleys publish compounded spot rates, which combine rates of different routes according to certain weighing considerations;
• Time charter rates, including rates for different charter periods;
• Newbuilding prices, second-hand prices.
Spot freight rates can offer the following information:
• ‘Last done’ rate: the most important reference to shipowners for their current decision.
• Recent tremendous changes in the market (the highest and lowest market level)
• Spot rates are the basic revenue, which a ship owner can get by trading in the freight market.
Time charter rates of different periods can indicate:
• 6 months time charter rates are in closer relationship with spot rates, which are purely decided by the market supply and demand mechanism. Rates often vary a lot in accordance with spot rates even for vessels in the same condition but in different delivery areas due to a short charter party period.
• 12 months time charter rates can be regarded as a good mixture of short-term and medium-short-term time charter rates. Therefore, it is a good parameter, which represents a time charter level.
• For a time charter of more than 12 months, there are often several factors other than supply and demand, which can affect the level of rates.
Newbuilding and second hand price can provide:
• The capital cost of vessels, which is determined by the purchase of a vessel and includes the interest payment. This part, often regarded as a fixed cost, is the most important part when shipowners calculate their freight rate.
plus a certain level of expected returns on investment. This rate is basically derived from newbuilding or second hand price.
3.2.2. BIFFEX. (Baltic Freight Future Exchange)
Both shipowners and charterers need a tool to protect them from volatility and irregular market fluctuations. In 1985, a financial risk management tool, BIFFEX, which aims to help both parties to hedge their market risks, was introduced. Typical routes for different types of dry bulk transportation were chosen as to representing the whole dry bulk market (See Appendix). Each route has a different weight in the index package. Based on the Baltic Freight Index (till end 1999, then BDI till now), market players (shipowners, charterers and market speculators) are allowed to buy or sell index points for future trading. Traders in the freight future market will settle the difference between the physical market and future points they bought at the end of future contract date. It is said that the future market can be seen as a ‘shadow market’ of the physical market, where
‘risk can be hedged through a freight future position exactly opposite to the
exposure on the physical market’. (Freight futures, Veldhuizen, 1989, p28). The principle of BIFFEX trading is that, a loss in the physical market can be offset by a gain in the futures market and vice-versa.
Indices are published for different trading months, namely, current month, following two consecutive months, every January, April, July, and October for up to eighteen months forwards. These indices indicate the market expectation for future freight rates.
(the 4-6 months BIFFEX has a high correlation 0.83 with BFI for the last decade). Figure 3.3 shows the correlation of 4-6 months BIFFEX and BFI.
BFI vs. BIFFEX
0 500 1000 1500 2000 2500 Nov-93 May-94 Nov-94 May-95 Nov-95 May-96 Nov-96 May-97 Nov-97 May-98 Nov-98 May-99 Nov-99 May-00 Nov-00 May-01 BFI BIFFEX
Figure 3.3 BFI and BIFFEX 1993- 2001
Source: Lloyds shipping economics and BIMCO weekly newsletter
3.3 Assessments of market performance of shipowners
3.3.1 Assessment by cash-flow
The most straightforward assessment for ship operations is revenue – the income of carrying cargoes (freight rate) or out letting tonnage (hire rate).
Revenue can be calculated by freight rate ($ per ton) multiplied by total cargo carried or by hire rate ($ per day) multiplied total days on hire. It is difficult to assess revenue levels when revenues are based on different freight units. Freight rate measured by $ per ton is supposed to cover all kinds of costs (capital costs, operational costs and voyage costs), while time charter hire rate only covers the first two cost categories and leaves voyage costs to the charterers. In order to compare revenues on the same level, the spot freight rate needs to be transferred into time charter equivalent by using a certain formula.
In this thesis, all spot rates (if not particularly mentioned) are all time charter equivalents.
3.3.2. Assessment by return of investment
charter rates, can hardly meet the required time charter rate of 10% IRR of newbuilding in every type of dry bulk fleet. Figure 3.4 shows Panamax freight levels for the last 10 years; spot earnings never met the required rates of USD17,300(Newbuilding price at USD27.5 Million) during the period.
Figure 3.4 Panamax bulkercarrier average spot earnings Source: www.Clarksons.net
3.3.3 Assessment by optimum revenue
The dry bulk market is hard to predict. Shipowners see periods of low market rates interchanging with very high rates. The ideal situation would of course be to sit through periods of falling spot rates with a high time charter rate, avoid time charter contracts when spot rates are rapidly increasing, and enjoying high spot rates when the market is booming. This is not so easy to achieve in practice.
Obviously, if the 12 months average rate is higher than the time charter rate, shipowners should trade spot. This will make the average 12-months earnings higher. Conversely, if the time charter rate is higher than a 12-month average of future spot rates, one should take the time-charter contract.
Table 3.1 Optimized revenue for Panamax vessels Spot rate
12 months average
Time charter rate
Oct.96 8550 9671 8000 Nov. 96 9000 9821 8750 Dec. 96 9450 9784 9500 Jan. 97 9900 9709 9700 Feb. 97 10125 9484 10000 Mar. 97 10800 9315 10000 Apr. 97 9900 9071 9500 May 97 9675 8884 8500 Jun. 97 9315 8640 8500 Jul. 97 9450 8408 9000 Aug. 97 9900 8145 9250 Sep. 97 9900 7830 9750
In this case, there are 6 times (Feb. 97, Mar. 97, Apr. 97, July 97, Aug. 97 and Sep. 97) that time charter rates are higher than 12 months average rate. Therefore, these 6 months can be looked upon as good times to sign a time charter contract.
Table 3.2 Optimum daily revenue for dry bulk fleet 1990-2000 (USD / day) Handysize Handymax Panamax Capesize 7,479 9,316 10,665 14,297
3.4 Potential rules
The idea developed in this thesis is that it is of interest to see if it is possible to specify a fixed chartering rule based on only historical and current facts, and to compare the result of this rule with both pure spot trading and the benchmark given above.
3.4.1. Chartering rules based on capital cost
The first concern of ship owners to decide to accept a freight rate is whether this rate can cover the cost of vessels. Normally, the total cost of vessel can be divided into three parts, capital cost (fixed cost), operational cost and voyage cost. Voyage costs are the responsibility of the shipowner only when the ship is on voyage charter basis. As all rates used in this thesis already been turned into time charter equivalents, voyage costs will not be considered here.
Operational costs are often regarded as the lowest level that a shipownerto accept a contract. It is called the ‘lay up’ level. Ship owners would like to lay up their vessels instead of trading when freight rates are lower than this.
Capital cost, the fixed cost of a vessel, is a major concern of shipowners when they quote for particular business. The capital cost can be represented by an annuity, which then can be compared to the time charter rate. A parameter ‘a’ is used to represent the proportion of capital cost in market time charter hire rate.
The relationship of “a” with possible chartering policies is as indicated:
1. When ‘a’ is under 1, which means time charter hire rate can not cover daily capital cost of vessel, it is in no point that ship owners should enter into a time charter party to keep the low rate longer. The probability that freight rates will start to rise is too high.
2. When ‘a’ is above 1, which means time charter hire rate is equal to or higher than the capital cost, time charter contracts should be considered.
3. When ‘a’ is very high, which reflect high market freight levels, trading spot may be a better idea than entering into a time charter contract as the spot rate will be higher than the time charter rate in this case.
The variations of ‘a’ is shown in the following table. Table 3.3 Variations in the parameter “a”
Handysize Handymax Panamax Capesize Range 1.80-0.79 1.73-0.74 1.78-0.66 1.71-0.61
In order to find the optimum combination of spot trading and time charter trading, which can generate better revenue, different levels of ‘a’ as entrance triggers will be tested. The test was performed using 4 values of “a”, i.e., a>1.0, a>1.2, a>1.4, a>1.6. The calculation will be based on following principles:
1. Test period: from Jan. 1990 to Dec. 2000 2. 12 months time charter rates will be used.
3. Capital costs of new building prices will be used, converted into $/day
5. Different starting points will be selected at each calculation. Spot rates will be used before the starting point (which means ship owners are trading on spot market before he finds the suitable time for entering time charter).
6. Average total revenue and monthly revenue will be calculated based on all starting points.
7. The ‘a’ range with highest average revenue will be regarded as the optimum trigger for entry .
The distributions of each category for different types of vessels are as follows:
Table 3.4 Distributions of ‘a’
a>1.6 a>1.4 a>1.2 a>1.0 Handysize 9 49 93 113
Handymax 11 29 68 102
Panamax 13 35 64 105
Capesize 6 26 48 88
Higher ‘a’ has less points in the range, which means less entrance points to time charter contract. Therefore, the results for ‘a>1.6’ will be closer to spot trading revenue. On the contrary, the results for ‘a>1.0’ will be more related to the results of trading on pure time charter market.
3.4.2. Chartering rules based on BIFFEX
If dry bulk freight market had been predictable, just as described previously, ship owners would know what will happen in the future. Then there will be little market risks towards ship owners.