Telephone: +44 (0)1582 763133 Web: http://www.rothamsted.ac.uk/
Rothamsted Research is a Company Limited by Guarantee Registered Office: as above. Registered in England No. 2393175. Registered Charity No. 802038. VAT No. 197 4201 51. Founded in 1843 by John Bennet Lawes.
Rothamsted Repository Download
A - Papers appearing in refereed journals
Lysenko, A., Hindle, M. M., Taubert, J., Saqi, M. and Rawlings, C. J.
2009. Data integration for plant genomics - exemplars from the
integration of Arabidopsis thaliana databases. Briefings in Bioinformatics.
10, pp. 676-693.
The publisher's version can be accessed at:
•
https://dx.doi.org/10.1093/bib/bbp047
The output can be accessed at:
https://repository.rothamsted.ac.uk/item/8q412/data-
integration-for-plant-genomics-exemplars-from-the-integration-of-arabidopsis-thaliana-databases
.
© Please contact [email protected] for copyright queries.
Data integration for plant genomicsç
exemplars from the integration of
Arabidopsis thaliana
databases
Atem Lysenko, Matthew Morritt Hindle, JanTaubert, Mansoor Saqi and Christopher John Rawlings
Submitted: 1st June 2009; Received (in revised form) : 15th September 2009
Abstract
The development of a systems based approach to problems in plant sciences requires integration of existing informa-tion resources. However, the available informainforma-tion is currently often incomplete and dispersed across many sources and the syntactic and semantic heterogeneity of the data is a challenge for integration. In this article, we discuss strategies for data integration and we use a graph based integration method (Ondex) to illustrate some of these challenges with reference to two example problems concerning integration of (i) metabolic pathway and (ii) protein interaction data forArabidopsis thaliana.We quantify the degree of overlap for three commonly used pathway and protein interaction information sources. For pathways, we find that the AraCyc database contains the widest cover-age of enzyme reactions and for protein interactions we find that the IntAct database provides the largest unique contribution to the integrated dataset. For both examples, however, we observe a relatively small amount of data common to all three sources. Analysis and visual exploration of the integrated networks was used to identify a number of practical issues relating to the interpretation of these datasets. We demonstrate the utility of these approaches to the analysis of groups of coexpressed genes from an individual microarray experiment, in the context of pathway information and for the combination of coexpression data with an integrated protein interaction network.
Keywords:database comparison; data integration; graph based analysis; metabolic networks; Ondex; plant genomics; protein interaction networks; systems biology
INTRODUCTION
High-throughput experimental techniques are now generating large quantities of data relevant to studies of plant and crop genomes. Although much of these data are being captured in publically available data-bases and distributed using recognised data exchange standards, investigators often need to access multiple data sources to find all the information they need to
complete a data analysis task. This challenge is shared by many life scientists, but the problem is more serious for plant scientists because data resources are generally more dispersed than is the case in the biomedical science community where significant investment has taken place to create linked data col-lections such as those which can be accessed at the National Center for Biotechnology Information
Artem Lysenkois a pre-doctoral researcher with previous industry experience in data integration. His research interests are qualitative modelling of regulatory networks and development of integrative analysis methods for plant systems biology.
Matthew Hindle has a background in data integration and visualisation in industry and is currently a pre-doctoral researcher developing Ondex to enrich plant microarray data with integrated pathway resources.
JanTaubertis a senior bioinformatician with research interests in data integration and machine learning for systems biology. He is the chief software engineer for the Ondex system.
Mansoor Saqi is a Principal Investigator in the Biomathematics and Bioinformatics Department at Rothamsted Research and has worked in bioinformatics in both industry and academia.
Chris Rawlings is head of the Biomathematics and Bioinformatics Department at Rothamsted Research. He has worked in bioinformatics for over 20 years in both industry and academia.
These authors contributed equally to this work.
Corresponding author. C.J. Rawlings, Centre for Mathematical and Computational Biology, Rothamsted Research, Harpenden AL5 2JQ, UK. E-mail: [email protected]
ßThe Author 2009. Published by Oxford University Press. For Permissions, please email: [email protected]
(http://www.ncbi.nlm.nih.gov) [1] or the European Bioinformatics Institute (http://www.ebi.ac.uk). The relative scarcity of completed plant and crop genome sequences and associated data also drives the need to exploit comparative genomic datasets from disparate sources and potentially from organ-isms that are relatively distant in evolutionary terms. While it might be expected that plant genomes at the sequence level would be interlinked because of shared genome annotation resources (e.g. through prediction of gene function by sequence orthology with Arabidopsis thaliana), once the information needed moves away from sequence information to biochemical function, the methods for linking equivalent features become more challenging.
In this article we use case studies from ongoing projects to demonstrate some of the benefits of using data integration techniques in the analysis of plant genomics data and to explore some practical difficul-ties that are encountered when developing inte-grated plant data resources. All of our examples come from Arabidopsis thaliana datasets because the scale and range of genomics and higher-order func-tional information resources are greater than for any other plant species. We can therefore explore a wider range of issues than in other plant species. We have used the data integration platform Ondex (http:// www.ondex.org) to present our case studies because we are most familiar with this software, and because its development has been largely motivated by problems from plant genomics. The problems we wish to address, however, will be generic to other data integration approaches, which we will introduce briefly before presenting the case studies.
Data integration
The development of general solutions to the prob-lem of data integration remains a significant unsolved problem in bioinformatics [2]. To be successful, it is necessary to find technical solutions to two different problems found in biological data sources: syntactic heterogeneity and semantic heterogeneity.
Syntactic heterogeneityarises because data are distrib-uted in a wide variety of file formats. Generally, the format used by a database site is determined by the type of information held in the database and the needs of the primary users of that data. In recent years, the emergence of international stan-dards has gone some way towards controlling the plethora of data formats — for example in the areas of primary sequence information, quantitative
transcriptome datasets, proteome and protein inter-action data. Most new data standards make use of the eXtensible Markup Language (XML) to create well-structured data that is easy to verify and process by software developers. Good examples of such stan-dards have come from the Proteomics Stanstan-dards Initiative (PSI) [3] and include the PSI-MI XML standard for reporting protein interactions data that is used in the second case study described in this article.
Initiatives are also underway to develop interna-tional standards for the way that data are captured in databases that will do much to control the diversity in data in the future and the most important of these is the Minimum Information for Biological and Biomedical Investigations (MIBBI) [4]. MIBBI is a community approach to developing standards for use at the point when data are collected and for reaching agreement on how much detail in the information describing the experiment (the meta-data) is needed, so that the data can be interpreted correctly with a controlled vocabulary that can be used to describe it. The MIBBI website [5] lists 30 different projects and many will be relevant to geno-mics data for plant sciences. The most well-known standards are MIAME and MIAPE for defining the minimal information about a microarray and proteo-mics experiment (respectively) but others exist for metabolomics (CIMR), genetic linkage and associa-tion studies (MIQAS) and interacassocia-tion experiments (MIMIx).
Nevertheless, there remains a large diversity of data formats in use within the life science community (even for the same types of information) and the ability to process data accurately from a range of file formats is a technical problem that all users of data have to address.
Semantic integration deals with differences in the way that things are named and structured in biolog-ical databases. This becomes problematic when there is a need to integrate data from different organisms, where it is common for separate naming conventions to have evolved. The development that has been most important in tackling this issue is the open biomedical ontologies (OBO) movement (http:// www.obofoundry.org) whose aim is to create a suite of reference ontologies for the biomedical domains (including plant science) to improve the interoperability of datasets. Ontologies that have relevance to plant science go beyond gene func-tion; into plant morphology, anatomy, plant traits
and phenotype. These have been developed by the Plant Ontology Consortium (http://www.planton tology.org) [6] and are available from the Gramene website (http://www.gramene.org/plant_ontology). The problems of different nomenclature are well known in biology, but it is illustrative to consider an example of the flowering parts of a plant. The term ‘inflorescence’ has 16 different synonyms in the Plant Ontology (http://www.plantontology.org, PO:0009049) and many different terms defining the sub-parts and more specialist names in different species. In a database (or research article) a gene function might be described with reference to any of these terms and so an ontology is essential for relating specific terms back to general concepts. Different names given to similar biological entities and concepts (synonymy) is one of the sources of the semantic heterogeneity that makes biological data integration difficult. Homonymy is another; for example the term ‘ear’ is used to describe very different structures in wheat and mammals.
Ontologies, do not however, solve all of the problems in data integration. Many challenges arise where reference ontologies, which are constructed manually, are not complete, or where a resource does not provide a cross reference to an ontology term. There are also problems with the use of ontol-ogies themselves as reviewed in Rubin et al.[7].
Approaches to data integration
Different approaches have been developed to tackle both syntactic and semantic aspects of data integra-tion. These can be broadly classified as:
Link integration and hypertext navigation, using cross references or indexing schemes between sources to navigate through data presented in a common interface (SRS [8], Entrez [9]).
Vieworschema integration, including data warehouses, where a consensus schema is designed and an integrated view over diverse data sources is built and populated with data (e.g. String [10], Biomart [11]). In the case of the Biozon [12], PathSys [13], BNþþ [14] and the Ondex systems [15, 16] the core schema has been built around the need to efficiently represent biological network and pathway data.
Workflow or federated integration, where data is gathered on-demand from data access services on the Internet (web services) or from local data-bases and data adapters, which are used to match
data together (Taverna [17], BioMoby [18], Pipeline Pilot from Accelrys [19]). Database feder-ation using mediators to access multiple databases dynamically such as Kleisli [20] and DiscoveryLink [21] could also be included in this class.
Mashups, which use Internet sources to overlay information from multiple providers using agreed access points to present a single overview (e.g. the use of DAS [22] to supply annotation tracks in the Ensembl genome browser interface). Mashups are more properly considered as providing aggre-gation of information rather than integration but are emerging alongside methods for workflow integration as mechanisms for exploiting Semantic Web technologies [23] and the increasing amount of data now available using the Resource Description Framework (RDF) [24] (http:// www.bio2rdf.org).
Data integration using graph based
methods
It is a generally accepted view in computer science that graphs and networks provide an intuitive repre-sentation for information [25]. Network representa-tions capture data objects or concepts as nodes (vertices) and the relationships between them as edges. For example a metabolic pathway can be represented by a set of nodes identifying the meta-bolites linked by edges representing enzyme reac-tions. A number of data integration systems for life science information recognise the importance of graph representations and the intuitive way that they can be used to capture and combine pathways, ontologies, gene and protein interaction and other data. These system include Biozon [12], PathSys [13], BNþþ[14] and the Ondex system [15, 16].
It is not possible within the scope of this article to compare data integration in all of these platforms. Our aim is to concentrate on some general and prac-tical issues that affect data integration for plant geno-mics and we therefore concentrate on the Ondex system as a working example of a data integration platform that addresses issues of both syntactic and semantic data integration.
Data integration in Ondex
Data integration in Ondex consists of the following three steps [26]:
(1) Parsing: Information from the source databases is parsed into a graph-based representation.
The nodes in the graph correspond to concep-tually distinct entities and the edges are created when it is necessary to represent the relationships between these entities. Both nodes and edges have a type and can have attributes that hold additional information. For example an entry from a database describing a particular protein can be represented as a node that has its acces-sions and sequence as attributes. It may then be connected to another protein by an edge indicating that there is an interaction between them and a confidence value for that interaction stored as an attribute on the edge. A wide variety of data formats can be parsed by Ondex and a list of the databases and data exchange formats for which parsers are available can be found on the Ondex web site at http://www.ondex.org/ formats.html.
(2) Mapping and data alignment: The semantic integra-tion process in Ondex is driven by mapping methods. These are analysis methods that find relationships between data entities and create edges that represent them in the graph. For example, an equivalence edge can be created between two entries if they have the same data-base accession or name. Synonym mapping generalises name-based mapping and is based on the use of shared synonym sets to create equivalence relationships [27]. Sequence similar-ity (e.g. using the BLAST algorithm [28]) and other methods can also be used to create edges in the graph to capture relationships inferred from sequence information.
(3) Visualisation and interactive analysis: Integrated net-works produced using Ondex can be visualised in the Ondex Visualisation Tool Kit (OVTK). This software provides a number of data reduc-tion methods, annotators and statistical analysis methods that can be used to effectively mine the integrated dataset for information relevant to particular application cases.
Combining different types of data from multiple sources helps provide a biological context in which to interpret experimental data from gene expression, metabolite concentrations and protein interactions. Integrative approaches to the construction of evi-dence networks [29] can also improve the reliability of functional network prediction [30] and enhance our understanding of how gene networks influence biological responses.
However, given that there are multiple data sources for the same classes of biological information (e.g. pathways) an important first step in developing an integrated data resource is to capture and integrate similar data from all relevant sources. In the follow-ing two case studies we illustrate some of the chal-lenges inherent to data integration. In the first case study we create an integrated database of biochem-ical pathways. We assess the degree of overlap between data sources containing pathway and pro-tein interaction information for Arabidopsis and explore the pathway annotation for a microarray probe set using the combined and component data resources. In the second case study we present the construction of an integrated dataset from three protein–protein interaction data sources and then explore the resulting integrated dataset for evidence of coexpression within protein interaction networks by linking to coexpression information from Arabidopsis[31, 32].
CASE STUDY 1çTHE
INTEGRATION OF BIOCHEMICAL
PATHWAY DATA
Pathways provide a level of representation that relates molecular function with biochemical and physiological function. Here we consider the set of Arabidopsis pathways in the KEGG database, the AraCyc database (a resource specific to Arabidopsis), and Arabidopsis entries in the Reactome database. Table 1 provides an overview of the relevant way content in these databases. Most of the path-ways in KEGG contain metabolic information with some describing other biological processes such as circadian rhythm and signal transduction. AraCyc is a metabolic pathway database that is part of the
Table 1: An overview ofArabidopsispathway entries in Aracyc, KEGG and Reactome databases as they have been captured in the Ondex system.
AraCyc KEGG Reactome
Enzymatic proteins and complexes 3630 1367 1481 Enzymes as a proportion of proteins
inArabidopsis thaliana(TAIR 8) (%)
10.82 4.08 4.42
Pathways with reactions 347 113 320
Those pathways that only exist at the higher levels of the abstraction in the pathway databases and contain only references to other pathways have been excluded from the statistics. For this reason, these figures cannot be compared directly with the summary information provided in the original release notes for the source databases.
BioCyc family of pathway databases [33]. AraCyc contains 347 pathways (with 87% of them experi-mentally confirmed [34]). Reactome is a curated knowledge base of biological pathways initially established with a focus on human biology [35] but which has been extended to include pathway infor-mation for a number of organisms [36]. For Arabidopsis the pathway annotation is predicted by finding sequence orthologues using OrthoMCL [37, 38] from the curated human data set. Another Arabidopsis specific pathway database is Arabidopsis Reactome [39] which uses the Reactome software framework to present manually curated pathway information for the model plant Arabidopsis. This resource was not included in the comparison because at the time of writing the database was based on an integration of KEGG release 38 (April 2006) and AraCyc v3.5 (February 2007), and so could not be used in a fair and meaningful comparison with the current database releases used here (Table 2).
Comparing the content of pathway
data sources
There is no easy way to compare the contents of these three pathway resources and it is likely that many users would pick the most familiar and use it without considering whether they have chosen the best for their particular analysis. With the three pathway resources transformed into a common data representation in the Ondex system, it becomes possible to compare the pathway coverage from the different databases at the level of proteins and enzyme categories defined by Enzyme Commission
(EC) numbers. EC numbers classify enzyme reac-tions based on four levels of a hierarchy. The roots of the hierarchy are six broad enzyme classes, each subdivided into subclasses, and sub-subclasses. The fourth digit of an EC term is the serial number of the enzyme, the specificity and nature of which is set out in the guidelines of the EC [40, 41]. The Enzyme [42], UniProt [43] and TAIR databases [44] were also integrated to provide additional refer-ence information such as protein sequrefer-ence and EC classification and a dictionary of identifiers to improve the quality of the integration
Not all reactions in pathway databases have the full four digit EC assignment. It could be that the full details of the reaction have not been confirmed or because curators have yet to assign the appropriate term. Figure 1 compares the relative abundance of reaction classification at all four levels of the EC hierarchy in each pathway database.
Figure 1 shows that four digit EC terms predom-inate in all databases and are therefore indicative of the coverage of the known pathways within each database. It is also apparent that KEGG and Reac-tome enzymes have a higher proportion of three and four digit EC term annotations than AraCyc.
A more detailed analysis of reactions in the integrated pathway dataset using only those Figure 1: The relative abundance of Enzyme Commis-sion (EC) terms in the AraCyc (left column ^ diagonal lines), KEGG (middle column ^ crossed lines) and Reactome databases (right column ^ grey bar). The bar heights represent the abundance of proteins with EC annotation at the four different levels of specificity in the EC terms indicated, as a percentage of all enzy-matic proteins in the respective database. Percentages across EC levels, within a given database will not sum to 100 as proteins often have multiple EC assignments at different levels of specificity.
Table 2: Versions of the data sources used in this article.
Data source Version Format Downloaded
KEGG 50.0 KGML and
flatfile
4 April 2009
AraCyc 5.0 Flatfile 4 April 2009 Reactome n/a BioPAX
Level 2
4 April 2009
ENZYME n/a Flatfile 7 April 2009 TAIR 9 Flatfiles 14 July2009 Uniprot 15.0 XML 8 April 2009 TAIR
Interactome
2 October 2007 Flatfile 30 November 2008
ATTED-II 5.2 Flatfile 02 October 2008 BioGrid 2.0.46 PSI-M 2.5 30 November 2008 IntAct 07 November 2008 PSI-M 2.5 30 November 2008
n/a, not applicable.
reactions with the full four digit classification is presented in Figure 2 which shows the contributions from the different databases and highlights the over-lap and unique contributions that they make. From Figure 2 it is clear that the AraCyc database contains the widest coverage of pathway reactions and contributes the greatest number of unique entries to the integrated dataset. It is interesting to note the relatively small number of enzyme functions that are shared between all three pathway databases (154 out of 997).
Another way of evaluating the content of the pathway databases is by comparing the number of proteins from the Arabidopsis genome that have been annotated with EC terms. These data are shown in Figure 3 and show that AraCyc contains the highest number of proteins that can be mapped to reactions. Taken together with the analysis pres-ented in Figure 2, it would be tempting to conclude that as Reactome contributes no new enzymes or EC categories it adds no new information to the dataset. However, it is important to recognise that these purely numerical comparisons take no account of the different approaches to database construction, nor the fact that each database, to an extent, builds on the content of earlier projects and may have originated as a resource for species other than plants. This is probably why KEGG appears not to contribute as much content specific to Arabidopsisas might be expected. Another consideration, when assessing the value of the integrated dataset, is that
by combining AraCyc with Reactome and KEGG, 51% of the genes in AraCyc gain additional pathway annotation from at least one other database. For example, some AraCyc genes without an EC anno-tation have annoanno-tations in KEGG or Reactome or both. For example, the genes AT2G20860 and AT5G08415 encoding Lipoate synthase enzymes have no EC annotation in AraCyc; however, KEGG correctly assigns them to EC 2.8.1.8. Closer inspection reveals that this enzyme was first charac-terised inEscherichia coli, and an EC term omission in EcoCyc has propagated to AraCyc.
Annotating the ATH1 GeneChip with
pathway information
To evaluate the practical impact of using our inte-grated Arabidopsis pathway resource, we used it to assign pathway information to the 22 591 unique probe sets on the Affymetrix ATH1 GeneChip [45]. We considered only probe sets that referenced an Arabidopsis Genome Initiative (AGI) locus iden-tifier as the ‘Source Transcript ID’ and used all the proteins found in the pathway databases. An evalu-ation of which database contributes reaction annota-tions to the probe sets reveals the contribution of the separate pathway resources to the integrated annota-tion. These data are presented in Figure 4, which shows a very modest benefit from combining all Figure 3: Comparing the content of enzymatic proteins in the AraCyc, KEGG and Reactome pathway databases (for Arabidopsis). Enzymatic proteins in the pathway databases are only included if they are annotated as catalyzing a metabolic reaction. These
Arabidopsis pathway proteins amount for 10% of TAIR protein coding genes (3505/33535). The distribution of these enzymatic proteins within the databases is shown in Table 1.
Figure 2: Comparing the content of Enzyme Com-mission classifications in the AraCyc, KEGG and Reac-tome pathway databases (for Arabidopsis). The Venn diagram shows the overlap of EC classifications across the three databases. Reaction classifications that are not specified with the full four digit EC number have been excluded.
three pathway resources; less than might have been expected given the earlier analysis of database con-tents. With the integrated pathway databases, 17.45% of the proteins could be mapped to path-ways, which is a small increase over the impressively comprehensive coverage that can be achieved with AraCyc alone. Although this percentage increase (0.5%) is small it does however, represent an addi-tional 113 annotated probe sets. It is perhaps inter-esting to note that while KEGG provides a relatively small proportion of annotations overall, it is the only other source of unique pathway information in the integrated analysis.
Integration of pathway and
coexpression data
Although our earlier analysis showed that AraCyc was by far the most comprehensive pathway resource, the majority (82.5%) of probe sets on the Affymetrix ATH1 GeneChip remain without a direct link to any pathway. It is possible that gene coexpression analysis could improve this by indi-rectly linking more probe sets with pathways and provide useful information about gene regulatory modules. It has been suggested that coexpressed pro-teins may be members of the same metabolic path-way [46] and coexpression cliques may be helpful in
understanding regulatory mechanisms and in the identification of relevant transcription factors.
To explore the use of an integrated source of pathway information for microarray data analyses we selected the exemplar microarray data set from Gutierrez [47]. This study used the Affymetrix ATH1 GeneChip to test the effects of nitrate and sucrose availability and showed that multiple meta-bolic pathways were affected by the different growth regimes. To construct the coexpression measures, the raw expression values taken from ArrayExpress (ID: E-MEXP-828), were processed using RMA (from the Affymetrix microarray analysis package available as part of BioConductor [48]) and normal-ised by subtracting the mean expression for particular genes across all chips from individual expression values. Pearson’s correlation coefficient was then calculated for all possible pairs of genes. A coexpres-sion network was created in Ondex by adding an edge between two nodes representing proteins if their expression profiles had an absolute correlation value40.9. The resulting coexpression network had 1802 proteins with 5590 edges and was integrated with the previously described combined pathway resource. 1683 complete subgraphs (cliques) were identified using a standard clique detection algorithm [49]. The relationship between the proteins in metabolic pathways and the coexpression of their genes was tested using one-tailed Fisher’s Exact Test to identify significant associations between coexpression cliques and metabolic pathways as designated by the three pathway databases.
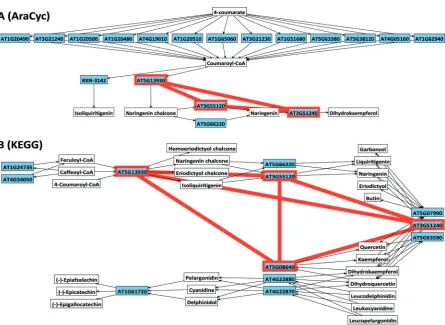
The scope of this article is not appropriate to present this analysis in depth, but working with these data highlighted several important issues rele-vant to the interpretation and integration of pathway information. Each database has a different approach to dividing complex and interacting pathways into smaller themed units of linked reactions. The level of dissection of these units (KEGG calls them maps) in terms of the assignment of reactions to individual groupings is somewhat subjective. This heterogeneity can lead to relevant information being missed if only one of the possible sources is considered. In Figure 5, we use the OVTK to illustrate this using an example from the flavonoid biosynthesis pathway from AraCyc and KEGG, integrated with coexpression data from Gutierrez [47]. The starting point is a coexpression clique, which has been highlighted with a thick border (red) that maps to four proteins in the Figure 4: Metabolic pathway annotation of the
Affymetrix ATH1 GeneChip. The lower part of each bar (red) shows the annotation from the databases that are common to two or more sources. The upper part of the bar (blue) the percentage of annotations unique to each database. The combined height of the bar indicates the proportion of the ATH1 GeneChip that can be annotated using that database alone. The ‘All’ bar (right) indicates the proportion of genes on the ATH1 GeneChip that can be annotated using the integrated databases.
KEGG database. In AraCyc, however, which over-all has more proteins assigned to this pathway, we observe only three of the four proteins in the clique. This difference is due to one of the proteins (flavonol synthase) being assigned to a different path-way (flavonol biosynthesis). The grouping of bio-chemical reactions into pathways is useful for a high level overview of the processes occurring in a complex system, and they are frequently used to aid with interpretation of microarray results. It is important to allow for the fact that pathway definitions are a convenient simplification and a model of cellular biochemistry and should not be considered as biological truth. This is part of the rationale behind the network-centred approach taken in Ondex, where pathway assignments are just another type of information that annotates an enzyme or metabolite.
This case study has illustrated how data integra-tion methods such as those available in the Ondex system can be used to improve the coverage of the data available when using pathway data sources. The process of integration and analysis of the combined datasets provides a useful overview of the differences between the content of the databases and in some cases (not discussed here) can be useful in quality control and identifying conflicting or missing data [50]. The real impact of using a well-integrated data resource comes from the additional information available when using it for data analysis. In our case study, mapping gene expression probe sets to bio-chemical pathways shows that the integration of pathway data can provide a more comprehensive annotation and highlights the differences in the definition of pathways between the individual databases.
Figure 5: Visualisation of enzymes in the flavonoid biosynthesis pathway in Ondex as defined by AraCyc (A) and KEGG (B) databases. This data was also integrated with the coexpression network from an analysis of the micro-array dataset of Gutierrez [35]. The nodes are gene loci that code for enzymes and metabolites and the edges show the possible routes of conversion of metabolites via the catalyzing enzymes. Proteins that were found to be coexpressed with Pearson’s coefficient40.9 are highlighted with a thick border.
CASE STUDY 2çINTEGRATING
PROTEIN INTERACTION DATA
SOURCES
Protein–protein interactions (PPI) are the founda-tion of many essential regulatory processes and define higher levels of organisation of individual proteins into complete functional units. PPI data are provided by a number of sources, but only one of them (curated TAIR interactome) specialises in Arabidopsis. There is a great deal of interest in finding methods for understanding the relationship between protein interactions and coexpression among genes as the basis for making more accurate predictions of biological function from high throughput experi-ments and for easier identification of metabolic and regulatory networks that underlie biological responses (e.g. to disease, environmental stress, etc.). In the first part of our second case study, we have concentrated on the three most relevant PPI data-bases and have assessed the coverage they provide in terms of both individual interactions and protein content. Interactions from the following data sources were integrated using methods supported in the Ondex system: IntAct [51], TheArabidopsis Informa-tion Resource (TAIR) [44] and BioGrid [52].
Overlap of protein interaction
data sources
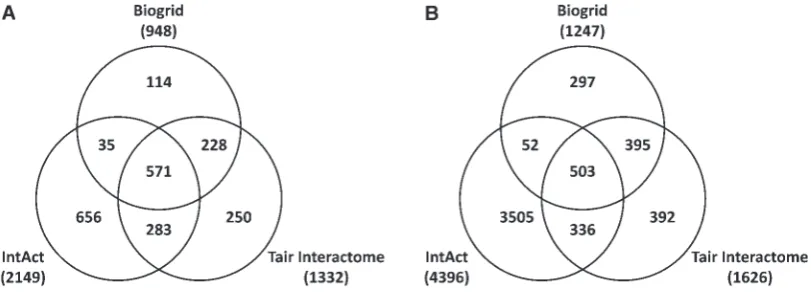
The intersection between the data from these three data sources is shown in Figure 6. The number of proteins (nodes) in the integrated network was 2741, but only 503 out of 5480 interactions in the
integrated PPI network are common to all three sources, with the IntAct database contributing many more proteins than either TAIR interactome or BioGrid.
It is apparent from Figure 6 that each of these sources makes a significant unique contribution to the complete network. The presence of a non-redundant component of protein interactions in each of the sources indicates that data from different subsets of PPI publications has been curated by each of the resources and highlights the value of develop-ing an integrated dataset for maximum coverage of a data domain.
An important consideration when analysing PPI data is the range of experimental methods that have been used to identify a protein interaction. In the integrated dataset each experimental method used in the source database is represented as a type of evidence, which is stored as a property on the edges (relationships) of the graph. Figure 7 shows the frequency distribution of the number of evidence types in the integrated database. It is evident that most interactions have been confirmed by just one experimental method. In the upper panel of Figure 7 is an example of how this type of data can be visualised as a network using the Ondex network visualisation tool (OVTK). The largest connected component of the integrated network has been selected to show how the experimental method used to establish the interaction can be represented in OVTK. In the original screen image, the edge colour indicates which method was used and
Figure 6: The number of protein identities (A) and interactions (B) found in three major protein ^ protein inter-action resources for Arabidopsis (IntAct, Biogrid and TAIR Interactome). The individual networks were merged using TAIR accessions. Additional filtering ensured the consistency of the dataset. The following elements were removed: interactions betweenArabidopsisand non-Arabidopsisproteins (present in IntAct and BioGrid) and proteins with inconsistent accessions. After this, all protein nodes that were no longer connected to the network were also removed.
multiple colours in the same edge show where data comes from more than one method. It is possible to see that one prominent network cluster (bottom right corner) is supported by the same evidence type. This pattern is indicative of data from a targeted (or fishing) study devoted to finding all possible interactors for a limited number of bait proteins.
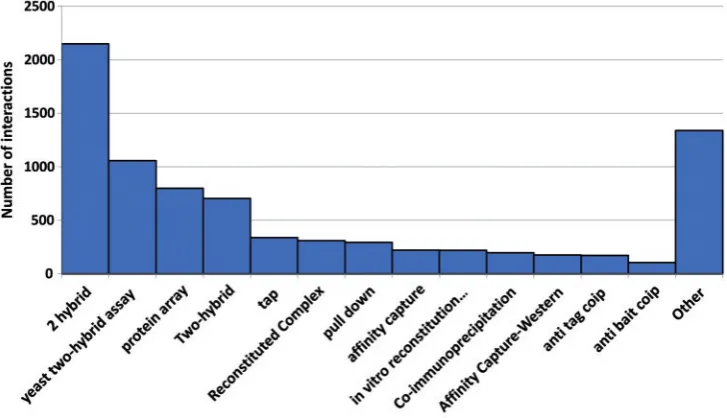
The frequency of the various evidence types found in the Ondex database is shown in Figure 8 and illustrates how integration reveals inconsis-tent use of controlled vocabularies. For example, although the vast majority of the interactions among all three sources were established using the yeast two-hybrid method, these are not named Figure 8: The number of protein interactions with a particular evidence type as indicated in the source database calculated for the whole integrated PPI network. Only the 12 most frequent evidence types are shown but in total there are 66 distinct controlled vocabulary terms. This may under-represent the true variety of methods as there are no naming conventions adopted for the interaction detection method and this is the reason why three different variants of ‘yeast two hybrid’ method are present in the chart.
Figure 7: The frequency distribution of protein interactions associated with named experimental methods taken from the integrated data from IntAct, Biogrid and TAIR Interactome databases. The upper panel shows the largest connected component of the integrated network displayed in the Ondex network visualisation tool (OVTK). In the screen image, each experimental method used to establish an interaction is denoted by a different edge colour. Multiple colours in the same edge show where data comes from more than one method.
consistently among the databases. For example, it is recorded as ‘2 hybrid’ in IntAct and ‘yeast two hybrid assay’ in the TAIR curated interactome. The term ‘2 hybrid’ used in the IntAct controlled vocabulary is formally defined in PSI-MI ontology (MI:0018) whereas the term ‘yeast two hybrid assay’ in TAIR interactome is not defined and appears to be used in a broader sense to specify both classical two-hybrid system and a wider range of related tech-niques and is therefore not an exact match to the definition in IntAct.
An important aspect of the different experimental methods is their reliability at detecting a protein interaction. There is insufficient space to address this issue further here, but others have developed network analysis methods that take this into account (see e.g. [53]).
In addition to the issue of reliability, the experi-mental methods for detection of PPI can have an impact on the number of relations and overall
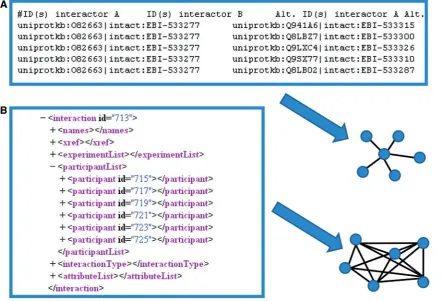
network structure. The interpretation of integrated datasets is further complicated because some experi-mental techniques do not establish the actual inter-actions between individual proteins, but rather their membership in a particular protein complex. This poses problems for how to interpret such informa-tion in terms of binary PPI, as the true interacinforma-tion pairs are unknown. In some cases, where all of the proteins in the complex form a long-term stable interaction, a fully connected cluster of interactions may be an appropriate representation. In addition to the usual challenges of technical or semantic heterogeneity between the data sources, different export file formats from the same database can lead to different interpretations and can potentially result in the incorrect representation of the experimental interactions. Figure 9 illustrates how this situation can arise because of the different data formats used to extract the data about a particular PPI experiment. The figure shows information from
Figure 9: An example network derived from data from the same experiment represented in two different formats exported from the IntAct database (A) tab delimited and (B) PSI-MI v2.5 (XML) version 2.5. It illustrates that different formats can sometimes lead to different interpretations of the same information. If the tab delimited representation is used A the network consists of only five binary interactions with one hub node, whereas in B all six proteins are grouped in the same interaction element, so interactions between all of the members are inferred.
Eubel et al. [54] downloaded from IntAct in both PSI-MI and tab-delimited file formats. The PSI-MI representation groups all of the proteins in the same interaction element, which according to the relevant documentation is interpreted as a clique. In tab-delimited format, the same information is repre-sented as a set of five binary interactions where O82663 interacts with all of the other proteins. Both of the representations are actually misleading, as the original paper only identified these proteins as a complex, but did not measure any interactions between them. In general the clique representation may well be acceptable, if the definition of interac-tion is expanded to include the indirect interacinterac-tions.
Combining protein interaction and
coexpression information
Bringing together multiple types of biological data can aid in the construction of functional networks [29], since proteins involved in the same functional role should be linked by evidence from more than one class of biological information. However, the utility of these approaches is dependent on the information available. For Arabidopsisthere are large collections of data from gene expression studies, and resources such as the ATTED-II database [31, 32] provide information on coexpressed Arabidopsis genes from some 58 microarray experiments (see http://atted.jp/top_help.shtml). There is, however, much less information available on PPI from Arabidopsis and our integrated dataset included only 2741 proteins, with 5480 interaction pairs in total. We have integrated this PPI dataset with coexpres-sion information to explore the extent to which interacting proteins also display similar expression profiles.
We have achieved this by using the coexpression of proteins that are part of the integrated Arabidopsis PPI network that we constructed using Ondex. ATTED-II provides pre-calculated coexpression data forArabidopsis, using either Pearson’s correlation (weighted to reduce effects of sample redundancy) or mutual rank as a measure of similarity between different expression profiles [32]. The statistics are calculated from 1388 Affymetrix arrays available from TAIR. Prior to the combined analysis all the genes that showed no change in expression were removed from the dataset using a comparison with 160 reference invariant genes [55]. The remaining genes were then mapped to the Arabidopsis interac-tion network (described above) and two nodes were
labelled as being coexpressed if the magnitude (pos-itive or negative) of the Pearson correlation coeffi-cient was40.6. From a total of 5157 edges in the integrated PPI network that were considered coex-pressed only 253 (4.9%) edges in the integrated data-set were both coexpressed and involved in a PPI. This number is unexpectedly low, considering that coexpression has been shown to be a strong predictor of PPI [56, 57]. It may also, however, reflect a high number of transient interactions recorded in the dataset. In Jansen et al. [58] it was found that no transiently interacting proteins had an average corre-lation coefficient higher than 0.4; which is below the threshold of 0.6 that we used for constructing the coexpression network. Evaluating the influence of different thresholds on the structure of the integrated data set is deferred to future work.
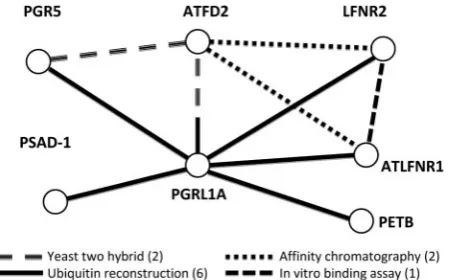
Figure 10 shows a fragment of the integrated network involving seven proteins for which the data supports both protein interaction and gene coexpression, together with the types of experimen-tal evidence that suggests a PPI. The experimenexperimen-tal evidence comes from four different procedures, namely ubiquitin-reconstruction, yeast two hybrid assay, in vitro binding assay and affinity chromatog-raphy. This example illustrates how incorporating additional evidence from other methods for measur-ing PPI or from coexpression can be used to provide
Figure 10: A small part of the integrated coexpres-sion and protein ^ protein interaction network. The nodes representing proteins and edges show links that are supported by both coexpression and an experimen-tal method for establishing interaction. The edges are drawn in different line styles to indicate the different methods used. More than one line style in an edge indi-cates evidence is available from more than one method (i.e. between PGRL1A and ATFD2). The numbers beside the legends refer to the number of instances of PPI interactions.
additional support and increase the confidence in the interactions.
Constructing functional networks in plants is currently limited by the lack of data for some classes of biological information such as PPI where few experiments have been conducted. Such approaches, however, do have the potential to provide additional insight by suggesting new relationships between proteins, especially when complemented by visuali-sation tools that facilitate manual inspection of the resulting networks and dissection of the sources of evidence that contribute to suggesting putative func-tional modules. Visualisation capability has recently been included in the ATTED-II website [31], which provides enhanced tools for inspecting networks in the context of PPI and KEGG pathway information.
DISCUSSION
High throughput techniques are generating large volumes of data in the areas of proteomics, genomics and metabolomics. In view of this abundance and emergent complexity, it is becoming increasingly clear that methods to combine the information and identify patterns in the data are needed in order to advance our understanding of complex biological systems. Data, however, are spread over many resources that are maintained largely independently from each other and this has led to the many differ-ences in the way data are organised, and the formats that have evolved for data distribution.
Defined standards, controlled vocabularies and ontologies are therefore the cornerstones of data integration but they need to be adopted and imple-mented by community and the database curators. This is an ongoing challenge because there are costs for database providers associated with managing the already significant volumes of legacy data and there are costs for data submitters who are being asked to provide more content and more structure to their experimental data for use in public databases. These costs can be significant for scientists managing databases from short term grants, although mecha-nisms for providing infrastructure funding from the European Union through the ELIXIR project (http://www.elixir-europe.org) may help commu-nity databases in the future. Nevertheless, data sub-mitters will also need to play a role and journals (such as the BMC family) have already begun to
request, for example, that authors refer to MIBBI standards for reporting experimental metadata.
For many reasons, it is going to be some time before there is sufficient consistency among all the databases that plant scientists use to make data inte-gration a trivial task. The role of data inteinte-gration tools are therefore going to remain important for some time to come. The purpose of this article has not been to review all the available technologies for data integration but to illustrate, using examples from our ongoing research, why this task is not trivial and to raise awareness of some of the challenges.
When considering alternative approaches to data integration there are a number of key factors to consider which come from the classification of technologies summarised in the Introduction section. The most important is probably whether to choose between a solution that generates a local copy of the integrated dataset in a data warehouse or one which uses dynamic database queries over the Internet to locate and integrate data on request (federated inte-gration). There are strong arguments in favour of both approaches and the decision either way will require a trade-off between difficult technical factors which include:
Timeliness/updating: Federated systems are likely to use the most recent source of data on the Internet and there is therefore no cost for updat-ing. Each new query, however, has to integrate the desired data afresh, so multiple queries over the same dataset are costly, although the costs could be reduced with query processing and caching of results. Warehouse systems offer the opposite—the costs of integration are borne at the time of creating (or updating) the warehouse but each query is going to be cheaper.
Remote/local services:Federated systems rely exten-sively on data access services running on remote computers, potentially from all around the globe. This has a low cost in terms of local infrastructure, but the quality of service from the servers and their networks is not going to be predictable. Local warehouse solutions offer more predictable quality of service, but the local infrastructure can be costly.
Provenance: The traceability of information and management of inferences or decisions leading from any data is recognised as one of the major challenges in data integration. For scientific applications, the primary concern is to be able
to trace back from interesting or problematic results and to reproduce the result of a query. Users of dynamic federated resources have little control over the content or behaviour of the remote services and would have almost no guar-antee that the same query will return the same results from one moment to the next. For many scientific studies, repeatability of the query response and the ability to compare results from different analysis methods over the same dataset are vital. Having a local copy of the integrated dataset that is consistent for the life-time of a project, with updates happening in a controlled fashion, is often the preferred solution.
Confidentiality:The execution of queries and use of services on remote computer systems can be less secure than on a local system. This could be an important consideration when confidential or commercially sensitive data is being analysed using an open federated approach. Of course, a closed federated system could be implemented within an organisation to address this issue but then some of the infrastructure benefits from sharing resources over the Internet would be lost.
This analysis is a necessary simplification of the issues that affect the choice over whether a federated or warehoused solution is the best for a particular application. Often, local expertise and bioinformatics practises will dominate the decision whatever the theoretical options are. It should also be recognised that those with research interests in both approaches recognise where the limitations are and are looking for solutions that narrow the gap between them.
Ondex for data integration
The approach we have taken to data integration in the Ondex system has been to create a general purpose environment for the integration and visual-isation of complex datasets, based on a warehousing model. The main motivations that we had for choos-ing a warehouschoos-ing approach were: that we required control over the data sources and the integration process to have reliable data provenance; the nature of our queries were to support data mining and visualisation for detailed analysis of the same datasets. We also recognised that there were relatively few Internet resources for plant data hosted in resourced international centres hosted in
well-resourced international centres (e.g. EBI, NCBI) offering reliable web services.
An important feature of the Ondex suite is the graphical visualisation and analysis methods that are supported in the OVTK user interface. There are some similarities between the well known Cytos-cape software for interacting with biological net-works [59] and Ondex which also shares features found in other software that use graphical networks visualisation and have been reviewed recently in refs. [60, 61]. The strengths of the Ondex system lie in its adaptability to a wide range of data sources, the methods that have been developed to map different sources into one consistent graph structure and the flexible graph based user interface(s).
The systems that come closest to Ondex in terms of technical approach are BNþþ and BIOZON [12]. Both use a warehousing approach and adopt a graph-based approach to their data representation. BNþþ is similar to Ondex to the extent that data visualisation is considered an important component for the end user. BIOZON has focussed on generat-ing a data warehouse that end-users can browse and extract data from. A similar approach is provided by the STRING database [62] which integrates PPI and gene coexpression data.
Ondex is most appropriately considered as a toolkit for a modestly experienced bioinformatician to develop their own integrated applications and use the network visualisation and analysis tools for data mining of their own datasets.
The two case studies that we selected from ongo-ing research highlight challenges that emerge when developing integrated datasets for Arabidopsis. We chose two contrasting examples to illustrate the nature of the integration problem and to look in more detail at some of the data resources that are in widespread use in the Arabidopsis research community.
Integrating pathway databasesçcase
study 1
This case study was chosen to demonstrate the integration of multiple data sources maintaining the same information as an example of generating a comprehensive database that would be used in other applications such as the annotation of the probe sets from the Affymetrix ATH1 GeneChip. The analysis focussed on the contents of the KEGG, Reactome and AraCyc pathway databases
and to what degree they overlapped or were complementary. The integration clearly showed AraCyc to be the best of the three databases in terms of the coverage of known or predicted Arabidopsis proteins and their involvement in bio-chemical pathway reactions. It was perhaps surprising that the KEGG database did not make more of a unique contribution to the combined resource, but perhaps this is explicable when considering the origins of KEGG in microbial metabolism and that the development of the other pathway databases are not truly independent, but build on each others’ progress.
The comprehensive coverage in AraCyc makes the addition of new pathway information of rela-tively small benefit when applied to the annotation of the ATH1 GeneChip. Again, this is perhaps unsurprising considering that the ATH1 GeneChip was designed in collaboration with the TAIR team who also manage and curate AraCyc. Nevertheless, a small, but potentially useful additional 113 probe sets could be annotated with pathway information using the combined dataset.
Extending the data in the integrated database with coexpression data revealed some aspects of the orga-nisation of pathway data in the different databases that has a bearing on integration. Each database chooses to make decisions about how to split the biochemical reaction network into pathways and this can have an effect on pathway computations [63]. This process is inevitably somewhat subjective and our example shows the impact of this when a gene coexpression clique occurs at a pathway bound-ary in AraCyc but not in KEGG. The integrated nature of our Ondex pathway resource enabled us to recognise the most extensive network of the two resources. A second example of this is the definition of the important plant hormone ABA biosynthesis pathway which has a dedicated pathway in AraCyc composed of five reactions, whereas in KEGG it is subsumed into the much larger Carotenoid biosyn-thesis pathway.
These mixed results from the data integration of Arabidopsis pathway information illustrate the benefits and pitfalls of evaluating methods in a model organism. The range of resources makes it possible to explore datasets not yet available in other plant species. On the other hand, the invest-ment in integration that has already taken place by centres such as TAIR makes the potential benefits of integration less easy to realise.
Integrating PPI dataçcase study 2
In our second case study, we chose protein inter-action datasets. These were expected to be more typical of independently developed databases and this was indeed the case. In our analysis we dis-covered the most obvious of semantic integration problems—that of inconsistent use of terminology to describe the experimental methods by BioGrid, IntAct and TAIR Interactome. This type of hetero-geneity is difficult to deal with automatically. While it would be easy to resolve inconsistent naming such as ‘2 hybrid’ and ‘yeast two hybrid assay’, some of the other methods can have multiple variants and differ-ent names and will require someone with expert knowledge to identify these correctly. This is there-fore an excellent example of how MIBBI projects are making an important contribution by develop-ing ontologies for the experimental methods from which the data derives. Had, for example, the three protein interaction databases that we used fol-lowed the MIMIx ontology for describing the experimental methods, we would have not seen the diversity of terms used to name the yeast two hybrid method in Figure 8.
All three databases considered here hold informa-tion about PPI experiments gathered or supported by the scientific literature. The selection of the liter-ature and curation methods inevitably creates differ-ences between the databases. Furthermore, there is a difference between what has been established in an interaction experiment and what is considered as an established fact. For example, out of 12 proteins listed as members of theArabidopsisRNA polymerase II complex by KEGG only 5 were found in our integrated PPI database from all three sources.
Given the differences between the data collection methods used in the three interaction databases, it was notable that the data integration process gener-ated a more complete resource with the number of proteins catalogued as involved in interactions increasing by 27% over the single most comprehen-sive database, which was IntAct. The number of interactions was also increased by a similar amount relative to IntAct (25%). This clearly demonstrates the potential advantage of integration in this data domain.
It was interesting to note that a relatively small number of proteins were present in all three data-bases (20%) and an even smaller number of interac-tions were found in common (11%). This may reflect differences between the data collection and curation
strategies of the three databases but there may be other systematic differences and we are currently investigating these further.
Another potential benefit of integration of data across multiple datasets is to increase confidence in noisy data by combining multiple ‘hints’ from inde-pendent sources. This is especially relevant for PPI, as many of the currently used detection methods have limited accuracy. Our analysis showed that rel-atively small numbers of interactions are supported by multiple sources of evidence. We showed how we can represent this in our visualisation environ-ment OVTK for an easy overview of interaction relationships and how specific patterns emerge from the data using particular approaches such as targeted interaction fishing.
There is an active research interest in Bioinfor-matics for using indirect evidence that could be used to indicate interactions, including gene coexpression [58, 64] and inference of interactions from sequence homology [65, 66]. The problem of introducing such indirect evidence is that some numerical mea-sure of confidence, like accuracy of particular inter-action detection methods, is required and it is often not provided by the source databases. Another diffi-culty lies in resolving the provenance of data in order to avoid counting the same piece of evidence captured by multiple sources several times. We believe these are fruitful areas of study and there-fore maximising the set of protein interactions sup-ported by multiple direct measurement methods is a useful resource for calibrating the methods for combining computationally predicted and measured interaction data.
FUTURE DIRECTIONS
Here we have considered data describing PPI, the coexpression of gene transcripts and biological pathways as examples to illustrate some of the chal-lenges associated with integrating plant genomics resources. High throughput technologies are being developed that will generate other sources of biolog-ical information which will become increasingly valuable for providing insight into plant systems: these include metabolomics profiles which will be important for pathway discovery, data generated from high throughput phenotyping systems [67] and image data associated with gene and protein localisation. Additionally, long time series data sets require dynamic views of the integrated networks;
whereas most of the current approaches to data inte-gration involve developing essentially a static view of the system. The development of data standards and ontologies will further help the integration process but the synthesis of all relevant information in a manner to facilitate knowledge discovery will involve continued development of data mining and visualisation software.
Key Points
Data integration is a challenge in plant science, but even partial integration can reveal novel insights from the data.
Ambiguities in data and missing information are obstacles to complete integration. This highlights the need to develop more standards for recording data.
The further development of data mining and visualisation soft-ware is important for knowledge discovery from integrated bio-logical networks.
Applications of data integration software such as Ondex can help address issues associated with syntactic and semantic heterog-eneity in data from multiple sources.
FUNDING
Rothamsted Research is funded by the Biotechnology and Biological Sciences Research Council. This work was supported by the Biotechnology and Biological Sciences Research Council through grant numbers [BBS/B/13640, BB/F006039/1 and studentship BBS/S/E/2006/ 13205 (AL)]. M.H. gratefully acknowledges support from the Lawes Agricultural Trust.
References
1. Sayers EW, Barrett T, Benson DA,et al. Database resources of the National Center for Biotechnology Information.
Nucleic Acids Res2009;37:D5–15.
2. Gardner SP. Ontologies and semantic data integration.Drug DiscovToday2005;10:1001–7.
3. Orchard S, Jones P, Taylor C, et al. Proteomic data exchange and storage: the need for common standards and public repositories.Methods Mol Biol2007;367:261–70. 4. Taylor CF, Field D, Sansone S-A,et al. Promoting coherent
minimum reporting guidelines for biological and biomedi-cal investigations: the MIBBI project.Nat Biotech 2008;26: 889–96.
5. Minimum Information for Biological and Biomedical Investigators. http://www.mibbi.org (August 2009, date last accessed). 6. Avraham S, Tung C-W, Ilic K,et al. The Plant Ontology
Database: a community resource for plant structure and developmental stages controlled vocabulary and annota-tions.Nucleic Acids Res2008;36:D449–54.
7. Rubin DL, Shah NH, Noy NF. Biomedical ontologies: a functional perspective.Brief Bioinform2008;9:75–90.
8. Etzold T, Ulyanov A, Argos P. SRS: information retrieval system for molecular biology data banks.Methods Enzymol
1996;266:114–28.
9. Baxevanis AD. Searching the NCBI databases using Entrez.
Curr Protoc Bioinformatics2006; Chapter 1:Unit 13.
10. Jensen LJ, Kuhn M, Stark M,et al. STRING 8 – a global view on proteins and their functional interactions in 630 organisms.Nucleic Acids Res2009;37:D412–6.
11. Smedley D, Haider S, Ballester B,et al. BioMart—biological queries made easy.BMC Genomics2009;10:22.
12. Birkland A, Yona G. BIOZON: a system for unification, management and analysis of heterogeneous biological data.
BMC Bioinformatics2006;7:70.
13. Baitaluk M, Qian X, Godbole S,et al. PathSys: integrating molecular interaction graphs for systems biology. BMC Bioinformatics2006;7:55.
14. Ku¨ntzer J, Blum T, Gerasch A,et al. BNþþ—a biological information system.J Integr Bioinformatics2006;2:34. 15. Ko¨hler J, Baumbach J, Taubert J,et al. Graph-based analysis
and visualization of experimental results with ONDEX.
Bioinformatics2006;22:1383–90.
16. Ko¨hler J, Rawlings C, Verrier P,et al. Linking experimental results, biological networks and sequence analysis methods using Ontologies and Generalized Data Structures.In Silico Biol2004;5:33–44.
17. Oinn T, Addis M, Ferris J, et al. Taverna: a tool for the composition and enactment of bioinformatics workflows.
Bioinformatics2004;20:3045–54.
18. Gordon PMK, Trinh Q, Sensen CW. Semantic web service provision: a realistic framework for bioinformatics program-mers.Bioinformatics2007;23:1178–80.
19. Accelrys. Pipeline Pilot. http://accelrys.com/products/ scitegic/ (10th August 2009, date last accessed).
20. Wong L. Technologies for integrating biological data.Brief Bioinformatics2002;3:389–404.
21. Haas LM, Schwarz PM, Kodali P, et al. DiscoveryLink: a system for integrated access to life sciences data sources.
IBM SystemsJ2001;40:489–511.
22. Dowell RD, Jokerst RM, Day A, et al. The distributed annotation system.BMC Bioinformatics2001;2:7.
23. Baker CJO, Cheung K-H. Semantic Web: Revolutionizing Knowledge Discovery in the Life Sciences. New York: Springer, 2007.
24. Belleau F, Nolin MA, Tourigny N,et al. Bio2RDF: towards a mashup to build bioinformatics knowledge systems.
J Biomed Inform2008;41:706–16.
25. Chaudhri V, Murray K, Pacheco J,et al. Graph-based acqui-sition of expressive knowledge. In: Motta E, Shadbolt N, Stutt A, Gibbins N, (eds). Engineering Knowledge in the Age of the Semantic Web EKAW2004 (LNAI3257). Berlin, Heidelberg: Springer, 2004;231–47.
26. Pesch R, Lysenko A, Hindle M, et al. Graph-based sequence annotation using a data integration approach.
J Integr Bioinformatics2008;5:94.
27. Taubert J, Hindle M, Lysenko A,et al. Linking life sciences data using graph-based mapping. In: Paton N, Missier P, Hedeler C, (eds). DILS 2009, LNBI 5647. Berlin, Heidelberg: Springer-Verlag, 2009;16–30.
28. Altschul SF, Gish W, Miller W,et al. Basic local alignment search tool.J Mol Biol1990;215:403–10.
29. Lee I, Date SV, Adai AT, et al. A probabilistic functional network of yeast genes.Science2004;306:1555–8.
30. Li J, Li X, Su H, et al. A framework of integrating gene relations from heterogeneous data sources: an experiment on Arabidopsis thaliana. Bioinformatics 2006;22: 2037–43.
31. Obayashi T, Hayashi S, Saeki M,et al. ATTED-II provides coexpressed gene networks for Arabidopsis.Nucleic Acids Res
2009;37:D987–91.
32. Obayashi T, Kinoshita K, Nakai K, et al. ATTED-II: a database of co-expressed genes and cis elements for identi-fying co-regulated gene groups in Arabidopsis.Nucleic Acids Res2007;35:D863–9.
33. Zhang P, Foerster H, Tissier CP, et al. MetaCyc and AraCyc. Metabolic pathway databases for plant research.
Plant Physiol2005;138:27–37.
34. AraCyc.Release Notes. http://www.arabidopsis.org/biocyc/ releasenotes.jsp (August 2009, date last accessed).
35. Joshi-Tope G, Gillespie M, Vastrik I, et al. Reactome: a knowledgebase of biological pathways. Nucleic Acids Res
2005;33:D428–32.
36. Vastrik I, D’Eustachio P, Schmidt E, et al. Reactome: a knowledge base of biologic pathways and processes.
Genome Biol2007;8:R39.
37. Chen F, Mackey AJ, Stoeckert CJ Jr,et al. OrthoMCL-DB: querying a comprehensive multi-species collection of ortholog groups.Nucleic Acids Res2006;34:D363–8. 38. Li L, Stoeckert CJ, Jr, Roos DS. OrthoMCL: identification
of ortholog groups for eukaryotic genomes. Genome Res
2003;13:2178–89.
39. Tsesmetzis N, Couchman M, Higgins J,et al. Arabidopsis reactome: a foundation knowledgebase for plant systems biology.Plant Cell2008;20:1426–36.
40. Nomenclature Committee of the International Union of Biochemistry and Molecular Biology (NC-IUBMB).
EurJ Biochem1999;264:610–50.
41. Moss GP. Enzyme Nomenclature. http://www.chem.qmul .ac.uk/iubmb/enzyme/(August 2009, date last accessed). 42. Bairoch A. The ENZYME database in 2000.Nucleic Acids
Res2000;28:304–5.
43. Apweiler R, Bairoch A, Wu CH, et al. UniProt: the Universal Protein knowledgebase. Nucleic Acids Res 2004;
32:D115–9.
44. Swarbreck D, Wilks C, Lamesch P,et al. The Arabidopsis Information Resource (TAIR): gene structure and function annotation.Nucleic Acids Res2008;36:D1009–14.
45. Redman JC, Haas BJ, Tanimoto G,et al. Development and evaluation of an Arabidopsis whole genome Affymetrix probe array.PlantJ2004;38:545–61.
46. Gachon CM, Langlois-Meurinne M, Henry Y, et al. Transcriptional co-regulation of secondary metabolism enzymes in Arabidopsis: functional and evolutionary impli-cations.Plant Mol Biol2005;58:229–45.
47. Gutierrez RA, Lejay LV, Dean A,et al. Qualitative network models and genome-wide expression data define carbon/ nitrogen-responsive molecular machines in Arabidopsis.
Genome Biol2007;8:R7.
48. Gentleman RC, Carey VJ, Bates DM,et al. Bioconductor: open software development for computational biology and bioinformatics. Genome Biol2004;5:R80.
49. Lau HT. A Java Library of Graph Algorithms and Optimization. Boca Raton, FL, London: Chapman & Hall/CRC, 2007. 50. Ko¨hler J, Munn K, Ru¨egg A,et al. Quality control for the
Gene Ontology: Text- mining methodologies and formal design principles.BMC Bioinformatics2006;7:212.
51. Kerrien S, Alam-Faruque Y, Aranda B,et al. IntAct—open source resource for molecular interaction data.Nucleic Acids Res2007;35:D561–5.
52. Breitkreutz BJ, Stark C, Reguly T, et al. The BioGRID interaction database: 2008 update. Nucleic Acids Res 2008;
36:D637–40.
53. Deane CM, Salwinski L, Xenarios I,et al. Protein interac-tions: two methods for assessment of the reliability of high throughput observations. Mol Cell Proteomics 2002;1: 349–56.
54. Eubel H, Jansch L, Braun HP. New insights into the respiratory chain of plant mitochondria. Supercomplexes and a unique composition of complex II. Plant Physiol
2003;133:274–86.
55. Czechowski T, Stitt M, Altmann T, et al. Genome-wide identification and testing of superior reference genes for transcript normalization in Arabidopsis. Plant Physiol2005;
139:5–17.
56. Kemmeren P, van Berkum NL, Vilo J, et al. Protein interaction verification and functional annotation by inte-grated analysis of genome-scale data. Mol Cell 2002;9: 1133–43.
57. von Mering C, Krause R, Snel B,et al. Comparative assess-ment of large-scale data sets of protein-protein interactions.
Nature2002;417:399–403.
58. Jansen R, Greenbaum D, Gerstein M. Relating whole-genome expression data with protein-protein interactions.
Genome Res2002;12:37–46.
59. Shannon P, Markiel A, Ozier O, et al. Cytoscape: a software environment for integrated models of bio-molecular interaction networks. Genome Res 2003;13: 2498–504.
60. Suderman M, Hallett M. Tools for visually exploring bio-logical networks.Bioinformatics2008;23:2651–9.
61. Pavlopoulos GA, Wegener A-L, Schneider R. A survey of visualization tools for biological network analysis. BioData Mining2008;1:12.
62. Jensen LJ, Kuhn M, Stark M,et al. STRING 8—a global view on proteins and their functional interactions in 630 organisms.Nucleic Acids Res2009;37:D412–16.
63. Green ML, Karp PD. The outcomes of pathway database computations depend on pathway ontology.Nucl Acids Res
2006;34:3687–97.
64. Bhardwaj N, Lu H. Correlation between gene expression profiles and protein-protein interactions within and across genomes.Bioinformatics2005;21:2730–8.
65. Goffard N, Garcia V, Iragne F, et al. IPPRED: server for proteins interactions inference. Bioinformatics 2003;19: 903–4.
66. Huang TW, Tien AC, Huang WS,et al. POINT: a database for the prediction of protein-protein interactions based on the orthologous interactome. Bioinformatics 2004;20: 3273–6.
67. Micol JL. Leaf development: time to turn over a new leaf?
Curr Opin Plant Biol2009;12:9–16.