D E B A T E
Open Access
Testing for baseline differences in randomized
controlled trials: an unhealthy research behavior
that is hard to eradicate
Michiel R de Boer
1*, Wilma E Waterlander
2, Lothar DJ Kuijper
1, Ingrid HM Steenhuis
1and Jos WR Twisk
3Abstract
Background:According to the CONSORT statement, significance testing of baseline differences in randomized
controlled trials should not be performed. In fact, this practice has been discouraged by numerous authors throughout the last forty years. During that time span, reporting of baseline differences has substantially decreased in the leading general medical journals. Our own experience in the field of nutrition behavior research however, is that co-authors, reviewers and even editors are still very persistent in their demand for these tests. The aim of this paper is therefore to negate this demand by providing clear evidence as to why testing for baseline differences between intervention groups statistically is superfluous and why such results should not be published.
Discussion:Testing for baseline differences is often propagated because of the belief that it shows whether randomization was successful and it identifies real or important differences between treatment arms that should be accounted for in the statistical analyses. Especially the latter argument is flawed, because it ignores the fact that the prognostic strength of a variable is also important when the interest is in adjustment for confounding. In addition, including prognostic variables as covariates can increase the precision of the effect estimate. This means that choosing covariates based on significance tests for baseline differences might lead to omissions of important covariates and, less importantly, to inclusion of irrelevant covariates in the analysis. We used data from four supermarket trials on the effects of pricing strategies on fruit and vegetables purchases, to show that results from fully adjusted analyses sometimes do appreciably differ from results from analyses adjusted for significant baseline differences only. We propose to adjust for known or anticipated important prognostic variables. These could or should be pre-specified in trial protocols. Subsequently, authors should report results from the fully adjusted as well as crude analyses, especially for dichotomous and time to event data.
Summary:Based on our arguments, which were illustrated by our findings, we propose that journals in and outside the field of nutrition behavior actively adopt the CONSORT 2010 statement on this topic by not publishing significance tests for baseline differences anymore.
Keywords:Epidemiology, Methods, Reporting, Nutrition behavior research, Statistical analyses
Background
One of the recommendations of the CONSORT state-ment is that a table is presented showing baseline demo-graphic and clinical characteristics for each group. Importantly, according to this recommendation in the CONSORT statement, “significance testing of baseline
differences in randomized controlled trials (RCTs) should not be performed, because it is superfluous and can mis-lead investigators and their readers”[1]. In their paper on the explanation and elaboration of the CONSORT 2010 statement, the authors refer to an article of Altman dat-ing back as far as 1985 [2]. In fact, there have been nu-merous papers on the subject, some of which have been published even before Altman’s article, in which signifi-cance testing of baseline differences has been discour-aged or condemned [3-7]. Throughout the years there have been several literature reviews on this topic [6-9]. * Correspondence:[email protected]
1Department of Health Sciences and the EMGO Institute for Health and Care Research, Faculty of Earth and Life Sciences, VU University Amsterdam, De Boelelaan 1085, 1081 HV Amsterdam, The Netherlands
Full list of author information is available at the end of the article
All of these reviews focused on the leading general med-ical journals although not all on the same ones. These re-views show a decreasing trend in the reporting of tests for baseline differences from it being an “ubiquitous error”in the 1978 and 79 issues of the NEJM [8] to 38.2% of the RCT’s published in the NEJM, the JAMA, the Lancet and the BMJ in the first half of 2007 [6].
In the last few years we have carried out several web-based and one real-life randomized controlled supermar-ket trials on the effect of several pricing strategies on food purchases. These have all been published in jour-nals within the field of nutrition behavior, of which two in this journal [10-13]. In the process of writing and sub-mitting these papers, we were, to some surprise, chal-lenged by co-authors to include p-values of tests for baseline differences. The discussions were resolved and we were initially able to convince all authors of the fact that it would be better not to include these tests. This means that in our submitted papers we followed the CONSORT statement in not testing for baseline dif-ferences. However, after submission of the papers we were again faced with comments that tests of baseline differences should be added, but now from reviewers or even editors. To our surprise and dismay, these re-viewers insisted on this point even after we had pro-vided a logical explanation why we preferred not to present these p-values. Eventually, we decided to add the tests and as a result they are included in all four of our publications.
After our initial frustration, we started to think about possible explanations underlying the strong belief in test-ing for baseline differences in this field. One explanation could be that people, including scientists, are copycats and that they believe in what they see others do. An al-ternative, potentially related reason might be that most of the literature on this topic has been published in bio-statistical or methodological journals and is thus ob-scured from most of the applied behavioral nutrition or physical activity researchers.
The aim of this paper is therefore to negate the mis-conception that still exists among a large number of re-searchers in this field that baseline differences between intervention groups should be tested statistically by pro-viding a strong argument as to why this is unnecessary. Furthermore, we argue that the choice of adjustment variables to include in the analysis should not be based on these tests. We will attempt to accomplish this by discussing the origin of the misconception and why stat-istical testing of baseline differences is flawed and mislead-ing. Moreover, we will discuss practical consequences of testing for baseline differences and finally provide some guidance on how baseline differences should be taken into account. Most of our arguments are not new, but are re-statements of what other authors have argued. Where
possible we will use examples of the trials we published to illustrate these arguments.
Discussion
Why do people believe testing of baseline differences should be done and why is this a misconception?
The arguments most often used to substantiate the choice for statistical testing for baseline differences are that one needs to examine whether randomization was successful and that one needs to assess whether ob-served differences in baseline characteristics are‘real’or
baseline differences should be taken into account [3]. This is usually where the second argument for testing for base-line differences (the need to assess whether observed differ-ences are real or important) comes into play.
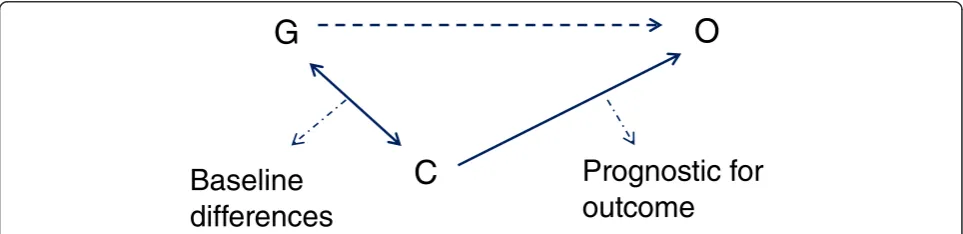
The misconception in testing for baseline differences to determine whether real or important differences occur, should be seen in light of the difference between meaningful and statistically significant (detectable) dif-ferences. Meaningful differences are often not detected in a statistically significant manner [3,8,15], because tri-als are not powered for this purpose (type II error). On the other hand a statistically significant difference is not necessarily a meaningful one [3,14]. Meaningful differ-ences here refer to differdiffer-ences in baseline characteristics that influence (confound) the results of a trial. Con-founding occurs when there is a relation between a certain characteristic or covariate (C) and group allo-cation (G) and also between this characteristic and the outcome (O) [3,8,14], see Figure 1. In other words, con-founding occurs when there is a difference between the intervention and control groups in a certain characteris-tic that is prognoscharacteris-tic for the outcome of that trial. The amount of potential confounding does not depend upon whether these relations are statistically significant, but ra-ther on the magnitude of these relations [3,8,15]. This could for example mean that a relatively small and non-statistically significant difference in a very strong prog-nostic factor could cause meaningful confounding and vice versa that a large difference in a characteristic unre-lated to outcome would cause no confounding at all. Hence, potential confounders should not be chosen based on statistical tests of baseline differences.
Practical consequences of testing for baseline differences As discussed in the above, the practical consequences of testing for baseline differences mainly boil down to the question of whether the study conclusions would differ if only those covariates which proved to be significantly different at baseline were adjusted for in the analysis in-stead of adjusting for all prognostic factors.
In their review of 50 clinical trials in four major med-ical journals from 1997, Pocock et al [7] found that there were hardly any differences between estimates, CI’s and p-values from adjusted and unadjusted analyses. How-ever, many authors have argued that the choice of covar-iates can potentially impact on the results from a trial [2,3,8,14]. With regard to the effect estimate this is espe-cially true for smaller trials in which large baseline dif-ferences in prognostic variables usually go undetected. In- or excluding such prognostic variables as a covariate in/from the analysis can thus result in appreciably differ-ent effect estimates for the treatmdiffer-ent effect. If the inter-est is in p-values and the null-hypothesis tinter-est regarding the treatment effect, the choice of covariates will have the same impact regardless of the sample size [4,14]. To illustrate this; let us assume that a certain difference in a given prognostic factor, say factor X, between interven-tion and control group results in a p-value of 0.15 after testing. If this p-value was derived in a small trial, the difference in this factor between groups would be rela-tively large, whereas for a large trial on the same treat-ment effect, this difference would be relatively small. Now, let us bear in mind that the p-value can be deter-mined via dividing the effect estimate over the standard error of the effect estimate and also that the standard error decreases with an increasing sample size. Return-ing to our hypothetical example, we can argue that in-cluding factor X in the analysis of the treatment effect of the small trial, will influence the effect estimate of the treatment effect and by that also the p-value from the statistical test. In addition, including factor X in the ana-lysis of the large trial, will have a smaller influence on the effect estimate of the treatment effect, but will have the same effect on the p-value as in the smaller trial. The latter is caused by the fact that the standard error from the treatment effect in the larger trial is smaller and therefore a relatively smaller change in the effect es-timate after adjustment of prognostic factors, will have the same influence on the fraction of effect estimate and standard error and the resulting p-value.
G
C
O
Baseline
differences
Prognostic for
outcome
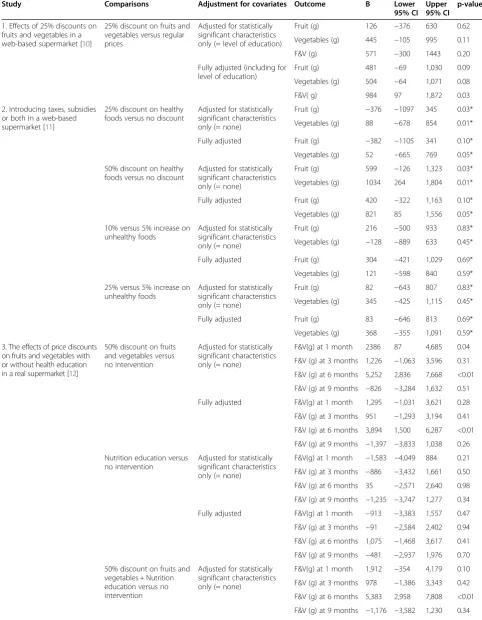
We examined for the four trials we published [10-13] whether analysis adjusted for pre-defined potential con-founders (referred to as fully adjusted models), which were reported in the publications, differed from analyses adjusted only for statistically different baseline character-istics with respect to the hypothesis tests and the magni-tude of differences between conditions, see Table 1. We confined ourselves to outcomes related to fruit and/or vegetable purchases which were the primary outcomes analyzed in these studies. For three of the trials (study 2,3 and 4) we did not observe any statistically significant baseline differences, which means that we compared our fully adjusted models with crude models. For the other trial (study 1), we found one statistically significant dif-ference, namely for level of education. For that trial we therefore compared results from the fully adjusted ana-lyses (including adjustment for level of education) with those from analyses adjusted for level of education only. In these four trials a multitude of effects were analyzed, i.e. for different comparisons of several conditions and/ or for different time points. The different conditions that were compared were: regular prices versus 25% discount on fruits and vegetables (study 1); combinations of price reductions on healthy foods (no; 25%; 50%) and price in-creases on unhealthy foods (5%; 10%; 25%) (study 2); 50% price discounts on fruits and vegetables, nutrition education, 50% price discounts plus nutrition education, or no intervention (study 3); combinations of price re-duction (10%; 25%; and 50%) an different labels (‘special offer’, ‘healthy choice’ and ‘special offer & healthy choice’) (study 4).
For study 2 and 4, two web-based supermarket trials, there were no appreciable differences for any of the ob-served effect sizes between crude and fully adjusted ana-lyses. However, in study 2 the statistical tests from the crude analyses on the effects of discounts did result in statistically significant findings, whereas the adjusted did not (crude p-values of 0.03 and 0.01 versus adjusted p-values of 0.10 and 0.05). The conclusions of the paper were based on the results from the crude and fully ad-justed models and also on the results from other end-points such as number of healthy foods and total number of items purchased. For study 1, a web-based supermar-ket trial on the effect of 25% discounts on fruits and veg-etables, the fully adjusted analyses resulted in larger differences compared to the analyses adjusted only for level of education. In addition, for combined fruits and vegetables (F&V) purchases the difference between the 25% discount condition and the control condition was statistically significant in the adjusted analysis (984 grams; 95% CI: 97, 1,872; p = 0.03), but not in the analysis adjusted for level of education only (571 grams; 95% CI: −300, 1,443: p = 0.20). Analyses of fruit and vegetables separately did not show any statistically significant differences at the
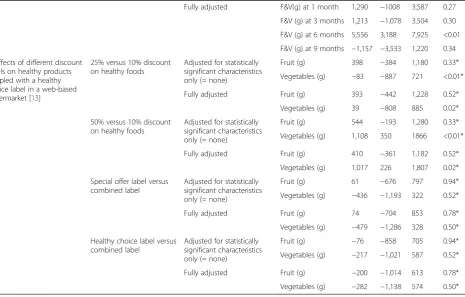
5% significance level irrespective of the adjustments made. The conclusion of the article was primarily based upon the results from the fully adjusted analysis. Therefore con-clusions might have very well been different had the ana-lyses been adjusted for statistically significant baseline differences only. Study 3 comprised a real supermarket trial on the effects of price discounts and nutrition educa-tion and the combinaeduca-tion of both. Price discounts and price discounts in combination with nutrition education showed statistically significant effects compared to no intervention at six months in the crude and fully adjusted analyses. The magnitude of the effect was somewhat atten-uated in the fully adjusted analysis for the effect of price discounts (5,252 vs. 3,894 g per 2wks), but not for the combined effect of price discounts and nutrition education (5,383 vs. 5,556 g per 2wks). No other statistically signifi-cant effects were observed, except for the crude effect of price discounts at one month (2386 g per 2 wks; 95% CI: 87, 4,685: p =0.04). This effect was much smaller and not statistically significant in the adjusted analysis (1,295 g per 2 wks; 95% CI:−1,031, 3,621: p =0.28). Conclusions were restricted to the statistically significant and fairly consist-ent results at 6 months follow-up.
To summarize our examples, only one out of the four studies did not show differences between fully adjusted analyses and analyses adjusted for statistically significant baseline differences only. Two studies showed some dif-ferences, either in results from statistical tests or also in actual effect sizes, but these differences most likely would not have affected the conclusions, whereas one study showed differences that could very well have af-fected the conclusions.
We realize that we have only examined four trials and that results from comparisons for these specific trials are not generalizable with respect to the number, amount and precipitated relevance of differences we observed. Nevertheless, these examples show that using all the available relevant information in the analyses of trials might result in different outcomes compared to analyses where covariates are restricted to statistically significant, but not necessarily important, differences between groups at baseline. In the following we will discuss these practices in some more detail and we will try to provide some prac-tical guidelines on how to deal with adjustment for covari-ates in trials alternative to the practice of adjusting only for statistically significant baseline differences.
Some practical guidance for dealing with baseline differences
Table 1 Results from four randomized controlled supermarket trials with different methods of adjustment for baseline covariates
Study Comparisons Adjustment for covariates Outcome B Lower 95% CI
Upper 95% CI
p-value
1. Effects of 25% discounts on fruits and vegetables in a web-based supermarket [10]
25% discount on fruits and vegetables versus regular prices
Adjusted for statistically significant characteristics only (= level of education)
Fruit (g) 126 −376 630 0.62
Vegetables (g) 445 −105 995 0.11
F&V (g) 571 −300 1443 0.20
Fully adjusted (including for level of education)
Fruit (g) 481 −69 1,030 0.09
Vegetables (g) 504 −64 1,071 0.08
F&V( g) 984 97 1,872 0.03
2. Introducing taxes, subsidies or both in a web-based supermarket [11]
25% discount on healthy foods versus no discount
Adjusted for statistically significant characteristics only (= none)
Fruit (g) −376 −1097 345 0.03*
Vegetables (g) 88 −678 854 0.01*
Fully adjusted Fruit (g) −382 −1105 341 0.10*
Vegetables (g) 52 −665 769 0.05*
50% discount on healthy foods versus no discount
Adjusted for statistically significant characteristics only (= none)
Fruit (g) 599 −126 1,323 0.03*
Vegetables (g) 1034 264 1,804 0.01*
Fully adjusted Fruit (g) 420 −322 1,163 0.10*
Vegetables (g) 821 85 1,556 0.05*
10% versus 5% increase on unhealthy foods
Adjusted for statistically significant characteristics only (= none)
Fruit (g) 216 −500 933 0.83*
Vegetables (g) −128 −889 633 0.45*
Fully adjusted Fruit (g) 304 −421 1,029 0.69*
Vegetables (g) 121 −598 840 0.59*
25% versus 5% increase on unhealthy foods
Adjusted for statistically significant characteristics only (= none)
Fruit (g) 82 −643 807 0.83*
Vegetables (g) 345 −425 1,115 0.45*
Fully adjusted Fruit (g) 83 −646 813 0.69*
Vegetables (g) 368 −355 1,091 0.59*
3. The effects of price discounts on fruits and vegetables with or without health education in a real supermarket [12]
50% discount on fruits and vegetables versus no intervention
Adjusted for statistically significant characteristics only (= none)
F&V(g) at 1 month 2386 87 4,685 0.04
F&V (g) at 3 months 1,226 −1,063 3,596 0.31
F&V (g) at 6 months 5,252 2,836 7,668 <0.01
F&V (g) at 9 months −826 −3,284 1,632 0.51
Fully adjusted F&V(g) at 1 month 1,295 −1,031 3,621 0.28
F&V (g) at 3 months 951 −1,293 3,194 0.41
F&V (g) at 6 months 3,894 1,500 6,287 <0.01
F&V (g) at 9 months −1,397 −3,833 1,038 0.26
Nutrition education versus no intervention
Adjusted for statistically significant characteristics only (= none)
F&V(g) at 1 month −1,583 −4,049 884 0.21
F&V (g) at 3 months −886 −3,432 1,661 0.50
F&V (g) at 6 months 35 −2,571 2,640 0.98
F&V (g) at 9 months −1,235 −3,747 1,277 0.34
Fully adjusted F&V(g) at 1 month −913 −3,383 1,557 0.47
F&V (g) at 3 months −91 −2,584 2,402 0.94
F&V (g) at 6 months 1,075 −1,468 3,617 0.41
F&V (g) at 9 months −481 −2,937 1,976 0.70
50% discount on fruits and vegetables + Nutrition education versus no intervention
Adjusted for statistically significant characteristics only (= none)
F&V(g) at 1 month 1,912 −354 4,179 0.10
F&V (g) at 3 months 978 −1,386 3,343 0.42
F&V (g) at 6 months 5,383 2,958 7,808 <0.01
comparison (same treatment and control condition and same numbers in both groups) and one would average over all effect estimates, that this would result in the
‘true’treatment effect. However, this is only a theoretical notion and the ‘true’ treatment effect remains unknown in practice. This means that a given trial may be close to the ‘true’ treatment effect or it might be further away. Imbalance in a trial will mean that the effect estimate of that trial will generally be further away from the ‘true’ treatment effect. An epidemiologist would say that the internal validity is compromised. By adjusting for known prognostic variables that differ, be it statistically signifi-cant or not, between the treatment groups, the effect estimate will be closer to the ‘true’ effect or in other words: it will be more internally valid. Another or re-lated advantage of adjusting for known prognostic vari-ables, which also applies when there is no difference at baseline, is that the effect estimate will be more precise, i.e. the confidence interval will usually be smaller [14,16]. The reason for this is that the prognostic factors will explain part of the unexplained variance which re-duces the standard error of the treatment effect. This is in fact the whole idea behind analyses of covariance (ANCOVA). We therefore agree with others [2-4,14,17]
that adjustment for prognostic variables should be made. This is irrespective of the fact whether differences on these variables were statistically significant at baseline.
Some authors have argued that prognostic factors may not be known beforehand [6,7]. We do not think this is a major problem however, because, as put so eloquently by Senn [4] “Researchers should remember that we are often studying new therapies, but we more rarely find ourselves studying new diseases”, meaning that prognos-tic variables often can be extracted from previous stud-ies. An additional worry that has been expressed, is that the choice of prognostic variables as covariates in the analysis model can influence the results [7]. There are situations where adjusting for one prognostic factor might result in a statistically significant finding while adjusting for a different one would not, as was illustrated in our example. Some authors might in those cases be tempted to specifically adjust for those covariates that lead to statistically significant results which they subse-quently report in their papers. We agree that this can pose a problem for a given trial. However, there is a straightforward solution to this problem. Most journals nowadays demand that authors include all primary and secondary endpoints in the protocols submitted to a trial
Table 1 Results from four randomized controlled supermarket trials with different methods of adjustment for baseline covariates(Continued)
Fully adjusted F&V(g) at 1 month 1,290 −1008 3,587 0.27
F&V (g) at 3 months 1,213 −1,078 3,504 0.30
F&V (g) at 6 months 5,556 3,188 7,925 <0.01
F&V (g) at 9 months −1,157 −3,533 1,220 0.34
4. Effects of different discount levels on healthy products coupled with a healthy choice label in a web-based supermarket [13]
25% versus 10% discount on healthy foods
Adjusted for statistically significant characteristics only (= none)
Fruit (g) 398 −384 1,180 0.33*
Vegetables (g) −83 −887 721 <0.01*
Fully adjusted Fruit (g) 393 −442 1,228 0.52*
Vegetables (g) 39 −808 885 0.02*
50% versus 10% discount on healthy foods
Adjusted for statistically significant characteristics only (= none)
Fruit (g) 544 −193 1,280 0.33*
Vegetables (g) 1,108 350 1866 <0.01*
Fully adjusted Fruit (g) 410 −361 1,182 0.52*
Vegetables (g) 1,017 226 1,807 0.02*
Special offer label versus combined label
Adjusted for statistically significant characteristics only (= none)
Fruit (g) 61 −676 797 0.94*
Vegetables (g) −436 −1,193 322 0.52*
Fully adjusted Fruit (g) 74 −704 853 0.78*
Vegetables (g) −479 −1,286 328 0.50*
Healthy choice label versus combined label
Adjusted for statistically significant characteristics only (= none)
Fruit (g) −76 −858 705 0.94*
Vegetables (g) −217 −1,021 587 0.52*
Fully adjusted Fruit (g) −200 −1,014 613 0.78*
Vegetables (g) −282 −1,138 574 0.50*
register. It would be simple to also request mentioning the covariates here. This would also be feasible from a researcher’s perspective, because researchers, naturally, have to take important prognostic factors into consider-ation before starting the trial so that they can assess these variables at baseline. We acknowledge that there are some pitfalls in practice, for example the fact that trial protocols do not have to be registered before the trial starts and others may (therefore) have different views on how to tackle potential problems relating to the (selective) choice of prognostic factors.
Our discussion of the adjustment for baseline variables from RCT´s in the above is limited to direct adjustment of variables in general linear models, i.e. when the out-come is continuous. It should be noted that there are alternative methods of dealing with imbalances between groups such as pre-stratification or minimization, which we will not dwell on any further in this paper. In addition, when outcomes are dichotomous or time to event, i.e. when logistic regression or survival analyses are used, things are more complex. In contrast to mean differences (MD’s), odds ratio’s (OR’s) and hazard ratio’s (HR’s)are non-collapsible effect estimators [18]. This means that for trials on a specific comparison, the crude effect estimate will on average coincide with the adjusted effect estimate when analyzing MD’s, but not when ana-lyzing OR’s or HR’s [6,18]. For these latter effect esti-mates, the crude (also sometimes referred to as marginal or population averaged) effects will be systematically closer to the null value than the adjusted (also some-times referred to as subject specific) effects. This means that crude and adjusted effect estimates have different interpretations when analyzing OR’s or HR’s [6,17]. At the moment there seems to be no consensus as to which estimate (crude or adjusted) is more informative from a clinical or policy perspective [6]. Therefore, we agree with others [6], that especially for binary and time to event outcomes, results from RCT’s should be presented for crude as well as adjusted analyses. In that way, at least the results from the crude analyses regarding trials on similar comparisons are comparable.
Summary
We have discussed that testing for baseline differences serves no purpose and can be misleading, especially be-cause some researchers still think that these tests are the basis for choosing covariates in their analyses. This prac-tice however ignores the prognostic strength of covari-ates, which is a more important characteristic to take into account, because adjustment for prognostic factors can also increase precision of effect estimates. We have shown in our data from four supermarket trials that the choice of covariates is not a trivial matter and that effect estimates could appreciably differ between strategies. We
therefore propose to include and register covariates in trial protocols, to register these protocols before the start of the trial and to publish fully adjusted as well as crude analyses results. Finally, based on these arguments, we propose that journals in and outside the field of nutrition behavior ac-tively adopt the CONSORT 2010 statement on this topic by not publishing these tests anymore.
Competing interests
The authors declare that they have no competing interests.
Authors’contributions
MRdB conceived of the idea for this paper in cooperation with all co-authors, analyzed the data and drafted the manuscript. WEW, LDJK, IHMS and JWRT revised the manuscript critically for important intellectual content. All authors approved the final version of the manuscript.
Author details
1Department of Health Sciences and the EMGO Institute for Health and Care Research, Faculty of Earth and Life Sciences, VU University Amsterdam, De Boelelaan 1085, 1081 HV Amsterdam, The Netherlands.2National Institute for Health Innovation, School of Population Health, The University of Auckland, Tamaki Campus, Private Bag 92019, Auckland Mail Centre, Auckland 1142, New Zealand.3Department of Epidemiology and Biostatistics, VU University Medical Centre, de Boelelaan 1118, Amsterdam 1081 HV, The Netherlands.
Received: 22 August 2014 Accepted: 6 January 2015
References
1. Moher D, Hopewell S, Schulz KF, Montori V, Gøtzsche PC, Devereaux PJ, et al. CONSORT 2010 Explanation and Elaboration: Updated guidelines for reporting parallel group randomised trials. J Clin Epidemiol. 2010;2010(63):e1–37. 2. Altman DG. Comparability of randomised groups. J R Stat Soc. 1985;34:125–36. 3. Rothman KJ. Epidemiologic methods in clinical trials. Cancer.
1977;39(4 Suppl):1771–5.
4. Senn S. Controversies concerning randomization and additivity in clinical trials. Stat Med. 2004;23:3729–53.
5. Assmann SF, Pocock SJ, Enos LE, Kasten LE. Subgroup analysis and other (mis)uses of baseline data in clinical trials. Lancet. 2000;355:1064–9. 6. Austin PC, Manca A, Zwarenstein M, Juurlink DN, Stanbrook MB. A
substantial and confusing variation exists in handling of baseline covariates in randomized controlled trials: a review of trials published in leading medical journals. J Clin Epidemiol. 2010;63:142–53.
7. Pocock SJ, Assmann SE, Enos LE, Kasten LE. Subgroup analysis, covariate adjustment and baseline comparisons in clinical trial reporting: current practice and problems. Stat Med. 2002;21:2917–30.
8. Lavori P, Louis T, Bailar III J, Polansky M. Designs for expirements-parallel comparisons of treatment. N Engl J Med. 1983;309:1291–8.
9. Altman, Douglas G, Doré CJ. Randomisation and baseline comparisons. Lancet. 1990;335:149–53.
10. Waterlander WE, Steenhuis IHM, de Boer MR, Schuit AJ, Seidell JC. The effects of a 25% discount on fruits and vegetables: results of a randomized trial in a three-dimensional web-based supermarket. Int J Behav Nutr Phys Act. 2012;9:11.
11. Waterlander WE, Steenhuis IHM, de Boer MR, Schuit AJ, Seidell JC. Introducing taxes, subsidies or both: the effects of various food pricing strategies in a web-based supermarket randomized trial. Prev Med. 2012;54:323–30.
12. Waterlander WE, de Boer MR, Schuit AJ, Seidell JC, Steenhuis IHM. Price discounts significantly enhance fruit and vegetable purchases when combined with nutrition education: a randomized controlled supermarket trial. J Clin Nutr. 2013;97(4):886–95.
13. Waterlander WE, Steenhuis IHM, de Boer MR, Schuit AJ, Seidell JC. Effects of different discount levels on healthy products coupled with a healthy choice label, special offer label or both: results from a web-based supermarket experiment. Int J Behav Nutr Phys Act. 2013;10:59.
15. Ciolino JD, Martin RH, Zhao W, Hill MD, Jauch EC, Palesch YY. Measuring continuous baseline covariate imbalances in clinical trial data. Stat Methods Med Res. in press.
16. Tabachnick BG, Fidell LS. Using Multivariate Statistics. 5th ed. Boston: Pearson; 2013.
17. Hauck WW, Anderson S, Marcus SM. Should we adjust for covariates in nonlinear regression analyses of randomized trials? Control Clin Trials. 1998;19:249–56.
18. Greenland S, Robins J, Pearl J. Confounding and collapsibility in causal inference. Stat Sci. 1999;14:29–46.
Submit your next manuscript to BioMed Central and take full advantage of:
• Convenient online submission
• Thorough peer review
• No space constraints or color figure charges
• Immediate publication on acceptance
• Inclusion in PubMed, CAS, Scopus and Google Scholar
• Research which is freely available for redistribution