Open Access
International Journal of Health Geographics 2002,
1 x
Methodology
A simple method for serving Web hypermaps with dynamic
database drill-down
Maged N Kamel Boulos*, Abdul V Roudsari and Ewart R Carson
Address: Centre for Measurement and Information in Medicine, School of Informatics, City University, London EC1V 0HB, UK
E-mail: Maged Boulos* - [email protected]; Abdul V Roudsari - [email protected]; Ewart R Carson - [email protected] *Corresponding author
Abstract
Background: HealthCyberMap [http://healthcybermap.semanticweb.org] aims at mapping parts of health information cyberspace in novel ways to deliver a semantically superior user experience. This is achieved through "intelligent" categorisation and interactive hypermedia visualisation of health resources using metadata, clinical codes and GIS. HealthCyberMap is an ArcView 3.1 project. WebView, the Internet extension to ArcView, publishes HealthCyberMap ArcView Views as Web client-side imagemaps. The basic WebView set-up does not support any GIS database connection, and published Web maps become disconnected from the original project. A dedicated Internet map server would be the best way to serve HealthCyberMap database-driven interactive Web maps, but is an expensive and complex solution to acquire, run and maintain. This paper describes HealthCyberMap simple, low-cost method for "patching" WebView to serve hypermaps with dynamic database drill-down functionality on the Web.
Results: The proposed solution is currently used for publishing HealthCyberMap GIS-generated navigational information maps on the Web while maintaining their links with the underlying resource metadata base.
Conclusion: The authors believe their map serving approach as adopted in HealthCyberMap has been very successful, especially in cases when only map attribute data change without a corresponding effect on map appearance. It should be also possible to use the same solution to publish other interactive GIS-driven maps on the Web, e.g., maps of real world health problems.
Background
HealthCyberMap (HCM – [http://healthcybermap.se-manticweb.org]) is a Web-based service that aims at map-ping parts of medical/health information resources in cyberspace in novel semantic ways to improve their re-trieval and navigation. This is achieved through intelligent categorisation and interactive hypermedia visualisation of the medical/health information cyberspace using
metada-ta (information about information resources), clinical codes (to describe resource topics) and GIS (Geographic Information Systems) technologies. HCM pilot currently provides six different interfaces to its metadata base, which has over 1600 resource records in it. Some of these interfaces are visual (maps – Figure 1), while others are textual (list of topical categories and a semantic subject search engine).
Published: 9 August 2002
International Journal of Health Geographics 2002, 1:1
Received: 11 July 2002 Accepted: 9 August 2002 This article is available from: http://www.ij-healthgeographics.com/content/1/1/1
HCM features a novel and unconventional use of GIS to map conceptual spaces occupied by collections of medi-cal/health information resources. Besides mapping the ge-ographical provenance of these resources, HCM also collects and maps some non-geographical and semantic aspects of these resources (e.g., clinical subject or topic) using suitable metaphors like human body organs/sys-tems maps. The resultant maps are conceptual informa-tion space maps used as a visual navigainforma-tional aid for browsing mapped resources.
From desktop GIS to the Web
Old [1] describes two main steps when using GIS to map conceptual information spaces (as in HCM):
- First, information in non-spatial data is spatialised, ana-lysed, browsed, and processed using (desktop) GIS and cartographic methods; then
- The resultant information maps and their connections to the underlying data are shared on the Web as sensitive clickable maps for Internet browsing and navigation of mapped spaces.
Figure 1
This paper focuses on the second step in this process. Two main options exist to deliver this step:
- Dynamic publishing to the Web using a dedicated Inter-net map server that maintains a live connection with the underlying GIS project/database; or
- Publishing a static snapshot of the project (representing the project's maps and underlying data at time of publish-ing) as clickable client-side imagemaps using tools like ImageMapper from alta4, Germany [http:// www.alta4.com/eng/products_e/im/im30/index_e.htm] and WebView from Zebris, Germany [http://www.ze-bris.com/english/main_webview.htm]. (HCM method is a modified version of this option to partially compensate for its limitations as shall be described below.)
Dedicated internet map server solutions for serving maps with dynamic database drill-down functionality
Advanced mapping applications running on the server side can be linked to the server software, e.g., using CGI (Common Gateway Interface). These applications can be used to provide live database access (browsing/querying a map database on the server). Using a dedicated map serv-er, users could get a map depicting the latest figures from a database, which can come from another remote server, visualised with the colours and classification the user has requested (Figure 2) [2,3].
ESRI Internet Map Server solutions allow for an existing ArcView project to be transparently ported to the Web with minimal effort (updates carried on the original project in ArcView will also show automatically in real time in the Web front-end). Almost all major GIS vendors have already done this and although their approaches dif-fer in detail, most use a combination of server-side and cli-ent-side components. In one typical ESRI set-up, the ArcView GIS program takes on a role "similar to conven-tional CGI applications" running on the server. An ArcView extension, called Internet Map Server (IMS), is in-stalled to receive commands from the Web browser via the Web server. A command can be for example a map query. It will be passed to and processed by ArcView GIS and the result (a map view) will be converted to a GIF (Graphic In-terchange Format) or JPEG (Joint Photographic Experts Group Format) file and sent to the browser. A Java applet called MapCafe is used to implement in the Web browser an interface similar to the standard ArcView GIS interface (Figure 3). Users can for example click the zoom button and drag a rectangle on the map displayed by the applet. This would result in the applet building a command to implement the required zoom action (IMS will receive this command and hand it to ArcView). The last item in this set-up is a plug-in to the Web server software called es-rimap.dll that enables the server to find the appropriate ArcView GIS application to handle the request. ArcView
Figure 2
Screenshot of the National Atlas of Canada online Screenshot of the National Atlas of Canada online [http:// atlas.gc.ca/] which uses ESRI Map Server technologies [3]
Figure 3
GIS can be run on another computer to decrease server load and the server plug-in can even distribute requests among a multitude of computers running the same ArcView application. The Java applet can be customised and the IMS can handle all functionality within ArcView, including its built-in scripting language. This makes the system very flexible but also expensive and more difficult to set-up and run [2,4].
ESRI Internet Map Server allows users to easily look up places on the map, e.g., by typing the names of the places they want to locate on the map. However, typing errors and disagreement about correct spelling of map features can severely limit the usefulness of such feature [2].
Costs associated with dedicated internet map servers
Unfortunately, all these excellent features of dedicated In-ternet map server solutions do come at a cost:
- Price (several thousands of US dollars);
- Expertise is required to install, customise and manage the Internet map server;
- Full access to the hosting Web server is required to install and manage software components (not always possible with mainstream (cheap) shared virtual hosting packages offered by most Web Hosting Providers; for example, HCM current Web hosting package does not allow full ac-cess to the hosting server to install extra software); and
- ESRI MapCafe Java applet might be slow to download (depending on speed of client's Internet connection).
This paper describes a simple, low-cost way that has been developed for HCM to serve hypermaps with dynamic da-tabase drill-down functionality (dynamic dada-tabase links) without the need for a dedicated Internet Map Server.
Methods
HCM has been developed as an ArcView GIS project and features GIS-driven spatialisation based on an underlying resource metadata base where ICD-9-CM codes (WHO In-ternational Classification of Diseases, ninth revision, US Clinical Modification) describing the topics of mapped re-sources are stored alongside other useful information about theses resources, including their geographic prove-nance and Web addresses [5]. We used ESRI ArcView GIS Version 3.1 for Windows [http://www.esri.com]. Web-View 1.1, the Internet extension to ArcWeb-View GIS, was then used to translate HCM Views (maps) from ArcView to the Web in the form of client-side imagemaps in JPEG format. The authors also used another ArcView extension in HCM project, namely BodyViewer v2.1 for ICD-9 codes from
GeoHealth, Inc. to generate HCM human body maps (see below).
WebView features
WebView was developed by Thomas Zerweck at ZEBRIS in Munich, Germany ( [http://www.zebris.com/] – [6]). It was programmed in Avenue (an ArcView scripting lan-guage), HTML (HyperText Markup Language – for the Web templates) and JavaScript (to add additional interac-tive functionality to its client-side Web maps). It is much cheaper compared to a dedicated ESRI Internet Map Serv-er solution, though not as powServ-erful as the lattServ-er.
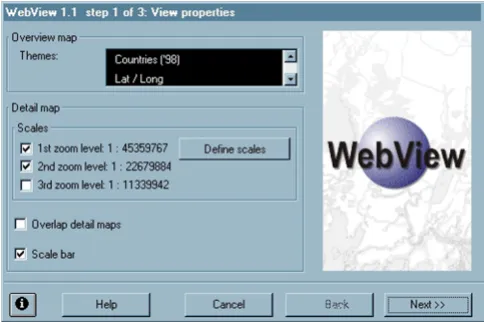
A WebView wizard leads users through the necessary steps in ArcView GIS and creates the project's Web pages (based on the active view in ArcView at the time the wizard is launched – Figures 4, 5 and 6). These pages can then be edited manually if necessary in any HTML editor. The cre-ated map pages and interface can provide the following functionality [6]:
- Detail and overview maps (Figure 1 above). The detail map displays all visible themes of the active view in the chosen scales; it only displays part (one tile) of the whole view area at a time. The overview map displays the over-view themes of the whole area at once in miniature form. A red positional rectangle moves over the overview map to show the location of the area currently displayed in the detail map. Users can also navigate to a different area in the detail map by clicking in the overview map.
- Panning in the detail map is also possible using four ar-row buttons for the four directions (up, down, right, left).
Figure 4
- Legend for map contents.
- Scale bar.
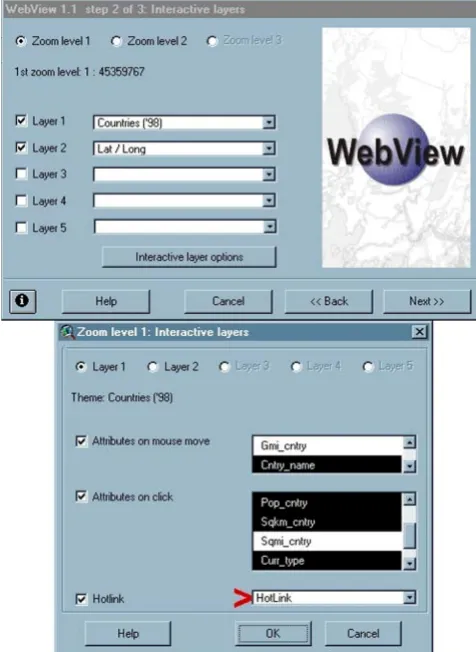
- WebView offers three-way hotspots with two-way clicks depending on which toolbar button (Identify button with a blue 'i' icon or HotLink button with a yellow spark icon) is selected when the user clicks a map object:
- attribute information can be displayed on mouse over (map feature ToolTip, e.g., in HCM maps, country name or body organ/system name);
- other attribute information can be displayed on mouse click while the Identify button is selected, e.g., to display more country information in a message box based on one or more attribute fields (Figure 23 below); and
- mouse clicks while the HotLink button is selected can be associated with an image, video, sound file, Web page or email address. (In HCM, we associated them with data-base query pages to be executed on HCM Web server.)
- Zoom in and zoom out in the detail map (up to three zoom levels in WebView 1.1).
- Up to five themes can be selected as interactive layers for each of the three zoom levels; attributes of these themes can be associated with the different mouse events out-lined above (Figure 5). Different themes (layers) can be associated with the different zoom levels. This allows for different map contents and detail at different zoom levels (scales). This zooming strategy is called static stepped zooming.
Version 2.1 of WebView provides additional features (not available in WebView v1.1). These include five zoom lev-els, transparent layers (users can switch layers
visible/in-Figure 5
Step 2 of WebView 1.1 wizard in ArcView Step 2 of WebView 1.1 wizard in ArcView. Up to five themes can be selected as interactive layers for each zoom level; attributes of these themes can be associated with the different mouse events (on mouse move, on click/Identify, and on click/Hot-Link). Different themes can be associated with the different zoom levels. The (red) arrow points to the HotLink attribute, a field the authors added to the table of "Countries ('98)" theme in ArcView (see later). It stores Web addresses of database query pages on HCM server.
Figure 6
visible) and object layers (Figure 7). The latter provides a client-side map feature lookup functionality "similar" to, though not as powerful or sophisticated as that provided by dedicated map servers. Developers select up to two themes as object layers. An object layer is a theme, in which the user may search for certain attribute value. The attribute values are listed in a combo box, e.g., a list of country names as in the screenshot above. Selecting a country from the list, will cause the detail map (on the left) to zoom to that country and mark its exact position on the map (Figure 7) [6].
WebView limitations
Although it saves users the trouble of setting-up and run-ning more complex Internet Map Server software while of-fering similar user interface features, the basic WebView set-up does not support any real GIS database drill-down
functionality (the generated maps cannot communicate with the corresponding underlying databases). Moreover, projects published by WebView on the Web are uncou-pled or disconnected from the original corresponding projects in ArcView.
"Patching" the basic WebView set-up
In HCM, the authors developed their own (partial) work-arounds for these limitations of WebView (Figure 8). This solution makes use of WebView HotLink functionality to implement a dynamic database drill-down that will al-ways reflect the latest updates to this database. By clicking different hotspots on the client-side imagemaps in HCM, users are actually triggering server-side pre-formulated SQL (Structured Query Language) queries against an un-derlying database of resource metadata. The database is registered on HCM server (a Windows 2000/NT 5 IIS Serv-er – Microsoft IntServ-ernet Information SServ-ervServ-er/SServ-ervices) as an ODBC (Open DataBase Connectivity) Data Source (Fig-ure 9) and is the same database we are connecting to in ArcView. We coded the SQL queries in ASP (Active Server Pages) pages for execution on the server. The ASP pages turned to users in their browsers only contain query re-sults in the form of formatted HTML. The actual SQL and ASP code as found in the ASP pages stored on the server is never sent to the end user.
HCM metadata base (based on Dublin Core metadata set)
Candidate Internet resources are hand-selected (to ensure quality). Their attributes, including Web address and ICD-9-CM codes representing their subjects, are compiled in
Figure 7
Screenshot of WebView v2.1 Screenshot of WebView v2.1.
Figure 8
HCM metadata base based on the Dublin Core (DC – [ht-tp://www.dublincore.org/]) metadata set scheme with HCM own extensions for resource quality and geographi-cal provenance.
HCM allows for three DC subject fields per resource record permitting up to three ICD-9-CM codes to be used to un-ambiguously describe the topic(s) of each selected re-source.
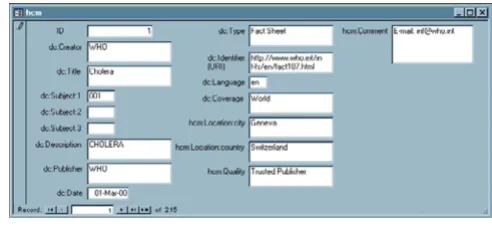
The resource metadata base was implemented in Micro-soft® Access (Figure 10). We used ArcView "SQL Connect"
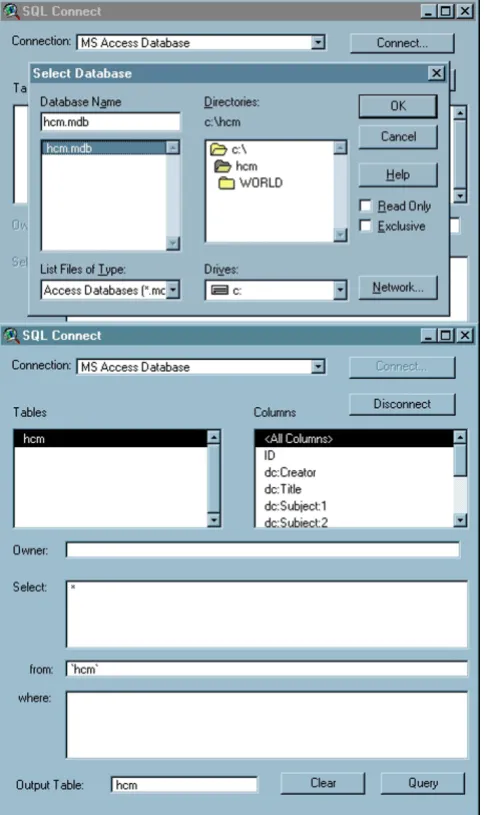
feature to connect to HCM metadata base and import all fields and records from it into an ArcView table that will refresh each time the project is opened in ArcView (Fig-ures 11 and 12). This is the same database currently regis-tered on HCM server as an ODBC Data Source (Figure 9 above), which users query by clicking the hypermaps.
Using ArcView's BodyViewer extension
BodyViewer is an ArcView GIS extension from GeoHealth, Inc. [http://www.geohealth.com/] that combines the power of GIS with computerised body organ system dia-grams. It lets users see where their ICD-coded healthcare data (medical/health Internet resources in our case) map onto the human body based on the body region(s) they cover [7].
We used this extension to generate the human body topi-cal maps in HCM. These maps allow the navigation of re-sources by body location/system according to ICD-9-CM. In BodyViewer human body maps, map symbols are min-iature simplified drawings or icons of the different body organs and systems. They act as visual labels to the different resource categories that have been classified and mapped according to their DC subject fields (ICD-9 codes). These icons (on the corresponding Web hypermaps) are linked to respective ASP query pages that are executed on HCM Web server to retrieve the appropriate resources based on the ICD-9 codes represented by the clicked icon. For ex-ample, if the cardiovascular icon is clicked, a query will be launched to retrieve resources with cardiovascular ICD-9 codes. Our bibliographic/cybergraphic use of this exten-sion to map ICD-coded medical/health Internet resources is the first of its kind and was never suggested in Body-Viewer documentation by GeoHealth, Inc. (the manufac-turer of BodyViewer).
We used BodyViewer "Setup Wizard" to map the Internet resources listed in HCM onto the human body (Figures 13 and 14). These resources have been indexed in the meta-data base that we imported into ArcView in the previous step (see Figure 12 above). The mapping is based on the three ICD-9 fields in the imported table. BodyViewer can aggregate more than one ICD-9 code field at a time, and so was able to use all three DC subject fields in HCM meta-data table combined to compute resource counts by clini-cal subject category/body region. BodyViewer classifies
Figure 9
Screenshot of HCM Web Server Control Panel Screenshot of HCM Web Server Control Panel (only accessi-ble by server administrator). The same Microsoft® Access
database we are connecting to in ArcView (HCM.MDB) is shown registered on HCM server (a Windows 2000/NT 5 IIS Server) as an ODBC Data Source.
Figure 10
HCM resource metadata entry form in Microsoft®
resource counts per body region into ranges and associ-ates each range with a colour shade or tint, i.e., a chorop-leth rendition (darker colours meaning more resources). This allows us to visually spot infogaps (topical coverage gaps) and infoclusters. (Infogaps can be also due to insuffi-cient indexing by HCM.)
In ArcView, BodyViewer views are not hot-linked to the underlying resource metadata table (within ArcView) until we perform what is called "Link Patients" in BodyViewer, though in this case we will be linking resources not pa-tients. Although BodyViewer was able to aggregate three
ICD fields in the previous step, the linking can only be done using one DC subject field at a time (Figure 15). The result of the linking in ArcView is shown in Figure 16. In this regard, the corresponding HCM human body maps on the Web are superior since the linking query (running on HCM Web server) looks in all three DC subject fields in the underlying metadata base. To export BodyViewer maps (views) to the Web using WebView, we have to first select
Figure 11
Screenshot of ArcView "SQL Connect" dialogue box Screenshot of ArcView "SQL Connect" dialogue box. The authors established a connection to HCM metadata base (MS Access) and created an ArcView table ("hcm") containing all fields (and records) from the input Microsoft® Access table.
Figure 12
HCM metadata base as a table in ArcView HCM meta-data base as a table in ArcView.
Figure 13
a Map Unit ("meters") for the view or else WebView will not be able to determine a scale for rendering the detail map and will abort the process (Figure 17). We inserted a HotLink field in BodyViewer map tables to store the Web addresses of corresponding ASP query pages that will run on HCM Web server; this field is associated with the Hot-Link mouse event feature of WebView (Figure 18).
HCM World map in ArcView
The authors used the basic World map dataset that ships with ArcView GIS 3.1 as a project example (world.apr), and added a HotLink field to the "Countries ('98)" table (Figures 19 and 20). This field was associated with the HotLink mouse event in WebView wizard when the au-thors generated HCM World Map for the Web. Clicking a country on HCM World Map (on the Web) will launch the appropriate country query to retrieve only those resources authored in and/or published in the clicked country. Que-ry results will always reflect the latest updates carried on the metadata base without the need to change any code.
It is also possible to join the resource metadata and World Countries tables (within ArcView) based on the values of a common field (country names – Figure 21). This kind of functionality is not possible with WebView.
Results and Discussion
HCM Web Interface
(Only components generated using the "patched" Web-View method are described below.)
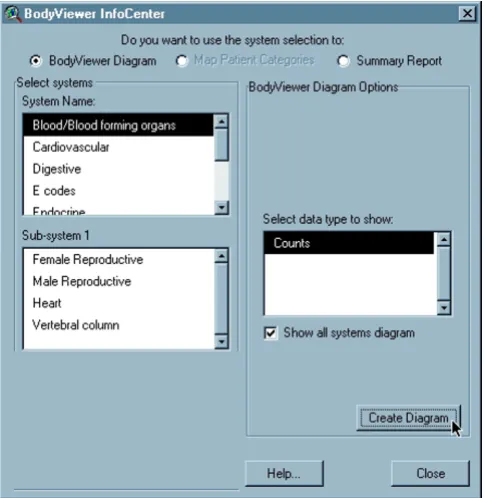
Figure 14
Screenshot of the final step in BodyViewer "Setup Wizard" Screenshot of the final step in BodyViewer "Setup Wizard". Clicking the "Create Diagram" button will generate an "all systems" human body choropleth map showing resource counts in different organ systems. If "Show all sys-tems diagram" is unchecked, a more detailed human body map will be created for (only) the system or sub-system whose name is selected in one of the two list boxes on the left.
Figure 15
BodyViewer linking to resources within ArcView Bod-yViewer linking of its views to the underlying resource meta-data table within ArcView GIS can only be done using one DC subject field at a time. In this regard, the corresponding HCM human body maps on the Web are superior since the linking query looks in all three DC subject fields in the under-lying metadata base (see below).
Figure 16
HCM BodyViewer maps are available on the Web at the following address: [http://healthcybermap.seman-ticweb.org/bodyviewer] (Figure 22). These human body topical maps can be used to visually browse selected med-ical/health resources on the Web by clinical subject ac-cording to ICD-9-CM classification.
Clicking a human body icon on these maps triggers a serv-er-side dynamic query. This is for example the pre-formu-lated SQL query that currently runs on HCM server in real-time to retrieve resources having E codes (codes for Exter-nal Causes of Injury and Poisoning) in any of their DC subject fields [http://healthcybermap.semanticweb.org/
Figure 17
Selecting a Map Unit for a BodyViewer view in ArcView Selecting a Map Unit ("meters" in this screenshot) for a BodyViewer view in ArcView. This is necessary for the successful execution of WebView.
Figure 18
The HotLink field in a BodyViewer table in ArcView Screenshot showing the HotLink field that has been added to the underlying table of a BodyViewer view in ArcView.
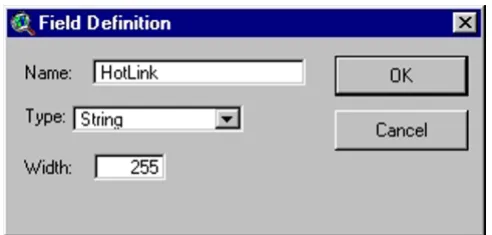
Figure 19
Screenshot of ArcView "Field Definition" dialogue box Screenshot of ArcView "Field Definition" dialogue box which is used to add a new field to an existing table and define its properties. In this screenshot, the properties of the HotLink field are shown. The field is defined as "String." It can hold up to 255 character (the maximum allowed for this type in ArcView) and is used to store Internet addresses (URIs).
Figure 20
The HotLink field in the "Countries ('98)" table in ArcView Screenshot of the "Countries ('98)" table in ArcView showing the inserted HotLink field that stores the addresses of the "resources by country" ASP query pages on HCM server.
Figure 21
bodyviewer/e-codes.asp] – see Example ASP page from HCM in "Additional file" for full code of this page):
sql = "SELECT hcm. [dc:Creator], hcm. [dc:Title],
hcm. [dc:Subject:1], hcm. [dc:Subject:2], hcm. [dc:Sub-ject:3],
hcm. [dc:Description], hcm. [dc:Publisher], hcm. [dc:Date],
hcm. [dc:Type], hcm. [dc:Identifier], hcm. [dc:Language],
hcm. [dc:Coverage], hcm. [hcm:Location:city],
hcm. [hcm:Location:country], hcm. [hcm:Quality], hcm. [hcm:Comment] FROM hcm WHERE (((hcm. [ dc:Sub-ject:1]) Like 'E%')) OR (((hcm. [dc:Subject:2]) Like 'E%')) OR (((hcm. [dc:Subject:3]) Like 'E%'))"
All three DC subject fields in each resource record are searched for matching ICD-9-CM codes.
HCM World Map Web interface is available on the Web at the following address: [http://healthcybermap.seman-ticweb.org/world_map/] (Figures 1 and 23). The maps can be used to browse Web resources by country of prov-enance.
Online Help is available for both BodyViewer and World Map Web interfaces. Clicking the green question mark '?' button in Figures 22 and 23 above will display Help in-structions in a separate pop-up window (Figure 24).
Maintenance of HCM Web maps
Since WebView does not allow the dynamic generation of Web maps from ArcView, some of HCM Web maps will ultimately need to be manually regenerated using Web-View when the underlying data change if this change has implications on the maps' appearance. In cases when only map attribute data change without a corresponding effect on map appearance, e.g., updating the address of a Web resource in the metadata base, nothing needs to be done;
Figure 22
Screenshot of HCM BodyViewer Maps on the Web Screenshot of HCM BodyViewer Maps on the Web [http:// healthcybermap.semanticweb.org/bodyviewer/]. These hier-archical human body topical maps with semantic zoom can be used to visually browse selected health resources on the Web by clinical subject. The resources have been catego-rised and spatialised to the different human body organs on the map according to a clinical coding scheme.
Figure 23
the same ASP query pages (unmodified) will retrieve the latest updates. HCM GIS-generated Web maps can be grouped into:
- Choropleth maps that need to be regenerated when the underlying data are updated, e.g., the BodyViewer maps as the colour shades of the various body organ systems in these maps reflect the number of resources associated with them, and so will change whenever the database is updated (resources added and/or deleted). In this case, the Web maps must recreated in ArcView using WebView then uploaded to the Web server to replace older ones. As-sociated query pages need not be changed.
- Chorochromatic maps that don't usually need to be up-dated, e.g., the world maps. Whenever new resources are added (or existing ones updated/deleted), they will auto-matically appear (or disappear) in the query results when the corresponding countries on the map are clicked. There is no need to change the map as long as the addresses of the dynamic ASP query pages on HCM server don't change (e.g., [http://healthcybermap.semanticweb.org/cana-da.asp]). The only reason to regenerate these maps would be if some of their underlying attribute values that are used with WebView Identify function change, or if the po-litical boundaries between some countries change (which is not very frequent).
Conclusions
In this paper, we have described in detail HCM cost-effec-tive method for serving Web hypermaps with dynamic da-tabase links/drill-down functionality on the Web. The proposed solution is currently used for publishing HCM GIS-generated navigational information maps on the Web while maintaining their links with the underlying re-source metadata base. The authors believe their map serv-ing approach as adopted in HCM has been very successful, especially in cases when only map attribute data change without a corresponding effect on map appearance. How-ever, the main benefits of HCM solution are that it is much cheaper and simpler to deploy and maintain (doesn't need full access to the hosting Web server to in-stall and manage extra software components) compared to a full-fledged Internet mapping server solution. It should be also possible to use the same solution to pub-lish other interactive GIS-driven maps on the Web, e.g., maps of real world health problems.
Authors' contributions
All authors contributed equally to this work.
Acknowledgements
The authors would like to thank Dr. Christopher Austin president of Geo-Health, Inc., USA, who supplied BodyViewer v2.1 Extension Version (ICD-9) free of charge for the purpose of this research.
References
1. Old LJ: Web Access to Non-spatial Data using Internet Map Servers.In: Proceedings of the 21st Annual ESRI International User Con-ference San Diego, California 2001 [http://gis.esri.com/library/user-conf/proc01/professional/papers/pap237/p237.htm]
2. Kraak MJ, Brown A: Web Cartography: Developments and Prospects.London, Taylor & Francis 2001
3. Frappier J, Williams D: An overview of the National Atlas of Canada.In: Proceedings of the 19th International Cartographic Confer-ence ICC99 (Edited by: Keller CP) Ottawa, Canadian Institute of Geomatics
1999, 261-267
4. Environmental Systems Research Institute, Inc. (USA): ArcView In-ternet Map Server Frequently Asked Questions. 2002 [http:// www.esri.com/software/arcview/extensions/imsfaq.html]
5. Kamel Boulos MN, Roudsari AV, Carson ER: A Semantic Visual Browser of Medical Internet Resources Based on Clinical Codes and the Human Body Metaphor.Health Information and Libraries Journal 2002
6. ZEBRIS (München Germany): WebView – The Internet Exten-sion for ArcView GIS [http://www.zebris.com/english/
main_webview.htm]11 July 2002
7. GeoHealth, Inc. (USA): BodyViewer Extension for ArcView GIS
[http://www.geohealth.com/bodyviewer.html]11 July 2002
Figure 24
HCM online Help Window HCM Help Window explain-ing the functions of the different map interface buttons.
![Figure 1Screenshot of HCM World Map Web interface Screenshot of HCM World Map Web interface [http://healthcyber-map.semanticweb.org/world_map/]](https://thumb-us.123doks.com/thumbv2/123dok_us/776968.2073671/2.612.54.554.85.419/figure-screenshot-world-interface-screenshot-interface-healthcyber-semanticweb.webp)
![Figure 3Screenshot from CDC Atlas of Heart Disease Screen-shot from CDC Atlas of Heart Disease [http://gis.cdc.gov/cvd] showing ESRI MapCafe Java applet in action](https://thumb-us.123doks.com/thumbv2/123dok_us/776968.2073671/3.612.55.298.438.662/figure-screenshot-heart-disease-screen-disease-showing-mapcafe.webp)

![Figure 23Screenshot of HCM World Map on the Web showingthe Identify button function Screenshot of HCM WorldMap on the Web [http://healthcybermap.semanticweb.org/world_map/]](https://thumb-us.123doks.com/thumbv2/123dok_us/776968.2073671/11.612.310.553.86.302/screenshot-showingthe-identify-function-screenshot-worldmap-healthcybermap-semanticweb.webp)