Identifying profiles of students’ school
climate perceptions using PISA 2015 data
Anubha Rohatgi
1*and Ronny Scherer
2Introduction
School climate is a widely researched concept in the area of school effectiveness, and various frameworks of the concept testify to researchers’ interest in its conceptualiza-tion and assessment. School climate does not only include the physical aspects of the school, such as the building infrastructure and resources, but also a variety of social interactions and emotional experiences students encounter in schools. Ecological sys-tems theory proposed by Bronfenbrenner (1979) ascertains both home and school as immediate networks, positioning an influence on the growth and learning of children. A multitude of dimensions included in different frameworks thereby include home-school interactions along with peer relations, instructional aspects, and administra-tive factors at different levels in school as descriptors of school climate (Cohen et al. 2009; Thapa et al. 2013; Wang and Degol 2016; Konishi et al. 2017). Elaborating on Bronfenbrenner’s theory, Bradshaw et al. (2009) also substantiated the influence of peer-interactions on individual-level perceptions of school climate in their research. At the class level, teachers play an important part in maintaining classroom disci-pline alongside affirmative teaching and learning experiences (LeBlanc et al. 2007). In
Abstract
The concept of school climate has received much attention as a predictor of educa-tional outcomes, including students’ well-being, academic achievement, and motiva-tion. To measure this concept, international large-scale assessments often rely on stu-dents’ perceptions of its different dimensions, such as their sense of belonging, teacher support, and disciplinary climate. However, students may perceive these dimensions differently and, ultimately, create inter-individual variation—a variation that has been explained only to a limited degree in the current body of literature. The present study explores this variation for the Norwegian PISA 2015 data (N= 5313). Using the person-centered approach of latent profile analysis, we found evidence for the existence of three student profiles: (1) students with consistently positive perceptions, (2) students with moderately negative perceptions, and (3) students with extremely negative per-ceptions, especially concerning teachers’ fairness and bullying. These results support the hypothesis of individual differences in school climate perceptions.
Keywords: School climate, Latent profile analysis, PISA, Science achievement, Achievement motivation
Open Access
© The Author(s) 2020. This article is licensed under a Creative Commons Attribution 4.0 International License, which permits use, sharing, adaptation, distribution and reproduction in any medium or format, as long as you give appropriate credit to the original author(s) and the source, provide a link to the Creative Commons licence, and indicate if changes were made. The images or other third party material in this article are included in the article’s Creative Commons licence, unless indicated otherwise in a credit line to the material. If material is not included in the article’s Creative Commons licence and your intended use is not permitted by statutory regulation or exceeds the permitted use, you will need to obtain permission directly from the copyright holder. To view a copy of this licence, visit http://creat iveco mmons .org/licen ses/by/4.0/.
RESEARCH
sum, concerning the conceptualization of school climate, a strong interdependence between the different contextual levels exists (Creemers et al. 2000). In light of this interdependence, several studies have taken a multilevel approach to the assessment of school climate, including international large-scale assessments in education, such as the Programme for International Student Assessment (PISA), the Trends in Inter-national Mathematics and Science Study (TIMSS), and the Teaching and Learning International Survey (TALIS). These studies assessed teachers’ or principals’ percep-tions next to students’ perceppercep-tions of school climate dimensions (Caponera and
Los-ito 2016; Chirkina and Khavenson 2018). Research reviews on school climate suggest
further work on exploration of contextual characteristics and multilevel dimensions related to the school climate perceptions and in particular the influence of school cli-mate on both student well-being and academic achievement (Wang and Degol 2016; Berkowitz et al. 2017).
Much of the school climate research has focused on the relations between school cli-mate indicators and educational outcomes, taking such a variable-centered approach is based on the assumption that the relations among variables are the same for the popula-tion of students, teachers, or school leaders (Wang and Degol 2016). While this approach provides invaluable information about the interplay and possible effects of school cli-mate indicators and educational success, it ignores the possibility that sub-populations that have not been observed at the outset of a study may exist—these sub-populations are comprised of students, teachers, or school leaders who are homogeneous with respect to a defined set of variables but differ from other sub-populations (Marsh et al. 2009). Latent class and profile analyses provide opportunities to identify the unobserved heterogeneity in the population by grouping persons into different classes or profiles, based on the patterns of observed variables (Nylund-Gibson and Choi 2018; Wang and Hanges 2011). From a substantive perspective, a person-centered approach differentiates between sub-population patterns across the different school climate indicators and may therefore aid the identifying of groups of students who may be at risk (e.g., based on their reports of frequent bullying in school). Besides the identification of such classes or pro-files, the analytic framework of latent class analysis (LCA) for categorical class indicators and latent profile analysis (LPA) for continuous profile indicators allow researchers to examine the extent to which other variables may predict class or profile membership or whether classes or profiles may differ in a distal outcome variable (Vermunt and
Magid-son 2002). Information about both the prediction of class or profile membership and
the relations to other variables may foster the understanding of processes underlying the formation of such latent (unobserved) classes or profiles (Nylund-Gibson and Choi 2018). In our reading of the extent body of research, approaches that are aimed at identi-fying different classes or profiles of students’ perceptions of school climate, on the basis of multiple indicators, and examining the contribution of individual factors (e.g., gender or immigration background) to the forming of such unobserved (latent) groups of stu-dents are (still) limited.
students’ profile membership, and (c) explores the between-profile differences in educa-tional outcomes, including science achievement and achievement motivation.
Our theoretical framework for measuring the dimensions of school climate and its operationalization is based on the framework of the Programme for International Stu-dent Assessment (PISA; OECD 2016a, 2017a). More specifically, this framework com-prises characteristics of the school (learning) environment, parental involvement, and school leadership. For the purpose of this investigation, we focus on the factors related to the school environment, including parental emotional support from the student ques-tionnaire (OECD 2016b; Figure II.301). These factors have been identified as critical ele-ments of the school climate construct and its measurement (e.g., Grazia and Molinari 2020; Ramelow et al. 2015; Thapa et al. 2013; Wang and Degol 2016).
Theoretical background
Conceptualizations and measures of school climate
The influence between the development of social skills of students in their school con-text and their school environment manifests as both unceasing and mutual. Concerns are thereby raised in literature about the bidirectional effects that are responsible for the students’ perceptions of their school climate as student behavioral effects, are in turn, influenced, by their environmental interactions (Bronfenbrenner 1979; Espelage 2014). Within the contexts of the social ecological model, positive student behaviors reinforce a sense of belonging in students whereas misbehaviors adversely influence perception of their school climate. All types of experiences students have in school influence their individual development as well as their group dynamics. It is further argued that there might exist a dichotomy of developmental opportunities in different environments, meaning that some students perceive their school learning environments below a criti-cal limit while the rest perceive them as above the limit (Birkemo 2002). Keeping this sub-grouping in mind, it seems necessary to identify these sub-dimensions and explore the differences between individuals in order to study school climate perceptions more effectively.
At the individual level, the motivation to learn is a strong predictor of students’ school performance (Eccles et al. 1993). In relation to learning outcomes, and proposed frame-works in developmental and motivational theories, associations exist between social relationships, and the motivation to excel in school (Eccles et al. 1993). School climate has also been associated to a Social-Emotional Learning (SEL) perspective with social and emotional competencies forming an integral part of school functioning. Durlak et al. (2011) found support for the links between SEL, better academic performance, social behavior, and emotional well-being.
of individuals supports this belief and emphasizes individual perceptions that con-tribute to the registered school climate awareness. At large, researchers working in the field of school development agree that a supportive academic, psychological and social school environment is conducive for the development of students and a posi-tive school climate stimulates better outcomes and motivation to achieve (Wang and Degol 2016). Background factors such as gender also play a pivotal role in shaping students’ perceptions about their school climate (Thapa et al. 2013).
Current frameworks and models of school climate consistently highlight the rela-tively complex and multidimensional structure of the notion and conceptualize school climate as comprising of both different and somewhat theoretically overlap-ping indicators. In literature, an extensive list of measures related to school climate including student safety, truancy problems, fairness, leniency or strictness of disci-plinary rules/activities, positive and negative interpersonal interactions, students’ sense of belonging or bonding in school, and support for cultural diversity is found among others. Besides these, other indicators such as student and teacher behavior, instructional quality, teacher support, autonomy or student participation in decision-making, instructional improvement, student motivation to achieve, parental involve-ment, professional development and school leadership that reflects the perceptions of the school staff, are also used as measures in studies evaluating school climate (Thapa et al. 2013; Wang and Degol 2016). Overall, school climate represents a multidimen-sional concept comprised of several perspectives and indicators (Cohen et al. 2009; De Pedro et al. 2016; Konishi et al. 2017).
School climate and educational outcomes Academic achievement
There is evidence in educational research that school climate is associated with aca-demic achievement although these claims report mixed results regarding the mecha-nism, intensity of the relationship and the inclusion of different dimensions of school climate (Thapa et al. 2013). More generally, a positive school climate enhances educa-tional outcomes and school connectedness (Bryk et al. 2010) and student well-being. Assertions have also been made that positive school climate moderates the effects of low SES and enhances academic outcomes (Cheema and Kitsantas 2014; Berkowitz et al. 2017). A recent study by Daily et al. (2019) supported the association between school climate and academic achievement—students with higher academic perfor-mance tended to perceive school climate more positively and vice versa. Positive per-ceptions of classroom disciplinary climate in schools was also significantly associated with higher performance in reading, as Ning et al. (2015) found in their study. Student performance is influenced and can be modified by a positive learning environment characterized by compliance of rules leading to emotional and physical safety and positive interpersonal relationships (Cohen and Geier 2010; Cheema and Kitsantas 2014). Others emphasize the importance of student’s feelings of school belonging as potential determinants of accepted social behavior (Morrison et al. 2013).
Achievement motivation
Motivations—as indicated by students’ expectations of success and self-beliefs—are significant predictors of students’ performance (e.g., Wigfield and Eccles 2000). All individuals have a desire to be successful and achieve their goals, although the degree of this need for achievement and success may vary depending on personal experi-ences that are reinforced by both intrinsic and extrinsic factors, such as good grades or praise from teachers and parents (Eccles and Wigfield 2002). Achievement motiva-tion drives students to compete with their peers, but also to compete with themselves by raising their own efforts and expectations (Elliot and McGregor 2001).
Studies underline the importance of school climate for student motivation (Wang and Degol 2016). This relation, however, can be subject to gender differences (Sortkær and Reimer 2018). Moreover, boys and girls may rate their achievement motivation and the instructional quality in classrooms differently and may respond differentially to receiving feedback (Havnes et al. 2012). Other studies emphasize the importance of students’ feelings of school belonging as potential determinants of accepted social behavior (Morrison et al. 2013). Students who feel secure and get support and care from their fellow students, are more likely to perform better (Osterman 2000) and are less likely to engage in negative behaviors (Currie et al. 2009).
their study that peer support, discipline, fairness, clarity of rules, and school safety are significant predictors when it comes to bullying and its negative outcomes.
Both parents and teachers contribute to the way students perceive school climate and their sense of belonging. Perception of how interested parents are in school activi-ties, influences student performance (Wentzel et al. 2016) and the association between parental involvement and academic achievement is found to be positive (Hill and Tyson 2009). Emotional support from parents by showing interest and encouragement (Avvi-sati et al. 2013) influences children’s sense of emotional well-being and reduces anxiety (Leung et al. 2010), while a lack of parental support is connected to emotional distress (Davidov and Grusec 2006). Students’ well-being may be affected negatively when they have a weak sense of belonging resulting in stress, truancy, and school drop-out (Sánchez et al. 2005). Truancy (i.e., skipping classes or school day) and disruptive occurrences that interrupt instruction time are associated with lower school outcomes (OECD 2017a).
Supportive teacher-student relationships where trust is an important attribute pro-vides increased security and well-being leading to enhanced learning outcomes (Hattie 2013). Contrarily, unfair treatment by teachers reinforces feelings of bias and students have lower levels of achievement (Deal and Peterson 2016). Findings from other studies accentuate positive associations between self-reported perceptions of school climate by middle school students and their school satisfaction (Way et al. 2007).
As a safety problem, bullying was shown to affect not only students’ sense of belonging and security in school but also their general well-being and academic performance (e.g., Chrysanthou and Vasilakis 2019; Ladd et al. 2017; Woods and Wolke 2004). Victims of bullying oftentimes suffer psychological harm long after the bullying stops whereas bul-lies often show increased levels of criminal behaviour as adults (Olweus 1994; Olweus and Breivik 2017). In the Trends in International Mathematics and Science Study (TIMSS) 2015, three percent of lower secondary school students respond to being bul-lied weekly, whereas seven percent reported low sense of belonging at school (Nilsen 2016). Another recently conducted research on bullying in a student survey adminis-tered in Norway for the year 2018–2019 showed that 7.1% of grade-10 students reported experiences of bullying (including digital bullying and bullying by adults) two to three times a month or often (Utdanningsdirektoratet 2020).
School climate in international large‑scale assessments (ILSAs)
Students’ perceptions of their school climate are also in focus in ILSAs. The PISA study examines different aspects of three main dimensions: school climate, parental involve-ment and school leadership, as part of the school learning environinvolve-ment (OECD 2016b). Two new measures were added to the learning environment in PISA 2015: students’ perceptions about bullying by peers and unfair treatment by teachers. Both these meas-ures are relevant across cultmeas-ures and are noticed as highly important for both policy and pedagogical perspectives (Wang et al. 2013). In addition, students’ socio-emotional out-comes (well-being) representing dimensions such as sense of belonging, integration in school, self-efficacy and career ambitions are also measured (OECD 2017b).
TIMSS is expressed through the School Emphasis on Academic Success (SEAS) scale and covers teachers’ expectations for students’ success and the schools’ trust in stu-dents and parents (Mullis et al. 2016). Both PISA 2015 and TIMSS 2015 studies credit a healthy disciplinary climate for improved science achievement (Kjærnsli and Rohatgi 2016; Scherer and Nilsen 2016). Furthermore, performance at school is positively related to both achievement motivation and to life satisfaction. (OECD 2017a).
The present study
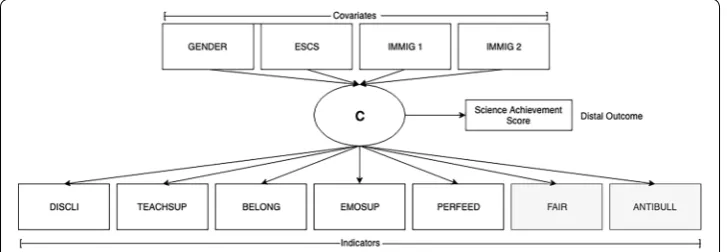
The extant literature supports the claim that the perceptions of school climate is asso-ciated with a student’s achievement in school. This overall relation, however, considers neither the multidimensional nature of school climate (i.e., variable-centered perspec-tive), nor individual students’ differences in their perceptions across the multiple dimen-sions of school climate (i.e., person-centered perspective). Information about the latter is critical to identifying possible subgroups of students that may not be directly observable. In other words, students’ perceptions of the multiple school-climate dimensions provide observable information that can be aggregated to the sample level and evaluated across observable groups of students, such as gender, age, or socioeconomic groups. However, some students may be more homogeneous in these perceptions than others and, ulti-mately, form subgroups that are “unobserved or hidden in the sample” (i.e., latent). To identify these subgroups, we performed latent profile analysis (LPA)—a person-centered approach using a categorical latent variable that groups students based on continuous indicator variables. The full model of latent profile analysis with science achievement score as a distal outcome and students’ background variables as covariates is shown in Fig. 1.
In this study, we focus on students’ perceptions of school climate from an individual-differences perspective rather than on school-level aggregated climate perceptions, although we account for the nesting of students in schools in all statistical analyses. This perspective consequently results in profiles of individual students, yet not profiles of schools. Overall, we approached three research questions (RQs):
RQ1. How many latent profiles of students’ perceptions of school climate exist, and what characterizes them? (Identification of latent profiles).
RQ2. Which student characteristics (gender, socioeconomic and immigration status) predict the assignment of students to these profiles? (Explanatory variables of latent profiles).
RQ3. To what extent do the students in the latent profiles differ in their science achievement and general achievement motivation? (Relations to educational out-comes).
Method
Programme for International Student Assessment (PISA) 2015
PISA evaluates the cognitive ability of 15-years old in reading, mathematics and sci-ence literacies in a 3-year cycle besides gathering information on various individual- and school-level characteristics through student and school questionnaires. In 2015, PISA focused on the domain of science as it had done in 2006. The scientific literacy achieve-ment scores are reported as ten plausible values for each student (for more details about the plausible-value technique, please refer to OECD 2017b). The background question-naire was a part of the online test and responses are initially recorded as frequencies: constructed scales describe the performance of students where indices formed char-acterize student perceptions and beliefs. Students with negative scores are those who respond less positively than the average response across OECD countries and vice versa (OECD 2016b). Both the OECD and the national institutions administering PISA 2015 ensured the accordance with the human subject research guidelines and approval (OECD 2017b). The PISA 2015 Science data are publicly available and can be accessed through the OECD database (https ://www.oecd.org/pisa/data/2015d ataba se/).
PISA reports science achievement using ten plausible values (PV1SCIE to PV10SCIE) for each student. The science test contains tasks within several science areas, such as health and disease, environmental quality, hazards, frontiers of science and technology. The three competence areas comprise explaining phenomena scientifically, interpreting data and evidence scientifically, and evaluating and designing scientific enquiry. For a detailed overview of the scientific literacy assessment framework, we kindly refer read-ers to OECD (2016b).
Sample
Data for the current study comes from the Norwegian PISA 2015 data set comprising of 5456 students, enrolled in 241 schools. As PISA uses an age-based target population, majority of these students attended grade 10 and only less than 1% were grade 9 stu-dents. In total, the data obtained from 143 students were excluded as they contained missing values on all variables under consideration in this study. Hence, a final sample of N = 5313 students (including 50.2% girls) was included in the analyses.
Measures
Table 1 M easur es of studen ts ’ p er ceiv ed scho ol clima te and out come v
ariables used in the pr
esen
t study (see OECD
2016a , 2017b ) Variable # I tems It
em stimulus and inde
x It em e xample Response ca tegories Cr onbach ’s α School climat e var iables DISCLI ( disciplinar y climat
e in science
classes)
5
Ho
w of
ten do these things happen in
your science class? (high index cor
-responds t
o a mor
e positiv e disciplinar y climat e) Ther
e is noise and disor
der
4-point scale (1
= Ev er y lesson to 4 = Ne ver or har dly e ver ) 0.90 TEA CHSUP (t eacher suppor
t in science
classes)
5
Ho
w of
ten do these things happen in
your science lessons? (positiv
e index
in case students per
ceiv
e that their sci
-ence t
eachers suppor
t their lear
ning)
The t
eachers sho
w an int
er
est in e
ver
y
student
’s lear
ning
4-point scale (1
= Ev er y lesson to 4 = Ne ver or har dly e ver ) 0.92 BEL
ONG (sense of belong
ing)
6
Think
ing about y
our school: t
o what
ex
tent do y
ou ag
ree with the f
ollo
wing
stat
ements? (positiv
e values on scale
mean a g
reat
er sense of belong
ing)
I f
eel lik
e an outsider (
or lef
t out of things)
at school
stat
ements with negativ
e w or dings w er e in ver ted
4-point scale (1
= Str ongly agr ee to 4 = Str ongly disagr ee ) 0.86 EMOSUP (par ents
’ emotional suppor
t
for school)
4
Think
ing about this academic y
ear
: t
o
what ex
tent do y
ou ag
ree or disag
ree
with the f
ollo wing stat ements? (high index indicat es positiv e par ental emo -tional suppor t) M y par ents suppor t m y educational eff or
ts and achie
vements
4-point scale (1
= Str ongly disagr ee to 4 = Str ongly agr ee ) 0.89 PERFEED (per ceiv ed f eedback fr om sci -ence t eachers) 5 Ho w of
ten do these things happen in
your science lessons? (positiv
e values
on I
ndex indicat
e that students per
-ceiv
e that their t
eachers pr
ovide r
egular
feedback in their science classes)
The t
eacher g
iv
es me f
eedback on m
y
str
engths in this subjec
t
4-point scale (1
=
Ne
ver or almost ne
ver to 4 = Ev er
y lesson or almost e
ver y lesson ) 0.94 F AIR (t eacher fair ness , r ev ersed var iable Unfair teacher) 6 Dur
ing the past 12
months , ho w of ten did y ou ha
ve the f
ollo
wing exper
iences
at school?
Teachers called on me less of
ten than
the
y called on other students
.
4-point scale (1
= Almost ne ver to 4 = O nc
e a w
eek or mor
e
)
0.86
ANTIBULL (not being bullied in school
, re versed var iable ‘Beingbullied ’) 6 Dur
ing the past 12
months , ho w of ten ha ve y
ou had the f
ollo
wing exper
iences
in school? (lo
w scor
es indicat
e high
deg
rees of bullying)
I was thr
eat
ened b
y other students
4-point scale (1
=
Ne
ver or almost ne
ver to 4 = O nc
e a w
eek or mor
e
)
The six it
ems w
er
e coded dichot
omously
(0
=
students indicat
e that the
y did not
Table 1 (c on tinued) Variable # I tems It
em stimulus and inde
x It em e xample Response ca tegories Cr onbach ’s α Co var iat es
ESCS (PISA index of economic
, social
,
and cultural status)
9
PARED index HISEI index HOMEPOS index
Par
ents
’ highest le
vel of education
Par
ents
’ highest occupational status
Pr
ox
y measur
e f
or family w
ealth (a
vail
-abilit
y of household it
ems
, number
of books at home
, and educational
resour ces) Var ious 0.60 Immig ration back gr ound (I mmig1, Immig2) 3
In which countr
y w
er
e y
ou and y
our par ents w er e bor n? (1) Nativ
e, (2)
second-generation student
and (3) first generation immig
rant
Using the nativ
e students as the r
ef
er
-ence (0), dumm
y-coded var
iables
indicating first
- or
second-generation immig ration status Educational out comes A CHMO T (achie vement motivation) 5
To what ex
tent do y
ou disag
ree or ag
ree
with the f
ollo
wing stat
ements about
yourself? (high index scor
e sho
ws high
motivation t
o achie
ve)
I want t
o be one of the best students in
m
y class
“I want t
op g
rades in most or all of m
y
courses
”
4-point scale (1
= Str ongly agr ee to 4 = Str ongly disagr ee ) 0.84 P
VSCIE (science achie
vement)
10
A set of 10 scor
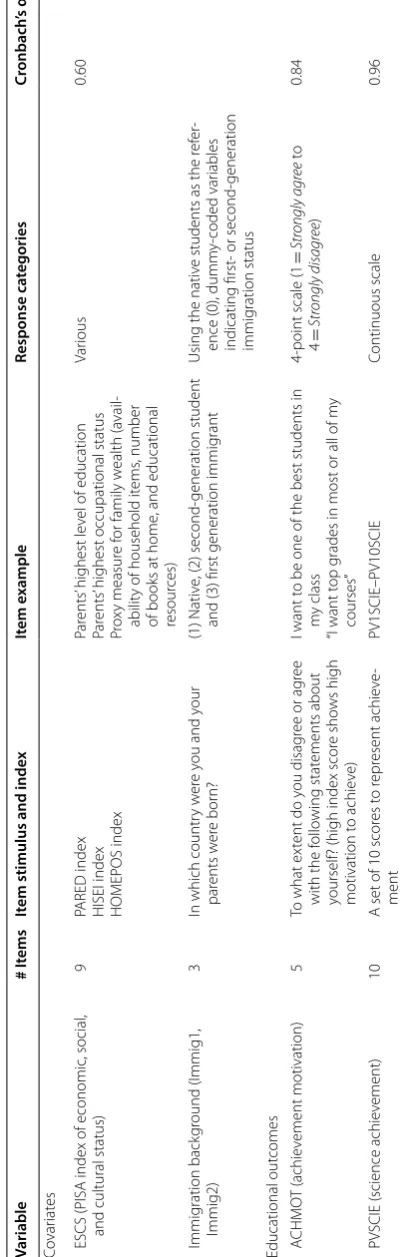
Specifically, using polytomous item response theory models resulted in scale scores for each of these traits (OECD 2017b). These individual scores, Warm’s Mean Weighted Likelihood Estimates (WLEs), were transformed to a mean of zero and a standard devia-tion of one across the OECD countries. For the dichotomous items measuring bullying, these scores were however not provided, and we created a scale using the two-param-eter logistic item response model in the R package ‘TAM’ (Robitzsch et al. 2018). We extracted the resultant WLEs and reversed them to facilitate the interpretation of the scale, that is, as a positively coded trait indicating students’ perceptions of not being bullied. Table 1 provides examples of different response categories and stimuli on all variables.
Statistical analyses
Hierarchical data structure and weights
Given that PISA 2015 applied a two-stage random sampling procedure, in which schools were sampled at the first stage, and 30 students within each school were sampled in the second stage, differences in the probabilities of being selected as a study participant may occur (Asparouhov 2005). In order to adjust for these differences, we used the students’ final weights and the school weights (OECD 2017b) and accounted for the nesting of the student data in schools as follows: (a) In all single-level analyses, in which only the level of students was the main focus, we accounted for the nesting of the students in schools by adjusting the standard errors and the Chi-square statistic through the TYPE = MIX-TURE COMPLEX option—an option that does not model the variance and covariance components at the school level explicitly (Asparouhov and Muthén 2010). In these analyses, only the student weights were included (Mplus WEIGHT option). (b) In all multilevel analyses, we modeled the variance and covariance components of the pro-file membership probabilities and/or the propro-file indicators explicitly at the school level (Mplus option TYPE = MIXTURE TWOLEVEL). These analyses contained both stu-dents and school weights, with the latter scaled to the overall sample (Mplus BWEIGHT option with BWTSCALE = sample) and the former scaled to the clusters/schools (Mplus WEIGHT option with WTSCALE = cluster).
Latent profile analysis (LPA)
We conducted LPA to identify clusters of students by creating a categorical latent vari-able that represents unobservvari-able (probabilistic) membership in a profile (Masyn 2013). This categorical variable is based on a set of continuous variables, the so-called profile indicators, which indicate the students’ perceptions of school climate. LPA is considered a person-centered approach as it identifies groups of students who are homogeneous with respect to the profile indicators but different from other groups of students in the sample (Lubke and Muthén 2005). In contrast to cluster analysis, LPA offers a more flex-ible and model-based approach by dividing the sample into broad categorization using continuous variables (indicators) while maximizes the homogeneity within each group (Marsh et al. 2009). Besides, LPA offers relative fit indices that allow researchers to com-pare different assumptions on the number, the shape, and size of profiles.
the sample-size-adjusted BIC [ABIC]), log-likelihood [LL], and the adjusted Lo-Men-dell-Rubin likelihood ratio test [LRT] are generated, and the model with the lowest information criteria is generally preferred (Masyn 2013). Entropy values above 0.70 indicate acceptable classification accuracy, while values close to 1.0 indicate demarca-tion (Jung and Wickrama 2008). Generally, models with high entropies are preferred over those with lower entropy values (e.g., Hong et al. 2020). Additionally, the deci-sion on the most parsimonious number of profiles as optimal solution should also base on the conceptual meaning of profiles (Marsh et al. 2009). At this point, we note that the statistical criteria to identify the number of “true” profiles in the sample suf-fer from several methodological issues: (1) although researchers may expect the infor-mation criteria to clearly identify one favored model (i.e., the one with the lowest values), it is more common that information criteria decrease when increasing the number of profiles (Morin and Marsh 2015). (2) The likelihood-ratio tests oftentimes fail to identify a candidate model, especially in large samples (Scherer et al. 2017). (3) The statistical indices have different power to detect the number of profiles and may therefore indicate different profile solutions (Tein et al. 2013). In their review of the extant literature on latent class and profile analysis, Nylund-Gibson and Choi (2018) therefore suggested considering jointly “statistical fit indices, substantive inter-pretability and utility” (p. 443). As a consequence, we will not base the decision for the number of profiles solely on the statistical indices, but also on the size and inter-pretability of the resultant profiles. Extending the final latent profile model by science achievement as the distal outcome and several background variables as predictive covariates, we estimated both the differences in the between profiles in the outcome variable and the regression coefficients of the covariates in one step; the number of profiles was fixed after the first step (Masyn 2013).
The LPA models described so far were all based on the assumption that the students’ profile membership did not vary between schools (i.e., the fixed-effects assumption). However, due to the hierarchical data structure with students nested in schools, the size of the latent profiles may vary at the school level (random-effects assumption; Henry and Muthén 2010). To examine whether such a variation existed, we extended the single-level LPA to a multilevel LPA (MLPA) and specified two models: (a) Model MLPA1 assumed that the profile sizes can vary and co-vary at the school level; (b) Model MLPA2 assumed that this variation may be explained by school-level variables (see OECD 2017b), namely school size (SCHSIZE), the student–teacher ratio in the school (STRATIO), the science-specific resources (SCIERES), or the type of school (i.e., private vs. public school). For more details about these models and the alterna-tive analytic options, we recommend the article written by Henry and Muthén (2010).
Plausible values and missing data
Software and estimator
All analyses were conducted in the statistical package Mplus 7.3 (Muthén and Muthén 1998–2015), including the identification of the latent profiles of perceived school cli-mate, the relations between profile membership, student background, and motivational variables, and the degree to which science achievement differentiates between the latent profiles. The means and variances were allowed to vary across profiles and in all models. Further, we performed robust maximum likelihood estimation (MLR estimator) in order to correct for possible bias due to the non-normality of variables.
Results
Descriptive statistics and correlations of the school climate variables
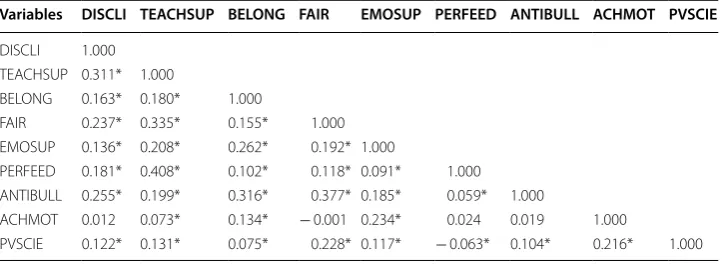
Before conducting the latent profile analyses, we examined the descriptive statistics and scale score reliabilities (Table 2). Regarding the correlations presented in Table 3 among the school-climate variables, low to moderate figures occurred. Specifically, the highest
Table 2 Descriptive statistics, range, skewness and kurtosis for the school climate variables
DISCLI disciplinary climate, TEACHSUP teacher support, BELONG sense of belonging, EMOSUP parents’ emotional support for
school, PERFEED perceived feedback from science teachers, FAIR reversed score of ‘Unfairteacher’, ANTIBULL reversed score of ‘Beingbullied’, WLE weighted mean likelihood estimate (Warm 1989)
a Reversed to ensure the interpretation in a positive direction
Variables M SD Min Max Skewness Kurtosis Score
DISCLI 0.14 0.93 − 2.42 1.88 − 0.18 0.27 WLE
TEACHSUP 0.06 0.99 − 2.72 1.45 − 0.35 − 0.10 WLE
BELONG 0.22 1.13 − 3.15 2.61 0.31 0.56 WLE
EMOSUP 0.07 1.00 − 3.08 1.10 − 0.59 − 0.48 WLE
PERFEED -0.01 0.97 − 1.53 2.50 0.38 0.10 WLE
FAIR 14.09 4.16 0.00 23.00 − 1.34 1.53 Sum scorea
ANTIBULL 1.71 0.59 0.00 2.16 − 1.27 0.89 WLEa
Table 3 Correlations among the profile indicator and outcome variables used in the current study
(N = 5456)
DISCLI disciplinary climate, TEACHSUP teacher support, BELONG sense of belonging, FAIR reversed score of Unfairteacher,
EMOSUP parents’ emotional support for school, PERFEED perceived feedback from science teachers, ANTIBULL reversed score
of Beingbullied, ACHMOT achievement motivation, PVSCIE science achievement score * p < 0.05, ** p < 0.01
Variables DISCLI TEACHSUP BELONG FAIR EMOSUP PERFEED ANTIBULL ACHMOT PVSCIE
DISCLI 1.000 TEACHSUP 0.311* 1.000
BELONG 0.163* 0.180* 1.000
FAIR 0.237* 0.335* 0.155* 1.000 EMOSUP 0.136* 0.208* 0.262* 0.192* 1.000
PERFEED 0.181* 0.408* 0.102* 0.118* 0.091* 1.000 ANTIBULL 0.255* 0.199* 0.316* 0.377* 0.185* 0.059* 1.000
ACHMOT 0.012 0.073* 0.134* − 0.001 0.234* 0.024 0.019 1.000
correlations were found among the variables associated with teacher support and not being bullied: TEACHSUP and PERFEED (r = 0.41), TEACHSUP and FAIR (r = 0.34), TEACHSUP and DISCLI (r = 0.31), ANTIBULL and FAIR (r = 0.38), ANTIBULL and BELONG (r = 0.32).
Latent profiles of school climate perceptions (RQ1) Single‑level LPA
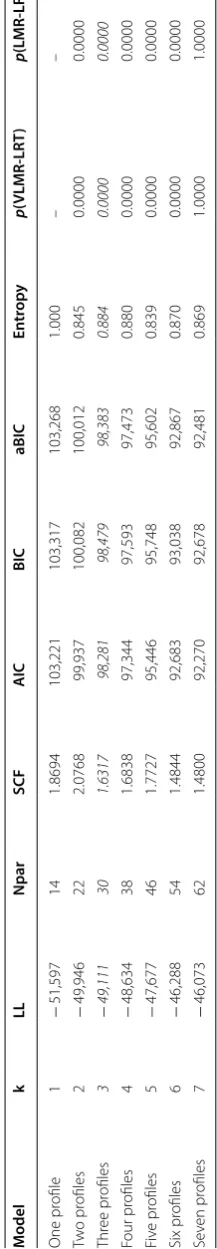
We specified different single-level LPA models with varying numbers of profiles before determining optimal number of profiles (Table 4). A consistent decrease in the informa-tion criteria was observed with increasing number of profiles. Neither the likelihood-ratio tests nor the information criteria identified a favored latent profile model—a situation commonly observed in LPA (Nylund-Gibson and Choi 2018). Only the model entropy reached its maximum for the 3-profile solution (0.884) and identified this model as a favored profile solution. This model was preferred over the two-profile solution, as the likelihood-ratio tests and information criteria suggested. Nevertheless, adding more profiles decreased the information criteria even further and resulted in significant reductions of the log-likelihood function. At the same time, the group sizes of the mod-els with four or more profiles were very small (i.e., less than 5% of the overall sample size), and their interpretability compromised to large overlaps between seemingly dis-tinct profiles for the models with four and more profiles. Following Marsh et al.’s (2009) suggestions to strive for parsimony, we accepted the 3-profile model as the final model (Fig. 2). The decision for this solution, however, was not as clear-cut as one may have anticipated. PISA 2015 are complex data that follow a complex sampling design—this complexity oftentimes makes the application of statistical criteria and likelihood-ratio tests less straightforward (Rutkowski et al. 2014; Scherer et al. 2017).
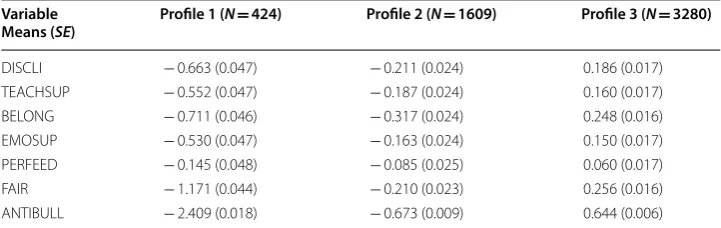
Table 5 shows the means and their standard errors of the school climate variables for each profile. The first profile (profile 1) contained the smallest number of students and can be characterized by consistently negative perceptions of school climate. Students in
Table 4 C omparisons of r ela tiv e mo
del fit indic
es b et w een LP A mo dels k
number of pr
ofiles , LL L oglikelihood , Npar
Number of par
amet ers , SC F scaling c or rec tion fac tor (S at or
ra and B
en tler 2010 ), AIC A kaike ’s inf or ma tion cr iter ion, BIC Ba yesian inf or ma tion cr iter ion, aBIC sample -siz e adjust ed Ba yesian inf or ma tion cr iter ion, VLMR -LR T V uong-L o M
endell-Rubin Likelihood R
atio t est , LMR -LR T L o-M
endell-Rubin Likelihood R
this profile reported very low and negative mean scores on all indicators and perceived teachers’ to be unfair. Largely, students in the profile reported that they were bullied. This group also perceived disciplinary problems at school and shared a poor sense of belonging. The second profile (profile 2) included 30% of the sample. Similar to profile 1, students in this profile exhibited consistently negative perceptions, yet to a substantially smaller degree. The final profile (profile 3) included 62% of the sample, and students in this profile shared consistently positive perceptions on all indicators. Notably, the mean scores of the indicator “perceived teacher feedback” were similarly low in all profiles as seen in Fig. 2.
Multilevel LPA
The model assuming that the profile sizes may vary between schools resulted in two var-iance components (Var[Profile 1] = 0.500, 95% CI [0.141, 0.860]; Var[Profile 2] = 1.370, 95% CI [0.715, 2.026]) and one covariance (Cov = 0.750, 95% CI [0.385, 1.115]) with confidence intervals that did not contain zero and profile 3 as the reference category. In this sense, there was evidence for a significant variation of profile sizes across schools. Next, we introduced the student- and school-level predictors of profile membership and size. The variation in the size of profile 2 could only be explained by the science-related resources in the school (B = 0.110, SE = 0.055, p < 0.05) and the school size (B = − 0.002, SE = 0.001, p < 0.05); the variation in the size of profile 1 could not be explained by the selected school-level variables. In this sense, more students from schools with good science-related resources were assigned to profile 2; moreover, larger schools tended to have fewer students assigned to profile 2.
Profile membership and covariates (RQ2)
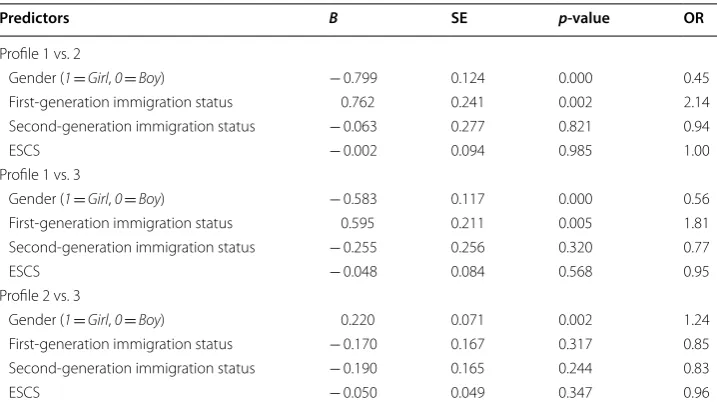
To address our second research question, we introduced the three covariates gen-der, immigration status, and socioeconomic status (ESCS) to the three-profile model and performed a multinomial logistic regression. Table 6 presents the unstandardized regression coefficients for each predictor and comparison. The results show that gen-der played a defining role in determining profile membership. For boys, the probability of membership in profile 1 was higher than that for profile 3 (B = − 0.583, SE = 0.117, p < 0.05, OR = 0.56). Additionally, the probability of belonging in profile 1 with profile
Table 5 Means of the school climate variables for the three identified profiles
DISCLI disciplinary climate, TEACHSUP teacher support, BELONG sense of belonging, EMOSUP parents’ emotional support for
school, PERFEED perceived feedback from science teachers, FAIR reversed score of Unfairteacher, ANTIBULL reversed score of Beingbullied
Variable
Means (SE) Profile 1 (N = 424) Profile 2 (N = 1609) Profile 3 (N = 3280)
DISCLI − 0.663 (0.047) − 0.211 (0.024) 0.186 (0.017)
TEACHSUP − 0.552 (0.047) − 0.187 (0.024) 0.160 (0.017)
BELONG − 0.711 (0.046) − 0.317 (0.024) 0.248 (0.016)
EMOSUP − 0.530 (0.047) − 0.163 (0.024) 0.150 (0.017)
PERFEED − 0.145 (0.048) − 0.085 (0.025) 0.060 (0.017)
FAIR − 1.171 (0.044) − 0.210 (0.023) 0.256 (0.016)
2 as a reference was also higher for boys. Similarly, it was more likely for girls to be a member of profile 3 rather than profile 2 than for boys (B = 0.220, SE = 0.071, p < 0.05, OR = 1.24). For immigration background, membership in profile 1 compared to pro-file 3 was more likely for students who had a first-generation immigration background (B = 0.595, SE = 0.211, p < 0.05, OR = 1.81). The socio-economic status of students did not predict profile membership significantly.
LPA with outcome variables (RQ3)
Finally, science achievement was introduced as an outcome variable. The results showed that the difference in the achievement score between profile 1 (M = − 0.526, SD = 0.988) and profile 2 (M = 0.059, SD = 0.988) was significant (d= − 0.592, 95% CI [− 0.702, − 0.482]), and so was the difference between profile 1 and profile 3 (M = 0.040, SD = 0.988; d = − 0.573, 95% CI [− 0.676, − 0.470]) for science. However, the difference between profiles 2 and 3 was insignificant (d = 0.019, 95% CI [− 0.041, 0.079]). For the LPA model with achievement motivation, the difference between profiles 1 (M = − 0.098, SD = 1.020) and 2 (M = 0.142, SD = 1.020) was significant (d= -0.235, 95% CI [− 0.344, − 0.127]), and so was the difference between profiles 1 and 3 (M = 0.112, SD = 1.020; d = − 0.206, 95% CI [− 0.309, − 0.103]). Again, the difference between profiles 2 and 3 was insignificant (d = 0.029, 95% CI [− 0.031, 0.090]).
Discussion
In the present study, we used LPA to make visible the unobserved heterogeneity in stu-dents’ perceptions of school climate based on a broad range of indicators. Our results add to the extant body of research in the area of school climate perceptions by examin-ing profiles of students rather than focusexamin-ing on a sexamin-ingle set of mean levels of variables.
Table 6 Logistic regression coefficients explaining the probabilities of profile membership
The unstandardized regression coefficients are shown. Immigration status was dummy-coded based on the original PISA 2015 coding (0 = Native student, 1 =Second-generation immigration status, 2 = First-generation immigration status)
ESCS index of economic, social, and cultural status, OR odds ratio
Predictors B SE p‑value OR
Profile 1 vs. 2
Gender (1 = Girl, 0 = Boy) − 0.799 0.124 0.000 0.45 First-generation immigration status 0.762 0.241 0.002 2.14 Second-generation immigration status − 0.063 0.277 0.821 0.94
ESCS − 0.002 0.094 0.985 1.00
Profile 1 vs. 3
Gender (1 = Girl, 0 = Boy) − 0.583 0.117 0.000 0.56 First-generation immigration status 0.595 0.211 0.005 1.81 Second-generation immigration status − 0.255 0.256 0.320 0.77
ESCS − 0.048 0.084 0.568 0.95
Profile 2 vs. 3
Gender (1 = Girl, 0 = Boy) 0.220 0.071 0.002 1.24 First-generation immigration status − 0.170 0.167 0.317 0.85 Second-generation immigration status − 0.190 0.165 0.244 0.83
This person-centered approach enabled us to identify student profiles across different school climate indicators.
We identified three latent profiles, characterized by (a) consistently negative per-ceptions and extreme levels of feeling bullied and treated unfairly by teachers (pro-file 1), (b) consistently negative perceptions, yet mediocre levels of feeling bullied and treated unfairly by teachers (profile 2), and (c) consistently positive perceptions of the school-climate variables. The corresponding statistical model discriminated well between these profiles and classified students into one of the three groups to an acceptable extent. Our decision was not only based on the fit criteria, but also the theoretical consideration that profile 1 provided unique information. Although, both profile 1 and 2 reflect consistently negative perceptions on all variables in the study, profile 1 is distinguished by extreme levels of feeling bullied and treated unfairly by teachers.
The consistency of negative or positive perceptions was also indicated by the mod-erate and statistically significant correlations among the school-climate variables. Profile membership was predicted by students’ gender and first-generation immi-gration status, yet not by their socioeconomic status. Finally, the three profiles dif-fered in their science achievement and achievement motivation—specifically, these differences occurred between profiles 1 and 2 and profiles 1 and 3, yet not between profiles 2 and 3.
Profiles of school climate perceptions (RQ1)
Our findings revealed the existence of three different latent profiles confirming the expectation that students are not uniform in their perceptions about school climate, and members of these distinct profiles show different levels on different indicators. Despite the fact that indicators of school climate tap different factors relevant to school climate (e.g., factors concerning peers, teachers, and parents), the perceptions were consist-ently positive or negative within the profiles. This finding may suggest the existence of a general trait behind student ratings indicating students’ “overall” perceptions of school climate (e.g., You et al. 2014). Nevertheless, the mere existence of several profiles sug-gests that students’ responses to the school-climate items were heterogeneous, yet not uniform within the Norwegian PISA 2015 sample. Identifying such heterogeneity, which was initially unobserved, can provide both teachers and researchers with information about subgroups of students who may need specific support to strengthen their percep-tions, such as their sense of belonging in school (e.g., Shukla et al. 2016).
undeservedly affected more than others by aggression, antisocial behavior, bullying, and school violence (Kutsyuruba et al. 2015; OECD 2017a).
Effects of covariates on profile membership (RQ2)
Regarding the covariates, students’ perceptions of school climate were gender- and immigration status-lean in our findings. There is plenty of evidence in research suggest-ing that such differences may occur in the constructs we chose as boys and girls perceive differently the dimension of discipline, unfair treatment by teachers, school violence involving school safety and bullying (Sortkær and Reimer 2018; OECD 2017a; Benben-ishty and Astor 2005). Boys experience direct forms of bullying more often than girls, particularly physical victimization; girls often experience relational and indirect forms of bullying, such as being ignored or talked behind (Huang and Chou 2010; Wendelborg 2019). In our study, the gender differences pointed to girls reporting less bullying than boys do. This finding is somewhat inconsistent with prior findings (Lenzi et al. 2014), and one possible explanation that requires further substantiation is that girls may have felt more restricted in voicing unfair treatment and bullying than boys.
This same link is visible for many first-generation immigrants who were assigned to profile 1 and perceive being bullied more often than the native students or students with a second-generation immigration background. Possible reasons for the existence of differences in the first-generation immigrant students could be their limited language proficiency, their struggles with adjusting to school, and the possible lack of parental emotional support for schoolwork (Duong et al. 2016). Moreover, research on violence and victimization also highlights the aspect that probably due to their within-group cul-tural “clashes”, different looks and language issues, first-generation immigrant students face frequent risks of being bullied (Benbenishty and Astor 2005; Peguero 2009).
A research study of the prevalence of bullying victimization in schools among native and immigrant children by Bjereld et al. (2015) reported higher percentages for immi-grant children in Norway. These percentages for immiimmi-grant children were 30.2% com-pared to 17.1% for native children in 2011. Students with an immigrant background are also more likely to report unfair teacher behavior as they might attend disadvantaged schools with higher concentrations of immigrant students coupled with high student– teacher ratios (OECD 2017a). There are more chances of disruptive behavior and teach-ers paying less attention to individual students in large classes and schools with high student–teacher ratio (OECD 2016b).
By itself, identification of perceptions of school climate indicators may not be sufficient to amend the inequalities as background characteristics, such as gender and immigra-tion status, can neither be altered nor modified in a given school composiimmigra-tion. However, identifying and mapping the respective needs of boys and girls can help improve their perceptions of school climate and thereby raise the overall attitudes toward school. Hop-son and Lee (2011) point out that the positive perceptions of school climate moderate the association between student demographics and academic achievement and between SES and behavior—in this sense, there could be a potential in improving school-climate perceptions for decreasing possible demographic achievement gaps.
Differences in educational outcomes between profiles (RQ3)
It is common to connect school success with well-being in school, and our third finding showed a significant association between profile membership, science achievement and achievement motivation. These connections between school climate and educational outcomes have been confirmed in prior research: Positive school climate and motivation are linked to academic outcomes (Fan and Williams 2018), as school climate particularly relates to instructional quality and student achievement (Scherer and Nilsen 2016). In particular, positive teacher-student interactions, as a dimension of school climate, are associated with a lower frequency of reported problem behaviors (Wang et al. 2010). Given the positive correlation between achievement and motivation, the differences in achievement and motivation across profiles co-exist. The positive and moderate relation between achievement and achievement motivation has been established across many studies, samples, and domains (Wigfield et al. 2016).
Taken together, it is important to address the underlying dimensions of school climate both independently and collectively and not just as a general index. Keeping in mind the probabilistic nature of LPA our profile classification is more suggestive than conclu-sive. However, by acknowledging the different patterns of perceptions of school climate, educators can pay attention to the specific dimensions that distinguish these profiles. Anderman (2002) argues that school-level variables, through efforts for developing aca-demically effective schools, might be altered, and schools should work towards creat-ing a positive climate as a part of school development policies. In light of our findcreat-ings, we support the notion that students who perceive their school climate as extremely negative, stand at risk for motivational, behavioral, and psychological problems (Eccles et al. 1993). Particularly for the smallest group of students with greater levels of per-ceived social rebuff in schools, special attention in policies concerning school improve-ment should be prioritized (Anderman 2002). For supporting students who deserve more attention due to their low perceptions of school climate, educators and authorities should establish positive and fair routines at different levels of the organization. These efforts will enable students to cultivate interpersonal skills required for building resil-ience and coping with adversity thereby improving students’ social and emotional well-being and their academic outcomes.
Limitations and future directions
about the associations between profiles, covariates, and distal outcome variables are lim-ited (Strietholt and Scherer 2018). This limitation further entails that different profiles may be identified across contexts (e.g., classroom vs. school climate), study designs (e.g., cross-sectional vs. longitudinal studies), or countries (e.g., Norway vs. Sweden), and thus calls for (a) replication studies of the identified profiles and (b) constantly monitoring the profiles within a country, context, and study design over time (i.e., with new cycles of PISA).
Second, as our focus was on exploring the profile memberships based on the con-ceptual definition of school climate derived solely from the PISA framework for school learning environment (OECD 2016b), the possibilities to include further dimensions of the constructs were limited. In other words, different sets of school climate variables may result in different profiles. As possible reasons for the occurrence of the latent profile are not clearly evident and model assumptions may not hold in all samples. Extending the range of dimensions and ultimately broadening the perspectives on school climate could shed further light on the distinction between the latent profiles. Third, as commonly observed in latent class and profile analysis, the decision for the number of profiles was not clear-cut considering the statistical criteria (Nylund-Gibson and Choi 2018). Hence, the utility and interpretability of the profile solution, two less objective but necessary criteria, had to be taken into account as well. The replicability of the latent profile analy-sis for other samples, context, measures, and criteria may be therefore limited. Despite these limitations, the findings from this study may enable educators to understand and acknowledge the diversity in student perceptions and shed light on the nuances and the interplay between components of school climate from a perspective of individual differ-ences (e.g., Wang and Degol 2016; Yang et al. 2013).
Conclusion
This study provides insights into the understanding and role of school climate by exam-ining the existence of unobserved (latent) profiles of perceived school climate. Our findings reveal three distinguishable groups of students characterized with varying per-ceptions that were so far invisible. Profile membership varies as a function of gender and immigration background with first generation male immigrants to be more likely in the profile with extremely negative perceptions on all school climate indicators. We conclude that using a person-centered approach for studying the perceptions of school climate has the potential to provide meaningful overview over heterogeneous percep-tions of students, particularly regarding the perceived unfair treatment by teachers and bullying in schools. Ultimately, this approach may aid the understanding of indicators of school climate midst educators and policy makers. Our study also provides an example of LPA and adds to the extant literature related to school climate in the context of ILSAs. Acknowledgements
The authors would like to thank the Norwegian PISA 2015 group for providing and preparing the data for the present study.
Author confirmation
We confirm that this manuscript is original and has not yet been published elsewhere. It is not under concurrent consid-eration elsewhere. Both authors have approved the manuscript and agree with its submission to Large-scale Assess-ments in Education.
Authors’ contributions
Both authors have made substantial contributions to the conception, analysis, interpretation and drafting of the work. Additionally both authors have approved the submitted version while agreeing to be accountable for the author’s own contributions and to ensure that questions related to the accuracy or integrity of any part of the work, even ones in which the author was not personally involved, are appropriately investigated, resolved, and the resolution documented in the literature. Both authors read and approved the final manuscript.
Funding
No additional funding was associated with this research. Availability of data and materials
The study represents a secondary data analysis of the public use PISA 2015 file provided by the OECD. The PISA 2015 Science data for Norway have been made publicly available by the OECD, and can be accessed at: https ://www.oecd. org/pisa/data/2015d ataba se/.
Competing interests
No financial interests or benefits have arisen from direct application of this research. Author details
1 Faculty of Educational Sciences, Department of Teacher Education and School Research (ILS), University of Oslo, Postbox 1099, Blindern, 0317 Oslo, Norway. 2 Faculty of Educational Sciences, Centre for Educational Measurement at the University of Oslo (CEMO), University of Oslo, Oslo, Norway.
Received: 7 September 2019 Accepted: 20 March 2020
References
Anderman, E. M. (2002). School effects on psychological outcomes during adolescence. Journal of Educational Psychology, 94(4), 795.
Asparouhov, T. (2005). Sampling weights in latent variable modeling. Structural Equation Modeling,12(3), 411–434. Asparouhov, T., & Muthén, B. O. (2010). Resampling methods in Mplus for complex survey data. Los Angeles: Muthén &
Muthén. Retrieved August 19, 2019, from https ://www.statm odel.com/downl oad/Resam pling _Metho ds5.pdf. Avvisati, F., Gurgand, M., Guyon, N., & Maurin, E. (2013). Getting parents involved: A field experiment in deprived schools.
Review of Economic Studies,81(1), 57–83.
Bandura, A. (2001). Social cognitive theory: An agentic perspective. Annual Review of Psychology,52(1), 1–26.
Benbenishty, R., & Astor, R. A. (2005). School violence in context: Culture, neighborhood, family, school, and gender. New York: Oxford University Press.
Berkowitz, R., Moore, H., Astor, R. A., & Benbenishty, R. (2017). A research synthesis of the associations between socioeco-nomic background, inequality, school climate, and academic achievement. Review of Educational Research,87(2), 425–469.
Birkemo, A. (2002). Læringsmiljø og utvikling. Oslo: Universitet i Oslo, Pedagogisk forskningsinstitutt.
Bjereld, Y., Daneback, K., & Petzold, M. (2015). Differences in prevalence of bullying victimization between native and immigrant children in the N ordic countries: A parent-reported serial cross-sectional study. Child: Care, Health and Development,41(4), 593–599.
Bradshaw, C. P., Koth, C. W., Thornton, L. A., & Leaf, P. J. (2009). Altering school climate through school-wide positive behavioral interventions and supports: Findings from a group-randomized effectiveness trial. Prevention Science, 10(2), 100–115.
Bronfenbrenner, U. (1979). The ecology of human development. Cambridge, MA: Harvard University Press.
Bryk, A. S., Sebring, P. B., Allensworth, E., Easton, J. Q., & Luppescu, S. (2010). Organizing schools for improvement: Lessons from Chicago. Chicago: University of Chicago Press.
Caponera, E., & Losito, B. (2016). Context factors and student achievement in the IEA studies: Evidence from TIMSS. Large-Scale Assessments in Education,4, 12. https ://doi.org/10.1186/s4053 6-016-0030-6.
Cheema, J. R., & Kitsantas, A. (2014). Influences of disciplinary classroom climate on high school student self-efficacy and mathematics achievement: A look at gender and racial–ethnic differences. International Journal of Science and Mathematics Education,12(5), 1261–1279.
Chirkina, T. A., & Khavenson, T. E. (2018). School climate: A history of the concept and approaches to defining and measur-ing it on PISA questionnaires. Russian Education & Society,60(2), 133–160.
Chrysanthou, G. M., & Vasilakis, C. (2019). The impact of bullying victimisation on mental wellbeing (IZA DP No. 12206). Bonn: IZA-Institute of Labor Economics. Retrieved from http://ftp.iza.org/dp122 06.pdf.
Cohen, J., & Geier, V. K. (2010). School climate research summary: January 2010. School Climate Brief,1(1), 1–6. Cohen, J., McCabe, L., Michelli, N. M., & Pickeral, T. (2009). School climate: Research, policy, practice, and teacher
educa-tion. Teachers College Record,111(1), 180–213.
Creemers, B., Scheerens, J., & Reynolds, D. (2000). Theory development in school effectiveness research. In C. Teddlie & D. Reynolds (Eds.), The international handbook of school effectiveness research (pp. 283–298). Abingdon, Oxon: Routledge.
Daily, S. M., Mann, M. J., Kristjansson, A. L., Smith, M. L., & Zullig, K. J. (2019). School climate and academic achievement in middle and high school students. Journal of School Health,89(3), 173–180.
Davidov, M., & Grusec, J. E. (2006). Untangling the links of parental responsiveness to distress and warmth to child out-comes. Child Development,77(1), 44–58.
De Pedro, K. T., Gilreath, T., & Berkowitz, R. (2016). A latent class analysis of school climate among middle and high school students in California public schools. Children and Youth Services Review,63, 10–15.
Deal, T. E., & Peterson, K. D. (2016). Shaping school culture (3rd ed.). San Francisco: Jossey-Bass by John Wiley & Sons Inc. Duong, M. T., Badaly, D., Liu, F. F., Schwartz, D., & McCarty, C. A. (2016). Generational differences in academic achievement
among immigrant youths: A meta-analytic review. Review of Educational Research,86(1), 3–41.
Durlak, J. A., Weissberg, R. P., Dymnicki, A. B., Taylor, R. D., & Schellinger, K. B. (2011). The impact of enhancing students’ social and emotional learning: A meta-analysis of school-based universal interventions. Child Development,82(1), 405–432.
Eccles, J. S., Midgley, C., Wigfield, A., Buchanan, C. M., Reuman, D., Flanagan, C., et al. (1993). Development during adolescence: The impact of stage-environment fit on young adolescents’ experiences in schools and in families.
American Psychologist,48(2), 90–101.
Eccles, J. S., & Wigfield, A. (2002). Motivational beliefs, values, and goals. Annual Review of Psychology,53(1), 109–132. Elliot, A. J., & McGregor, H. A. (2001). A 2 × 2 achievement goal framework. Journal of Personality and Social Psychology,
80(3), 501–519.
Enders, C. K. (2010). Applied missing data analysis. New York: Guilford Press.
Espelage, D. L. (2014). Ecological theory: Preventing youth bullying, aggression, and victimization. Theory into Practice, 53(4), 257–264.
Fan, W., & Williams, C. (2018). The mediating role of student motivation in the linking of perceived school climate and academic achievement in reading and mathematics. Frontiers in Education,3, 50. https ://doi.org/10.3389/feduc .2018.00050 .
Gage, N. A., Larson, A., Sugai, G., & Chafouleas, S. M. (2016). Student perceptions of school climate as predictors of office discipline referrals. American Educational Research Journal,53(3), 492–515.
Grazia, V., & Molinari, L. (2020). School climate multidimensionality and measurement: A systematic literature review.
Research Papers in Education. https ://doi.org/10.1080/02671 522.2019.16977 35. Hattie, J. (2013). Calibration and confidence: Where to next? Learning and Instruction,24, 62–66.
Havnes, A., Smith, K., Dysthe, O., & Ludvigsen, K. (2012). Formative assessment and feedback: Making learning visible.
Studies in Educational Evaluation,38, 21–27.
Henry, K. L., & Muthén, B. O. (2010). Multilevel latent class analysis: An application of adolescent smoking typologies with individual and contextual predictors. Structural Equation Modeling: A Multidisciplinary Journal,17, 193–215. Hill, N. E., & Tyson, D. F. (2009). Parental involvement in middle school: A meta-analytic assessment of the strategies that
promote achievement. Developmental Psychology,45(3), 740–763.
Hong, W., Bernacki, M. L., & Perera, H. N. (2020). A latent profile analysis of undergraduates’ achievement motivations and metacognitive behaviors, and their relations to achievement in science. Journal of Educational Psychology. https :// doi.org/10.1037/edu00 00445 .
Hopson, L., & Lee, E. (2011). Mitigating the effect of family poverty on academic and behavioral outcomes: The role of school climate in middle and high school. Children and Youth Services Review,33, 2221–2229.
Huang, Y. Y., & Chou, C. (2010). An analysis of multiple factors of cyberbullying among junior high school students in Taiwan. Computers in Human Behavior, 26(6), 1581–1590.
Jung, T., & Wickrama, K. A. S. (2008). An introduction to latent class growth analysis and growth mixture modeling. Social and Personality Psychology Compass,2(1), 302–317.
Kjærnsli, M., & Rohatgi, A. (2016). Læringsmiljøet i skolen. In M. Kjærnsli & F. Jensen (Eds.), Stø kurs: Norske elevers kom-petanse i naturfag, matematikk og lesing i PISA 2015 (pp. 172–190). Oslo: Universitetsforlaget.
Konishi, C., Miyazaki, Y., Hymel, S., & Waterhouse, T. (2017). Investigating associations between school climate and bullying in secondary schools: Multilevel contextual effects modeling. School Psychology International,38(3), 240–263. Kutsyuruba, B., Klinger, D. A., & Hussain, A. (2015). Relationships among school climate, school safety, and student
achievement and well-being: A review of the literature. Review of Education,3(2), 103–135.
Ladd, G. W., Ettekal, I., & Kochenderfer-Ladd, B. (2017). Peer victimization trajectories from kindergarten through high school: Differential pathways for children’s school engagement and achievement? Journal of Educational Psychol-ogy,109(6), 826–841.
LeBlanc, L., Swisher, R., Vitaro, F., & Tremblay, R. E. (2007). School social climate and teachers’ perceptions of classroom behavior problems: A 10 year longitudinal and multilevel study. Social Psychology of Education,10(4), 429–442. Lenzi, M., Vieno, A., Gini, G., Pozzoli, T., Pastore, M., Santinello, M., et al. (2014). Perceived teacher unfairness, instrumental
goals and bullying behavior in early adolescence. Journal of Interpersonal Violence,29, 1834–1849.
Leung, G. S., Yeung, K. C., & Wong, D. F. (2010). Academic stressors and anxiety in children: The role of paternal support.
Journal of Child and Family Studies,19(1), 90–100.
Lubke, G. H., & Muthén, B. (2005). Investigating population heterogeneity with factor mixture models. Psychological Methods,10(1), 21–39.
Lüdtke, O., Robitzsch, A., Trautwein, U., & Kunter, M. (2009). Assessing the impact of learning environments: How to use student ratings of classroom or school characteristics in multilevel modeling. Contemporary Educational Psychol-ogy,34, 77–88.
Marsh, H. W., Lüdtke, O., Nagengast, B., Trautwein, U., Morin, A. J., Abduljabbar, A. S., et al. (2012). Classroom climate and contextual effects: Conceptual and methodological issues in the evaluation of group-level effects. Educational Psychologist,47(2), 106–124.