CURRICULUM ARTICLE
Phylogenetic Analysis: How Old are the Parts of Your Body?
Robert K. Kuzoff&Seth B. Kemmeter& Jeffrey S. McKinnon&Courtney P. Thompson
Published online: 25 July 2009
#Springer Science + Business Media, LLC 2009
Abstract According to the National Academy of Sciences, biology students in the USA are not being adequately prepared for successful futures. Of paramount concern is a lack of sufficient training in quantitative and computational skills, which are needed to compete effectively for an array of educational and occupational opportunities. In this paper, we introduce a classroom exercise that invites students to solve a simple biological problem and illustrates the need for a computer-assisted strategy to arrive at a solution. The exercise invites students to consider the question“How old are the parts of your body?”Some features of the human body are more ancient than others. For example, our bodies have both hair and backbones, but backbones arose much earlier in evolutionary history. Our exercise relies upon MEGA 4.0, a free, visually appealing, and intuitive computer program that allows students to gather DNA or protein sequences from electronic databases, then use them to infer phylogenetic trees. Student-inferred phylogenies are used to explore the relative order in which diverse aspects of the human form evolved. In the process, students are trained to use powerful features of MEGA and encouraged through group discussion to consider additional applica-tions of the technology they have learned. Our lesson plan includes a brief video, a web site with essential terminology and links for further exploration, a hands-on experience using MEGA, and a follow-up discussion.
Keywords Alignment . Bioinformatics . Evolution . MEGA . Phylogeny
Introduction
Educational Background Biology, as a discipline, is in a state of continual and rapid flux. What was once a largely qualitative and low-tech branch of science has increasingly become the domain of ornate mathematical models and sophisticated software packages (Steen2005). Accordingly, two recent studies by the National Academy of Sciences emphasize the need for more extensive and rigorous training of biology students in both quantitative and computational skills (National Research Council 2003,
2005). These studies indicate that students trained in the USA are frequently deficient in these areas when compared with their international counterparts and, consequently, are placed at a competitive disadvantage when pursuing vocational opportunities in the public and private sectors. Hence, there is a compelling need for engaging and empowering educational opportunities for contemporary students of biology, especially at the high school and college levels.
Contemporary students are increasingly engaged in a technology-imbued lifestyle, presenting novel challenges and opportunities to high school and college educators. A challenge is to vie for the attention of students who are exposed to a steady stream of brilliant audio and visual stimulation. A byproduct of a technology-based lifestyle is that the average student has an innate fondness for computer-based technology and is eager to gain expertise and sophistication with its use. Herein lies a promising opportunity. If an introduction to computer-based technol-R. K. Kuzoff (*)
:
S. B. Kemmeter:
C. P. ThompsonDepartment of Biological Sciences, University of Wisconsin, Whitewater, WI 53190, USA
e-mail: kuzoffr@uww.edu
J. S. McKinnon
Department of Biology, East Carolina University, Greenville, NC 27858, USA
ogy can be coupled to a set of suitable learning objectives, students may engage actively in learning that might not otherwise occur. In addition to providing a means to acquire essential foundational knowledge in any amenable area of biology, an opportunity is also presented to cultivate computational and critical thinking skills called for in the studies conducted by the National Academy.
Recently, a range of computer-based strategies have been developed and implemented by innovative educators, and these approaches have met with considerable success in the classroom. Significant improvement in learning effective-ness was shown in a variety of biological subject areas. For example, successful learning modules have been developed for diffusion and osmosis (Meir et al. 2005), DNA replication (Woods et al. 2008), field biology (Baggott and Rayne2007), genetics (Calie et al. 2007), macroevo-lution (Perry et al.2008), and viral evolution (Rybarczyk
2008a, b). These and other examples illustrate the potential for computational approaches to enhance and invigorate biology education at secondary and postsecondary levels (Syh-Jong2008). However, to realize these benefits, a varie-ty of potential barriers need to be addressed, notably provi-sion of workable and effective lesson plans as well as training and support for biology instructors (Mueller et al.
2008).
Our strategy is to introduce to students an apparently simple and engaging question through a group discussion that culminates in the formation of a testable hypothesis. Thereafter, students are provided access to a minimal body of foundational knowledge through a stimulating video and a webpage, both of which are freely available to the public. Students are subsequently given an opportunity to work with MEGA 4.0, a computer program that is user-friendly and visually appealing, yet is a professional-grade software application used daily in research laboratories around the world (Tamura et al.2007; Kumar et al.2008;http://www. megasoftware.net/). Finally, students are invited to interpret their own results, evaluate the hypothesis they formulated in the preactivity discussion, and brainstorm about addi-tional applications of the technology they have just learned to use.
Biological BackgroundAs groups of organisms diverge and diversify, lineage-specific distinctions arise at both the anatomical and molecular levels (O'Hara 1997). Given sufficient time, a set of characteristics accumulates that can be used to differentiate members of one organismal group from another (Baum et al.2005; Baum and Offner 2008; Gregory 2008). Although excellent analyses may be conducted with either anatomical or molecular data, the latter offer some distinct advantages for computer-based phylogenetic inference in the classroom. First, molecular data from an enormous array of species, representing the
most phylogenetically diverged lineages in the tree of life, are freely and publicly available in web-accessible elec-tronic repositories (e.g., GenBank which is accessible through the National Center for Biotechnology Information (NCBI) website, http://www.ncbi.nlm.nih.gov/). Second, these data can be processed and analyzed for historical content with only a minimal level of background informa-tion. In contrast, anatomical data are generally gathered and interpreted by individuals with a considerable amount of organism-specific expertise. Third, a number of engaging and user-friendly software packages are freely available to reconstruct phylogenies from molecular data (e.g., Tamura et al. 2007; Kumar et al. 2008) [NB, in this exercise, students gather sequences of the PaxNEB gene from diverse animal species. PaxNEB encodes an RNA poly-merase II elongator protein subunit (for details, see Klenjan et al.2002), but its function is not relevant to the exercise. It was selected because it evolves at an appropriate rate for resolving relationships among distantly related animals, both in terms of its moderate rate of amino acid substitutions and its low rate of gene duplications].
Student Activity
Preactivity Discussion Prior to engaging in the hands-on activity, students are engaged in a discussion of the relative ancestry of several anatomical components of their bodies. They are asked to reason out an answer to the following prompt,“How old are the parts of your body?”The prompt is phrased in this manner to entice discussion, but the goal is to have students propose a working hypothesis for the relative order in which several features of the human body arose in evolutionary history. For simplicity, only 12 body parts are considered (see Table 1). We believe that this discussion serves to orient students to an uncomplicated problem that is amenable to resolution through phyloge-netic analysis. Additionally, in our experience, students generally find this problem worthy of their attention and express a range of conflicting opinions during this initial discussion. This group interaction increases their sense of
Table 1 Table of body parts included in preactivity discussion and in
the remainder of the exercise
Body hair Very large brain Placenta Amniotic egg Mammary gland Muscles Forelimbs and hindlimbs Opposable thumb Nipples Hinged jaw Left–right symmetry Vertebrae
investment in discovering a solution to the problem at hand.
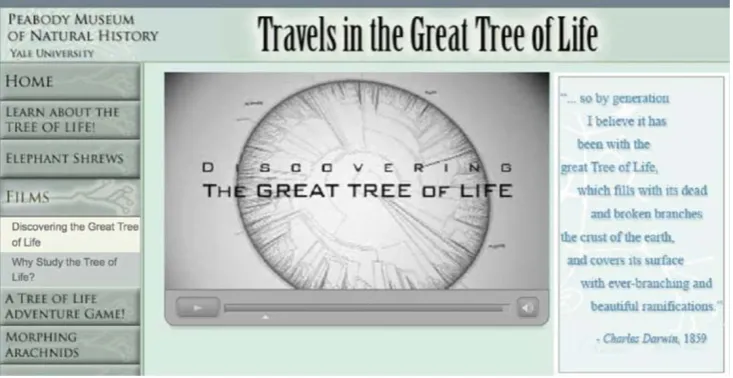
Foundational KnowledgeStudents are shown a video that introduces foundational knowledge required to under-stand the analyses they are going to conduct. Although other information delivery vehicles are compatible with the exercise, and individual educators may find value in an alternative approach, we believe that an easily un-derstood and visually stimulating video prepared by the Peabody Museum of Natural History, at Yale University, provides a sufficient body of background knowledge for students to begin the hands-on exercise (Discovering the Great Tree of Life,http://www.peabody.yale.edu/exhibits/ treeoflife/film_discovering.html; Fig.1).
Prior to viewing the video, students may be asked to formulate answers to a small set of questions that can be discussed afterward. Some suggested questions that lend themselves to a think-pair-share group discussion include:
1. How many species are there on earth?
2. What do the scientists in the video mean by“the tree of life?”
3. How old do they estimate this tree is?
4. How does a single branch in the tree of life split to become two branches?
5. How do novel characteristics arise in the history of a biological lineage?
6. What are the sources of evidence used to determine the shape of the tree of life?
7. Why are computers needed to analyze data sets when determining the shape of the tree of life?
After discussing the video, students progress to an exploratory and interactive web site that introduces
addi-tional concepts and vocabulary that will be essential to understanding the products of their analyses (http://www. nescent.org/media/NABT/mega_workshop.php). However, no specific activity is assigned for this web site. Instead, students are made aware of its existence and contents, given the URL, and then encouraged to proceed directly to the hands-on activity. The strategy here being that students will consult the web site just when they perceive a need for its contents. We believe this engenders a student-led learning process, in contrast to an instructor-led process, which might be accomplished through a preactivity lecture.
Hands-On Exercise Once equipped with the necessary foundational knowledge, students progress to a hands-on computational activity that teaches them how to locate and collect protein sequences from GenBank, a publicly available database (http://www.ncbi.nlm.nih.gov/). To do this, they utilize MEGA 4.0, a freely available software package which they can download themselves or which can be installed in advance from a web site (Tamura et al.2007; Kumar et al. 2008; http://www.megasoftware.net/) [NB, although installation on PCs running Microsoft Windows or Vista is straightforward, installation on a Macintosh requires two additional steps, which are the prior installa-tion of either Boot Camp (available at http://www.apple. com/downloads/macosx/apple/) or Parallels (available at
http://www.parallels.com/landingpage/dskd10_5/?source-google_us&gclid=CK63h_G7hZsCFQ3xDAod5y-mog) and the prior installation of either Microsoft Windows or Vista (http://www.microsoft.com)]. An excerpt from the student guide illustrates the step-by-step instructions that are provided to teach the requisite computational skills (see Fig. 2; the full step-by-step guide appears in the Appendix
and is available at http://www.nescent.org/media/NABT/ mega_workshop.php; NB, MEGA 4.0 has a variety of
Fig. 1 Screenshot of
powerful features in addition to those that are used in this exercise. For further description, please see Kumar et al.
2008). To guard against the potential for students to passively follow the instructions in the guide without actively considering what they are doing, it may be beneficial for students to work in pairs. Additionally, students can be encouraged to reflect on the purpose of steps in the protocol by informing them that in the postactivity discussion, each group will be called upon to explain to their peers the purpose of a randomly selected set of steps in the step-by-step guide.
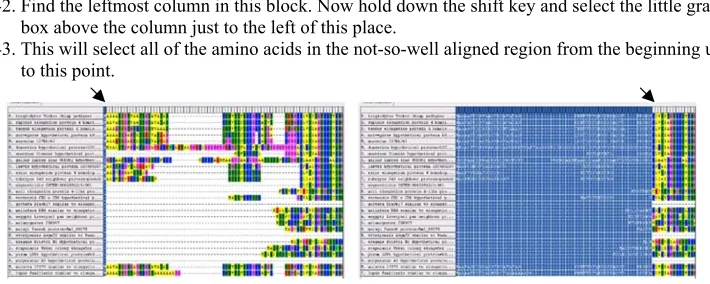
Next, students learn how to convert their“raw”protein sequences into a data matrix. This involves a process called multiple sequence alignment in which regions that are conserved among related sequences are placed in vertical alignment, and intervening length-variable regions are modified through the insertion of“gaps.”Proteins contain regions that are especially integral to their functions, and these domains are under strong stabilizing selection. Length mutations in these regions are generally rare and small in size, if they do occur. In contrast, portions of the protein sequence outside such functional domains may accumulate
a number of mutations that alter their lengths. Accordingly, conserved regions in sequences sampled from divergent species can be aligned with one another readily, but intervening regions may vary significantly in length. Gaps need to be inserted into the length-variable regions to account for length mutations that have accumulated over evolutionary history (see Fig.3).
Students then extract historical information from their aligned data matrices and use it to estimate relationships among the species from which the sequences were sampled. First, students are encouraged to visually inspect their alignments to appreciate that some regions are more conserved among sampled sequences while others appear more chaotic and variable. This illustrates the notion that mutations in some regions are not common and provides an opportunity to explore the concept of natural selection, eliminating unfavorable mutations (later in the postactivity discussion).
Additionally, students generate a topology using the sequences that they themselves gathered from GenBank. What will impress the students is the intuitiveness of the topology they reconstruct from their own sequence data.
Fig. 2 A section of the protocol
for the computer activity that explains how to retrieve protein sequences from GenBank. The protocol provides both step-by-step instructions and a judicious number of screenshots to guide even technically timid students through the process of gathering sequence data
42.Find the leftmost column in this block. Now hold down the shift key and select the little gray box above the column just to the left of this place.
43.This will select all of the amino acids in the not-so-well aligned region from the beginning up to this point.
44.From the Edit menu, select “Delete” and Poof! They’re gone.
45.Repeat this procedure for both ends of the alignment, if needed. (You’ll need to select and scroll starting from the opposite end to do this.)
Fig. 3 A section of the protocol
Although some students will not be familiar with all species represented in the tree, they will see that insects group with insects and mammals group with mammals (see Fig. 4). Organisms that are unfamiliar can easily be explored through Wikipedia (http://en.wikipedia.org/wiki/Main_ Page). The intuitiveness of the reconstructed topologies begs for an explanation, providing another opportunity for meaningful discussion, here of the concept that sequences contain historical information. The longer two species shared a common ancestry, the more features they will have in common, generally speaking. This is as true of molecular data as it is of anatomical or morphological data.
Next, students use their phylogenies to revisit the central discussion question. Here, they discover that the products of their computational analyses are, themselves, tools that can be used to answer questions. Student-generated topologies are used to evaluate the relative order in which diverse aspects of the human form arose in evolutionary
history. This can be done by locating the most recent common ancestor (MRCA) of all species that share an anatomical or morphological characteristic (e.g., body hair or a vertebral column) and plotting the trait in question onto the branch leading to that MRCA (see Fig.5). Here again, the orderliness of the topology and the clades (monophy-letic groups) resolved in it invite explanation. For example, why is it that all organisms that have four limbs form a clade? In our experience with both high school students and college students, the pattern is apparent and sufficiently impressive to propel meaningful postinquiry discussion.
Postactivity Discussion Upon completion of the hands-on computational exercise, students’ understanding of the significance of the steps they have executed may vary widely. Additionally, students who have an accurate understanding of the steps executed in the day's activities may not retain this information or may not have appreciable
Fig. 4 An example of a
phylo-genetic tree inferred using pro-tein sequence data. The number of species included in the phy-logenetic analysis will vary with student choice and initiative. However, a minimal-sized tree is illustrated here
Fig. 5 An illustration of how phylogenetic trees can be used to
answer evolutionary questions. Student-generated topologies (like the one illustrated in Fig. 4) are used to evaluate the relative order in which diverse aspects of the human form arose in evolutionary history.
confidence in their working notions of phylogenetic analysis. Accordingly, we consider it highly advisable to conduct a wrap-up discussion to explore and reinforce the concepts brought up or illustrated by the hands-on activity. Questions used to guide this discussion may vary, but we consider the following to be of greatest importance:
1. If you wish to know the evolutionary relationships among members of a group of species, what sources of evidence could you use?
2. What sorts of information can be extracted from sequence data? Medical? Genetic? Historical?
3. Why are some regions of the sequence alignments you generated more uniform, while others are more variable?
4. Why is it that groups like the insects or the mammals resolved as clades in the trees you reconstructed? 5. Why is it that all the organisms that have hair or
vertebral columns resolved as monophyletic groups? 6. If you had a copy of the MEGA_4U protocol in hand,
do you think you could explain to another student how to reconstruct a phylogenetic tree?
7. Do you think you could explain what a tree you infer says about the evolutionary history of organisms and their traits?
8. What other questions could be solved using this technology? For example, where did whales come from? Do all aquatic mammals form a clade? Do all warm-blooded or flighted animals form a clade? How many times did eyes evolve? What fish are the closest relatives of land animals? Did red-colored flowers evolve more than once? What bacteria are most closely related to Bacillus anthracis (which causes anthrax) orClostridum botulinum(which causes botu-lism) orTreponema pallidum(which causes syphilis)? Are their closest relatives equally dangerous? If not, how could we use this information to benefit humans?
Individual instructors can decide whether they wish to permit their students to develop research projects to apply and build upon the technical skills that they have just acquired. Projects of this type can reinforce students' understanding of the procedures involved and increase their sense of empowerment. To illustrate how one of the above questions could be developed into a student-driven, inquiry-based individual or group project, let us consider the first example, “Where did whales come from?” Each step that is needed in the process is illustrated in the step-by-step guide in theAppendix. Using MEGA, a student can visit the NCBI web site to recover a protein sequence from their favorite whale species (it is best to use protein
sequences that are at least 200 amino acids in length to provide a sufficient amount of data for the problem; cytochrome c oxidase subunit I, also known as COXI, works well here). MEGA can then use this sequence to run a BLAST search to probe GenBank for other similar sequences (it is best to use a protein sequence that recovers one or very few sequences per species to simplify tree reconstruction. If too many sequences per species are encountered at this step, select an alternative gene). Some related sequences will come from whale species, while others will come from land mammals (especially cows, deer, hippos, pigs, camels, horses, and other ungulates). Again, these sequences can be used to generate a phylogeny for all of the sampled species (the tree should be rooted with the most distantly related species, in this case the horse). The resultant tree can be inspected to reveal where whales arose (whales form a clade with dolphins and porpoises; this clade is the sister group to hippos, suggesting that hippos and whales had a common ancestor from which they both descend. As the whale–dolphin clade is the only group of ungulates with an exclusively aquatic lifestyle and without legs, this suggests that the loss of legs and the transition to water occurred along the branch leading to whales from the common ancestor of whales and hippos). Other questions listed above could be pursued in a similar manner using the protocol in the Appendix
to guide the inquiry process.
Once you have the skills, there is no limit to the intriguing evolutionary questions that you can solve!
Acknowledgments The authors wish to thank the College of Letters
and Science and the Undergraduate Research Foundation of the University of Wisconsin at Whitewater for financial support and the McNair Foundation and WiscAMP Alliance for financial support of Courtney P. Thompson. We also wish to thank Andi Kornowski and Melissa Schober for technical assistance during the project and the Peabody Museum of Natural History at Yale University for producing theDiscovering the Great Tree of Lifevideo. Additionally, we wish to thank the MEGA development team at the Center for Evolutionary Functional Genomics for producing MEGA 4.0. Finally, we thank Kristin Jenkins of the National Evolutionary Synthesis Center for encouragement and insightful advice during the development of this project.
Appendix 1—The MEGA_4U Step-By-Step Guide
Introduction
to do, you will learn to use some newly developed software that professional biologists use on a daily basis to compare proteins.
How to Retrieve Sequences over the Internet Using MEGA 4
1. Open MEGA 4
2. From the “Alignment” menu at the top of the MEGA 4 window, select “Open Saved Alignment Session.”
3. In the pop-up window, locate and open the file named “Project_MEGA_4.”
4. The Alignment Explorer window will open. Minimize this window for now and go back to the main MEGA window.
5. From the“Alignment”menu at the top of the MEGA 4 window, select“Query Databanks.”
6. The NCBI Entrez webpage will automatically open in a separate window.
7. Next to the“Search”prompt, select“Protein”near the top of the list.
8. Next to the “for” prompt, type “PAXNEB Pan Troglodytes” and click “Go” (btw, PAXNEB is a gene that controls eye development).
9. You will be taken to a flat file for the protein sequence.
10. Find the source organism for this protein sequence and record it on your sheet. It will be listed near the top of the flat file next to the word source.
11. Scroll down to the bottom of this file and you will see a 424 amino acid sequence (note: each letter repre-sents a different amino acid).
12. To add this sequence to your alignment, click the “Add to Alignment”button at the top of the window as shown here.
13. A popup window should confirm that the sequence was added successfully.
14. Next, you will use the protein sequence you just obtained to find similar protein sequences by per-forming a BLAST search.
15. Go to the top of the flat file and next to“Format”click “FASTA”as shown to the right.
16. The displayed sequence will begin with a header that starts with a “>”symbol and includes the name and accession number.
17. Highlight the sequence including the header and then copy it (Ctrl C).
18. Click the back arrow twice (or until you get back to the NCBI Entrez webpage).
19. From the left side of the Entrez webpage, select “BLAST”(under“Related Resources”).
20. Just below“Basic BLAST”select“protein blast.” 21. Now paste (Crtl V) your sequence into the window
just below“Enter Query Sequence.” 22. Click the blue“BLAST”button.
23. It may take several moments, but eventually a list of results will appear.
a. Note: A window may pop up with an error message. Click “OK.” This will not cause any problems, but may pop up frequently.
a. Tip: Use the find function to locate these organisms faster. You can do this by hitting the Ctrl + f keys at the same time and typing part of the organism's scientific name into the box that pops up. 25. Click on the accession number (in blue in the leftmost
column) and you will be taken to a flat file for the sequence.
26. Scroll down to the bottom of the report and observe the protein sequence. Add this sequence to the Alignment Explorer by clicking the “Add to Align-ment”button at the top of the screen. A box will pop up to let you know the sequence was successfully added. Click “OK.”
27. Copy down the scientific name and the common name of the organism on your worksheet. The organism's common and scientific names can be found at the top of the report to the right of “SOURCE.”
28. Click the back button on the browser and repeat steps 21 through 24 for the other organisms you wish to add to the Alignment Explorer. You'll only need one sequence from each organism.
29. Once you have added all the sequences you want, you may close the NCBI Sequence Viewer window.
Aligning Selected Sequences Using the Alignment Explorer
30. In the Alignment Explorer window, select “Save Session”from the Data menu and name your file. 31. From the Edit menu, select “Select All.” All of the
sequences will be highlighted in blue.
32. From the Alignment menu, select“Align by ClustalW.” 33. Under Pairwise Alignment in the Clustal Parameters window, change the gap opening penalty from 10 to 35 and the gap extension penalty from 0.1 to 0.75. (Side note: Gap penalties are used to prevent ClustalW from inserting an excessive number of gaps into the alignment it produces. The quantities used
here are based on many previous studies of protein alignments and are sufficient to achieve this goal). 34. Under Multiple Alignment, change the gap opening
penalty from 10 to 15 and the gap extension penalty from 0.2 to 0.3.
35. Click “OK” and MEGA 4 will align the sequences you selected using the ClustalW alignment algo-rithm (alignment places highly similar, conserved regions in vertical columns by inserting gaps be-tween and around them. Note: the gaps show up as hyphens).
36. In the Alignment Explorer, select any random letter or dash in the display window. This will cause all other amino acids in the alignment to adopt colors that reflect their biochemical properties.
37. Scroll through the alignment and note how strong-ly similar (conserved) regions have been placed into vertical alignment (the gaps were inserted to account for length differences among the sequences).
38. Sometimes, regions at the beginning or end of the alignment will be poorly aligned because the sequen-ces were too dissimilar in length. We should crop off these poorly aligned regions on the ends of the alignment before moving on.
39. To remove these areas, first go to the far left side of the alignment.
40. Look for a small gray box on the top of the first column in the alignment and select it.
41. Now scroll to the right until you encounter a large conserved block, which will look like several columns with few gaps in them.
42. Find the leftmost column in this block. Now hold down the shift key and select the little gray box above the column just to the left of this place.
44. From the Edit menu, select“Delete”and Poof! They are gone.
45. Repeat this procedure for both ends of the alignment, if needed (you will need to select and scroll starting from the opposite end to do this).
46. Now it is time to export the trimmed, aligned sequences as a MEGA file (with a“.meg”extension). From the Data menu, select “Export Alignment→-MEGA Format” and name the file. You will also be prompted to name your input data.
47. You are now finished with the Alignment Explorer and may close it.
48. When you close the Alignment Explorer, you will be asked if you would like to open the saved MEGA file. Select“Yes.”
Investigating the Aligned Data with the Sequence Data Explorer
49. When the MEGA file is opened, a new window will also be opened. This is the Sequence Data Explorer window; we will use it to examine the aligned data. 50. The data in the Sequence Data Explorer is shown in
black and white. To change it to a color-coded format, select “Color Cells”from the Display menu.
51. You will notice that there are amino acids, in the single letter code, running along the top row of the Sequence Data Explorer; these amino acids are known as the reference sequence.
52. Below this each cell will contain: (1) a“•”for a match to the reference sequence; (2) a letter, when an amino acid does not match the reference sequence; or (3) a“ -”wherever a gap has been inserted.
53. What we have done up to this point is to make an alignment of PaxNEB genes from many different animals.
54. Did you notice how some animals have PaxNEB genes that are more similar and others have PaxNEB genes that have more differences? This information will be used to do the next step....
Inferring a Phylogenetic Tree Using the Main MEGA 4 Window
55. Now go to the main MEGA 4 window.
56. From the Phylogeny menu, select “Construct Phylogeny→Maximum Parsimony (MP)....” 57. In the new window that opens, click on the tab that
says“Test of phylogeny.”
58. Select “Bootstrap” and accept the default number of replicates (which should be 500), then click on the red check mark.
59. Now select the button on the bottom of the Analysis Preferences box that says“Compute”and has a green check mark on it.
60. In a few moments, you will have an inferred phylogeny based on your aligned data set. This tree shape implies the fewest overall amino acid substitu-tions for your aligned protein sequences.
61. Root your tree by clicking on the rooting button (shown to the right) on the top of the left hand toolbar under the arrow and then clicking on the branch leading to the sea anemone. The sea anemone should now be at the bottom of the tree.
62. You can save a picture of the tree as follows: In the Tree Explorer, from the Image Menu, select “Save as TIFF file.”
63. Print this file and label where each of the following characteristics first appears on the tree.
a. Characteristics: body hair, amniotic egg, forelimbs and hindlimbs, hinged jaw, large brain, mammary gland, opposable thumb, left–right symmetry, placenta, muscles, nipples, and vertebrae.
64. You have just created a very powerful tool for exploring the history and diversification of a biolog-ical lineage!
References
MEGA webquest. http://www.nescent.org/media/NABT/mega_work shop.php.
Baggott GK, Rayne RC. The use of computer-based assessments in a field biology module. Bioscience Education eJournal. 2007;9:5. Baum DA, Offner S. Phylogenies & tree thinking. Am Biol Teach.
2008;70:222–9.
Baum DA, DeWitt Smith S, Donovan SSS. The tree-thinking challenge. Science. 2005;310:979–80.
Calie PJ, Lee S, Hicks EJ. The bioinformatic enhancement of exercises inDrosophilagenetics. Am Biol Teach. 2007;69:482–7. Gregory TR. Understanding Evolutionary Trees. Evolution: Education
and Outreach. 2008;1:121–37.
Klenjan LA, Seawright A, Elgar G, van Heyningen V. Characterization of a novel gene adjacent to PAX6, revealing synteny conservation with functional significance. Mamm Genome. 2002;13:102–7. Kumar S, Nei M, Dudley J, Tamura K. MEGA: a biologist-centric
software for evolutionary analysis of DNA and protein sequen-ces. Brief Bioinform. 2008;9:299–306.
Mueller J, Wood E, Willoughby T, Ross C, Specht J. Identifying discriminating variables between teachers who fully integrate computers and teachers with limited integration. Comput Educ. 2008;51:1523–37.
National Center for Biotechnology Information.http://www.ncbi.nlm. nih.gov/(web site through which GenBank is accessed). National Research Council. BIO2010: transforming undergraduate
education for future research biologists. Washington: National Academy Press; 2003.
National Research Council. Catalyzing inquiry at the interface of computing and biology. Washington: National Academy Press; 2005.
O'Hara RJ. Population thinking and tree thinking in systematics. Zool Scr. 1997;26:323–9.
Perry J, Meir E, Herron JC, Maruca S, Stal D. Evaluating two approaches to helping college students understand evolutionary trees through diagramming tasks. CBE–Life Sciences Education. 2008;7:193–201.
Rybarczyk B. Molecular evolution: the HIV envelope protein. Evolution: Education and Outreach. 2008a;1:179–83.
Rybarczyk B. Molecular evolution: HIV drug targets and resistance. Evolution: Education and Outreach. 2008b;1:184–8.
Steen LA. Math and Bio 2010: linking undergraduate disciplines. Washington: The Mathematical Association of America; 2005.
Syh-Jong J. Innovations in science teaching education: effects of integrating technology and team-teaching strategies. Comput Educ. 2008;51:646–59.
Tamura K, Dudley J, Nei M, Kumar S. MEGA4: molecular evolutionary genetic analysis (MEGA) software version 4.0. Mol Biol Evol. 2007;24:1596–9.
Discovering The Great Tree of Life. http://www.peabody.yale.edu/ exhibits/treeoflife/film_discovering.html.