Abstract
Background: Human interaction and population mobility determine the spatio-temporal course of the spread of an airborne disease. This research views such spreads as geo-social interaction problems, because population mobility connects different groups of people over geographical locations via which the viruses transmit. Previous research argued that geo-social interaction patterns identified from population movement data can provide great potential in designing effective pandemic mitigation. However, little work has been done to examine the effectiveness of design-ing control strategies takdesign-ing into account geo-social interaction patterns.
Methods: To address this gap, this research proposes a new framework for effective disease control; specifically this framework proposes that disease control strategies should start from identifying geo-social interaction patterns, designing effective control measures accordingly, and evaluating the efficacy of different control measures. This framework is used to structure design of a new visual analytic tool that consists of three components: a reorderable matrix for geo-social mixing patterns, agent-based epidemic models, and combined visualization methods.
Results: With real world human interaction data in a French primary school as a proof of concept, this research com-pares the efficacy of vaccination strategies between the spatial–social interaction patterns and the whole areas. The simulation results show that locally targeted vaccination has the potential to keep infection to a small number and prevent spread to other regions. At some small probability, the local control strategies will fail; in these cases other control strategies will be needed. This research further explores the impact of varying spatial–social scales on the success of local vaccination strategies. The results show that a proper spatial–social scale can help achieve the best control efficacy with a limited number of vaccines.
Conclusions: The case study shows how GS-EpiViz does support the design and testing of advanced control sce-narios in airborne disease (e.g., influenza). The geo-social patterns identified through exploring human interaction data can help target critical individuals, locations, and clusters of locations for disease control purposes. The varying spatial–social scales can help geographically and socially prioritize limited resources (e.g., vaccines).
Keywords: Geo-social interaction patterns, Varying spatial–social scales, Geo-social visual analytics, Agent-based epidemic models, Social network analysis, Epidemic control
© 2016 The Author(s). This article is distributed under the terms of the Creative Commons Attribution 4.0 International License (http://creativecommons.org/licenses/by/4.0/), which permits unrestricted use, distribution, and reproduction in any medium, provided you give appropriate credit to the original author(s) and the source, provide a link to the Creative Commons license, and indicate if changes were made. The Creative Commons Public Domain Dedication waiver (http://creativecommons.org/ publicdomain/zero/1.0/) applies to the data made available in this article, unless otherwise stated.
Background
Airborne infectious diseases (e.g., influenza) cause a huge cost to society. The 1918 influenza pandemic infected one-third of the world’s population and caused 50 million deaths worldwide [1]. Severe acute respiratory syndrome (SARS) and Swine/H1N1 Influenza had a dramatic
impact over most of the world in the twenty-first cen-tury [2, 3]. Although the world’s public health system has made tremendous efforts to detect, prepare, and control such epidemics, outbreaks of novel infections (e.g., the Middle East respiratory syndrome) continue to occur, exacerbated by the increasing urbanization and the mobility of contemporary society [4]. How to effectively control airborne infectious disease transmission is still an open question.
*Correspondence: [email protected]
This research views the spread of airborne diseases as geo-social interaction problems, because human interac-tion connects different groups of people over geographi-cal locations where the viruses transmit [5]. Research has demonstrated that a better understanding of the underly-ing network structure of a population at risk to infectious disease gives insight into disease dynamics and control strategies [6–9]. Guo [10] discovered geo-social interac-tion patterns in populainterac-tion mobility data which provide great potential in designing effective pandemic mitigation. However, little work has been done to evaluate the effec-tiveness of control strategy design using such geo-social interaction patterns [11]. Thus, this research proposes a new framework in terms of an effective disease control strategy that should start with identifying geo-social inter-action patterns, progresses to designing effective control measures according to those patterns, and ends with con-trol measure evaluation. This research designs and devel-ops a visual analytics tool using the framework described.
The visual analytics tool aims to achieve the following linked research objectives: (1) to develop visual analyt-ics methods representing complex human interaction data as geo-social forms that can facilitate the discovery of patterns in terms of disease spread and transmission control; (2) to develop methods to transform discovered patterns into reliable knowledge to support decision-making processes in epidemic control. The tool consists of three components: a reorderable matrix for geo-social mixing patterns, agent-based epidemic models, and com-bined visualization methods. The reorderable matrix allows users to identify useful geo-social interaction pat-terns in terms of disease transmission and control. The combined visual-computational methods allow users to transform the useful patterns into knowledge to design advanced control scenarios. The agent-based epidemic models allow users to evaluate the efficacy of the control scenarios when considering such geo-social interaction patterns.
Related research
In terms of the epidemic control, this study addresses decisions about vaccination, and implements various immunization strategies into the geo-social visual analyt-ics tool to allow the design and testing of advanced con-trol scenarios. A comprehensive review about all of the control strategies used in the previous research can be found in Lee et al. [12]. There is also research that inte-grates population-based epidemic models into visual analytics [13, 14].
Agent‑based epidemic models and vaccination strategies Contact networks are built by a series of individuals with social or spatial locations and links between those
individuals, which are fundamentally linked to the spatial spread of infectious disease [15]. Agent-based epidemic models are based on those contact networks, in which each individual is regarded as an agent and links between individuals represent possible infection channels [16, 17]. Each agent in the population is assigned to an infection status (e.g., susceptible, infectious, or recovered). Infec-tion disseminaInfec-tion over those contact networks depends on the likelihood of infection and individual-level human interactions [18]. At this point, network topology plays a significant role in the speed and extent of epidemic dynamics within a population [19]. Therefore, epidemi-ologists currently use agent-based epidemic models to simulate disease transmission and corresponding control scenarios on different network structures.
Given the limited supply of vaccines, vaccinations aim to achieve the highest efficacy through immunizing a fraction of the population [20, 21]. Current vaccina-tion strategies identify the targeted populavaccina-tion with the combinations of different network relationships among individuals [7, 22–25], and can be called as contact-based strategies. Some research has suggested that individu-als who are socially close to an infection should have a high priority to be vaccinated, such as family members or office mates of those individuals [26, 27]. Other research has reported that targeting individuals with a large number of social contacts for immunization is an effec-tive control strategy [24, 28], when community struc-ture is not strong. When community strucstruc-ture becomes stronger, targeting individuals bridging communities becomes more effective than targeting individuals with a large number of social contacts [29, 30]. Those studies have shown that disease transmissions can be controlled through immunizing a small number of the “proper” individuals in a social network [18, 20, 31].
Visual analytics in agent‑based epidemic models
Visual analytics aims to leverage the power of human rea-soning and computational analysis through visual inter-faces that enable analysts with domain knowledge to turn complex data into useful information and knowledge, and to support real-world decision-making [34]. Several studies have been done to integrate agent-based epidemic models with visual analytics tools, in order to allow users to enable analysts to set up parameters to simulate dis-ease transmission and design control scenarios. The Epi-Fast tool allows for a disease transmission and public health intervention simulation based on the explicit rep-resentation of social contact networks among individu-als [35, 36]. The epidemic models and interventions are pre-configured into the tool, so it does not allow users to explore the social contact networks to identify human interaction patterns to design advanced control scenar-ios. Guo [10] develops a visual analytics tool to allow the identification of human interaction patterns, but it does not support designing and evaluating the efficacy of con-trol scenarios considering the patterns.
The above discussion illustrates the new framework for an effective disease control processes. However, little work in visual analytics research areas has been done to evaluate the efficacy of control scenarios when consider-ing geo-social interaction patterns. Thus, this research aims to implement the new framework through a vis-ual analytics framework in order to fill the gap for both design of control strategies and visual analytics.
Methods Data
This study uses data on face-to-face interactions among 242 individuals including 232 children and ten teach-ers, across ten classes over 2 days (Thursday, October 1st 2009 and Friday, October 2nd 2009) in a French pri-mary school collected by Stehle et al. [37] (the data set is available at http://www.sociopatterns.org/datasets/ primary-school-cumulative-networks/). Stehle et al. [37] used a proximity-sensing infrastructure based on radiofrequency identification devices (RFID) [38] to
time is measured over an interval of 20 s that allows RFID to assess the proximity of two individuals with a probabil-ity over 99 % [38]. This study uses the data measured on the 2 days. This study converts the weighted edge table into the weighted networks among each individual. Each node has the attribute of classname to distinguish nodes from different communities. The data has been stored as comma-separated values (CSV) file format for input.
The high-resolution human interaction data is cho-sen for four reasons. First, the resolution of contact net-work data from other collections relevant for infectious disease transmission is too coarse for airborne disease transmission; these include surveys, socio-technological networks, mobile devices, and large scale human inter-action simulation models [7]. Second, our research aims to evaluate the effectiveness of control strategy using human interaction patterns and the high-resolution data used in this research can capture the CPIs relevant to disease transmission. Third, schools are considered to play an important role in infectious disease spread such as influenza mainly because of the high density of CPIs [39] and the high-resolution data provides an opportu-nity to design micro-interventions considering human interaction patterns and compare the outcomes of alter-native mitigation measures. Lastly, before the availabil-ity of high-resolution contact network data from school
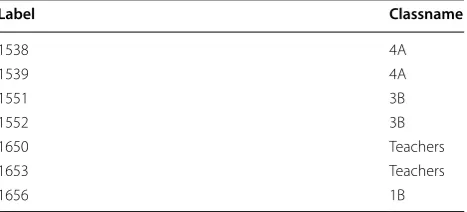
Table 1 Partial node table with two attributes: label indi-cates the id of each node, and classname indiindi-cates the cor-responding class groups, including grade level and class number for students and “Teachers” for teachers
Label Classname
1538 4A
1539 4A
1551 3B
1552 3B
1650 Teachers
1653 Teachers
environments, school closure has been proposed as an effective mitigation strategy [40]. Such measures however cause high associated social and economic costs. With the high-resolution contact network data, Gemmetto et al. [39] have suggested that targeted grade closure strategies can achieve results that are almost as effective as the school closure, at a much lower cost. The targeted grade closure strategies focus more on social aspects of network structures (i.e., the targeted class and its corre-sponding grade), but they do not take full advantage of the high-resolution data that can describe the real human spatial–social interaction patterns.
Geo‑social epidemic visual analytics (GS‑EpiViz)
This study treats each class as the basic local human interaction unit for two reasons: the network den-sity for within class interactions is significantly higher than between class interactions; it is practical to imple-ment control strategies based on spatial confineimple-ment (e.g., class, household, school). Based on the basic unit, the average time duration, i.e., total time duration/(the basic time measure unit of 20 s × all potential connec-tions), between two communities in the network is used to measure the social connection strength among com-munities. Communities with strong social connections imply highly spatial interactions caused by individual mobility via which infections can spread. Disease trans-missions that start from the individual-level within each class followed by the class-level transmissions via indi-vidual mobility can generate spatial–social interaction patterns in a hierarchical structure.
Visualizing the hierarchical structure of the social net-work in an appropriate way allows users to design vacci-nation strategies with regard to spatial–social interaction patterns. Network visualization has a rich history [41, 42] that has generated many variants on two primary categories of network visualization methods: node-link
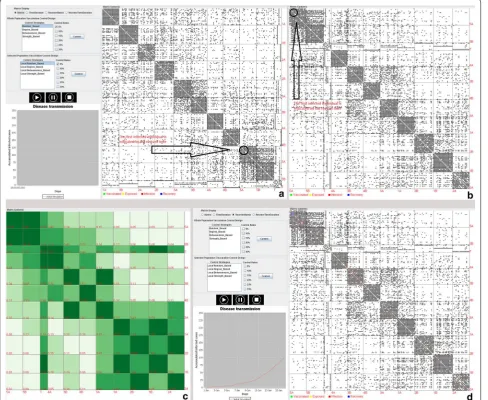
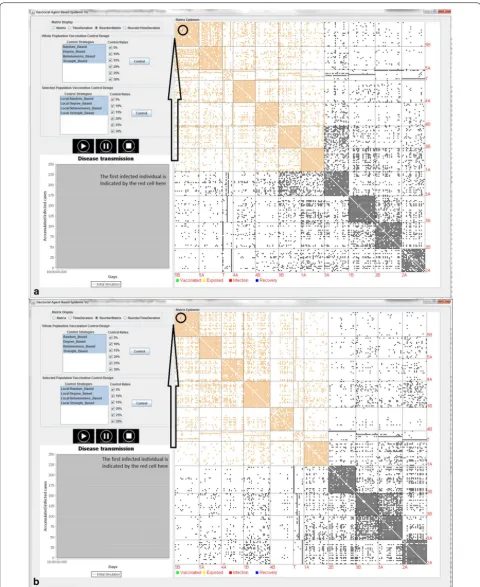
visualization and matrix-based visualization [43]. This study applies the matrix view to represent our network data (Fig. 1) for two reasons: a matrix view has the advantage to exhibit high-level structures (relationships between different communities) by finding the proper ordering of rows and columns [44]; the proper ordering of rows and columns in this application is determined by the communities in which infected cases are located. For example, the matrix view on the right in the Fig. 1a displays the interaction data with rows and columns organized by grade and class from 1st grade class A at the top left to 5th grade class B in the lower right. The first infected individual in the scenario is in grade/class 5A. Figure 1b reorders all classes in the matrix view: it puts group 5A, with the first infected case, on the top left fol-lowed by other groups according to the social connection strength from the highest to the lowest. The reordering process is of O(m + k2) complexity in which m represents
the total number of edges and k represents the number of classes. The green cells along the diagonal from the top left to the bottom right in matrix views in Fig. 1c, d shows the within-community interactions, whereas all other cells show the spatial interactions among differ-ent communities. The interactive view allows users to dynamically adjust the reordering sequence according to the positions of infection sources and social connection strength between the classes with the infection sources and all other classes. In this way, users can identify the clusters of communities with the strongest spatial–social interactions and then focus vaccination or other preven-tative measures within those communities rather than applying the response uniformly to all communities. This targeted response is potentially more efficient (in overall use of resources) and more effective (in minimizing the proportion of individuals who are infected).
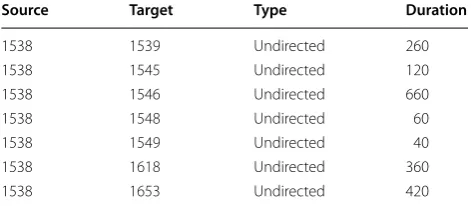
In addition to representing human interaction net-work data in the matrix view to support control strategy design, this tool also implements agent-based epidemic models from a scratch to simulate disease transmis-sion and different control scenarios. Specifically, each individual in our data set is considered as an agent who is described as one of four disease states: susceptible, exposed, infectious, or recovered (SEIR) [45]; this is so-called SEIR agent-based modelling. A single influenza infection is randomly introduced into the network with all other initially susceptible individuals. Influenza is cho-sen as an exemplar because it is a common infectious disease with reasonably well known transmission charac-teristics. This study assumes that transmission can only occur during the day time, and only on weekdays (thus when the individuals involved are at the school). Though this simplifying assumption is not realistic, it allows an analyst to analyze the disease spread and design control Table 2 Partial edge table with four columns: Source
indi-cates the id of source node, Target indiindi-cates the id of Tar-get node, Type indicates that all edges are undirected, Duration indicates that the cumulative time between two nodes measured in seconds within 1 day
Source Target Type Duration
1538 1539 Undirected 260
1538 1545 Undirected 120
1538 1546 Undirected 660
1538 1548 Undirected 60
1538 1549 Undirected 40
1538 1618 Undirected 360
scenarios starting from one single infected case without considering multiple introductions of infected cases.
After coming in contact with an infection, a suscepti-ble individual has a transmission probability 0.0015 per 20 s of contact (basic duration measurement unit) to be infected. This value has been chosen because it gener-ates values of R0 (the basic reproductive number)
con-sistent with observed R0 of pandemic influenza (0.9–2.1)
in previous studies [46, 47]. R0 is defined as the average
number of secondary cases generated in a susceptible population [48]. The calculation of R0 in this case study
follows the steps: randomly generate one new infected case 100 times, simulate disease transmissions 100 times for each new infected case within the network according to parameters from the Table 3, and then calculate aver-age R0 for each simulation. Both of the derived R0 based
on the two networks respectively are approximately equal to 1.8–1.9 which falls into the observed R0 pandemic
influenza (0.9–2.1). Upon infection, the individual enters into the exposed period (infected but not infectious). The mean exposed days, 3 days, will be used in this simula-tion [49]. After the exposed period, an exposed individual will become symptomatic and infectious. The infectious period used in this project is 7 days, the mean days for patients who recovered [49]. This study assumes that individuals cannot be infected again after recovery. Fig-ure 1d shows a simulated influenza infection accord-ing to the parameters in the Table 3. The tool can be applied to study other emerging infectious diseases (e.g., measles) directly with the input of their corresponding parameters.
In terms of control strategies, GS-EpiViz allows users to design four vaccination strategies: random-based, degree-based, betweenness-based, and strength-based vaccination strategies; these are selected because they are the most typical ones used to compare effective-ness of vaccination strategies based on different network structures [7, 22, 29]. The random-based vaccination strategy randomly identifies a fraction of the population to vaccinate. The basic idea of degree-based, between-ness-based, and strength-based strategies is first to rank the importance of individuals and then vaccinate the individuals from highest importance to lowest. The degree-based vaccination strategy ranks individuals according to the number of contacts during the day of measurement for vaccination. The betweenness-based vaccination strategy prioritizes individuals according to their betweenness centrality [50], capturing the extent to which a particular node lies on the bridge among different communities. The strength-based vaccina-tion strategy ranks individuals according to their total time exposed to others during the day of measurement for vaccination. Given that the vaccination results are sensitive to vaccination rates, the tool provides a vari-ety of options in terms of the percentage of the popula-tion vaccinated: 5, 10, 15, 20, 25, and 30 %. To compare the effectiveness of vaccination strategies based on the
whole population and local human geo-social interac-tions, this tool provides two panels on the left of the tool: Whole Population Control Design and Selected Popula-tion Control Design. The former panel allows users to select control strategies and control rates based on the whole population, whereas the latter panel allows users to select control strategies and control rates based on the geo-social interaction patterns (orange area in the Fig. 2).
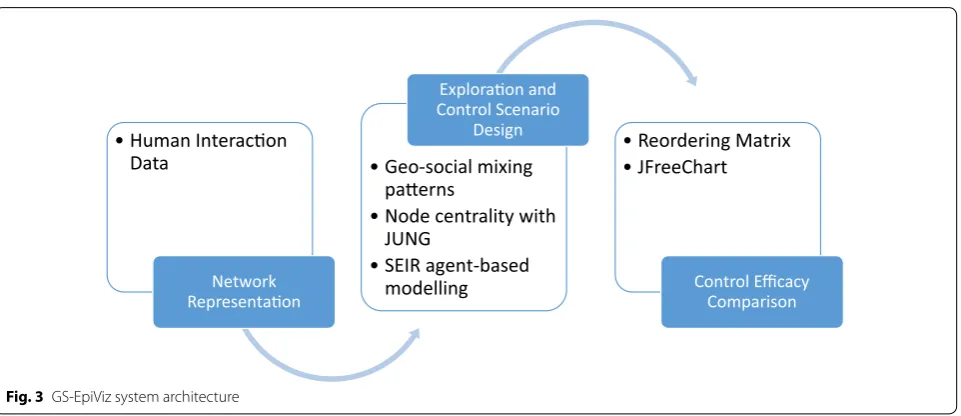
Vaccination strategies are applied at the beginning of the spread of influenza in the network. The percent of the infected population and the spatial–social extent of infection are used to evaluate the efficacy of those strat-egies. There are two networks, four different control regions, four strategies, and six vaccination rates, yield-ing 192(2*4*4*4) combinations to simulate. The efficacy of vaccination strategies for each combination is esti-mated for 10,000 simulation runs, resulting in a total of 1,920,000 epidemic simulation runs. GS-EpiViz is devel-oped with JAVA for a cross-platform purpose and the sys-tem architecture is illustrated in Fig. 3. Geo-social mixing patterns are identified from human interaction network data. Java universal network/graph framework (JUNG) is used to calculate node centrality (i.e., degree, between-ness) based on human interaction data. SEIR agent-based modelling is implemented to simulate disease transmis-sion and control scenarios. Reordering matrix is imple-mented to identify and display geo-social mixing patterns of the data and simulation results from SEIR agent-based modelling. JFreeChart is used to display the vaccination efficacy results.
Results
This study aims to compare the efficacy of vaccination strategies between the local geo-social interaction pat-terns and the whole areas based on the real world net-works provided by the school interaction data. The better vaccination strategies are expected to generate a lower number of infections. Another measure of how well we can contain the epidemic locally is the number of infected cases occurring outside the selected areas. If this number is zero, the local control scenarios with the selected areas are considered successfully. Otherwise, the local control scenarios are considered as failures. Figure 2 shows the design of eight vaccination strategies with six different control rates in the two networks, Thursday, October 1st 2009 in (a) and Friday, October 2nd 2009 in (b). Two net-works have been reordered according to the strength of social connections to the classroom with the first infected case. The local control areas are highlighted in orange. The efficacy of eight vaccination strategies in the two net-works is evaluated through infection percentage and the spatial–social extent of infection as described below. Table 3 Basic simulation parameters for influenza
diffu-sion
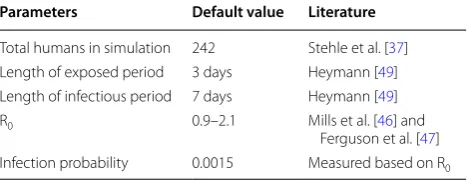
Parameters Default value Literature
Total humans in simulation 242 Stehle et al. [37] Length of exposed period 3 days Heymann [49] Length of infectious period 7 days Heymann [49]
R0 0.9–2.1 Mills et al. [46] and
Vaccination strategies in terms of infection percentage The better vaccination strategies in terms of infection percentage are expected to generate a smaller number of infections. Figure 4a, b shows that all of the eight vac-cination strategies can produce a decreasing number of infections in proportion to the increasing vaccina-tion fracvaccina-tions. The random-based vaccinavaccina-tion strategy produces the highest number of infections, followed by the random-based vaccination strategy with the local selected control areas in Fig. 2a, b. The other three pairs: degree-based, betweenness-based, and strength-based vaccination strategies exhibit the same pattern: the three strategies with the local selected control areas outper-form those strategies with the whole area, respectively. The explanation for the pattern is illustrated in Figs. 5 and 6. Figure 5 displays the percentage of the local
control success for the four local vaccination strategies within 10,000 simulation runs. As the vaccination frac-tions increase, all of the four local vaccination strategies can produce a higher percentage of the local control suc-cess, but to different degrees. In addition, when the local control scenarios are successful, they can produce a sig-nificantly lower number of infected cases (Fig. 6). Those results show that when the vaccination fraction reaches a relatively high level (i.e., 30 %) with the selected control areas, the disease transmission can be confined locally at a very high percentage (i.e., 90–95 %), resulting in only a small number of infections (i.e., 2–5). Figures 5 and 6 shows that the former can stop the disease transmis-sion locally at a certain probability (Fig. 5), which also results in the lower number of infections (Fig. 6). Figure 4 shows that the disease transmission cannot be confined
Human Interacon Data
Network Representaon
Geo-social mixing paerns
Node centrality with JUNG
SEIR agent-based modelling
Exploraon and Control Scenario
Design Reordering Matrix
JFreeChart
Control Efficacy Comparison
Fig. 3 GS-EpiViz system architecture
locally at 100 %, which also results in the high number of infections (Fig. 7). For example, when the local vacci-nation fraction in terms of degree-based, betweenness-based and strength-betweenness-based control strategies reaches to 30 %, a high number of individuals (i.e., 25–45) in Fig. 7 are infected at a very low percentage (5–10 %) in Fig. 5. Those results suggest that containing disease outbreaks locally should be highly recommended, but the follow-up control strategies (e.g., vaccination) are needed if the local control strategies are not successful.
Vaccination strategies in terms of spatial–social extent of infection
From a spatial–social perspective, effective vaccination strategies with the selected areas are expected to confine
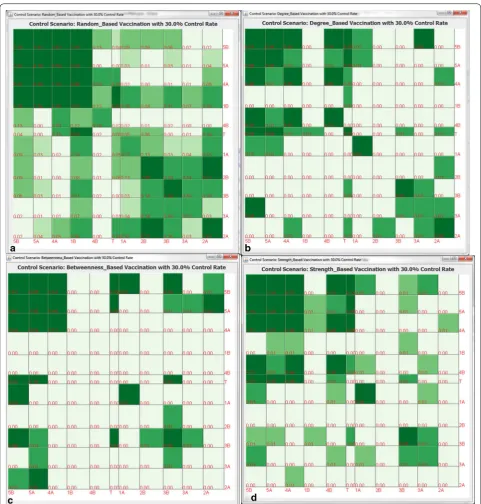
the disease outbreak locally. This section only displays the simulation results with the second day, Friday, Octo-ber 2nd 2009, because the 2 days’ results will generate the same conclusion as below. Figures 8 and 9 compare spatial–social extent of affected areas between the whole area and the selected area control scenarios with 30 % vaccination rate. The average number of infections based on the simulation results is displayed on each cell in each matrix. Within the selected areas in each matrix (in pur-ple square), local control scenarios can produce a much lower number of infections (Fig. 9) compared to the whole area control scenarios (Fig. 8). This is because plac-ing the same amount of vaccines within a smaller spa-tial–social extent of areas would cause a lower number of infections locally. However, outside the selected areas,
Fig. 5 The percentage of the local control success for four local vaccination strategies within 10,000 simulation runs in two networks, Thursday, October 1st 2009 in a and Friday, October 2nd 2009 in b. The Y axis represents the percentage of the local containment success, and the X axis rep-resents the vaccination fraction. Four local vaccination strategies are represented by four curves in different colors and shapes, as the legend shows at the bottom
there are a much larger number of infections (Fig. 9) compared to the whole area control scenarios (Fig. 8). Each pie chart in Fig. 9 shows the number of local control successes versus the number of local control failures with 10,000 simulation runs. Each bar chart in Fig. 9 repre-sents the average number of infections between the local control success and local control failure. It shows that there is a high probability (see pie chart) to contain the disease outbreak locally with 30 % vaccination rate, but a larger disease outbreak would occur (see bar chart) if the local control fails at a low probability. Those results suggest that if the local control scenarios fail, new con-trol strategies have to be implemented to avoid disease outbreaks outside the selected control areas. Therefore, the efficacy of vaccination strategies in terms of spatial– social extent of infection also suggests that local vacci-nation control would be a good control strategy. On the other hand, this strategy should be complemented with other control strategies if the local ones are not success-ful at a low likelihood.
Vaccination strategies in terms of varying spatial–social scales
This study further explores the impact of varying spatial– social scales on the success of local vaccination strate-gies. This section displays the simulation results with the local degree-based vaccination strategies on the first day, Thursday, October 1st 2009. Figure 10 compares simu-lation results with varying spatial–social scales (in the purple square) with a 20 % vaccination rate. Within the increasing spatial–social scales, the number of local con-trol successes has a gradual increase from 55 % in Fig. 10a to 63 % in Fig. 10b to 86 % in Fig. 10c and decreases to 80 % in Fig. 10d. It implies that a proper spatial–social
scale can help achieve the best control efficacy with a limited number of vaccinations. One explanation is that a certain number of vaccinations have its upper limit of susceptible population pool. The number of local con-trol successes increases until it reaches the upper limit, whereas the number of local control successes decreases after it goes beyond the limit.
Conclusions and implications
This research proposes a new framework in terms of effective disease control that starts from identifying geo-social interaction patterns, followed by designing effec-tive control measures accordingly, and then evaluates the efficacy of different control measures. This framework is used to structure design of a new visual analytic tool: GS-EpiViz. This tool first identifies the geo-social inter-action patterns applicable to the design/plan disease containment strategies before disease outbreak occurs, then implements the method and agent-based epidemic models into a visually interactive environment. With real world human interaction data as a case study, this research compares the efficacy of vaccination strategies between the spatial–social interaction patterns and the whole areas. The simulation results show that the con-trol strategies based on spatial–social interaction pat-terns can lead to a significant reduction of epidemic size in terms of total number and spatial–social extent at a very high likelihood within the school environment. This research also gains new insights into how a proper spa-tial–social scale matters in terms of control efficacy with a limited number of vaccinations.
The success of vaccine strategies depends on early detection, efficient targeting, and prioritizing high risk individuals; this is essential because of the limited
resources and time [47, 51]. This study provides valu-able insights for designing effective control strategies that consider the geo-social interaction patterns and by doing so help meet the above challenges. Our approach dem-onstrates that the geo-social interaction patterns can help identify critical individuals, locations, and clusters of
locations for disease control purposes. Geo-social inter-action patterns should be used to implement control pol-icies because simple distance threshold (e.g., 5 km) [32] cannot capture the most likely and complicated disease transmission processes. The varying spatial–social scales can help geographically and socially prioritize limited
Fig. 9 The spatial–social patterns of simulated vaccination strategies with 30 % vaccination rate based on the selected areas (purple square) after reordering with the average number of infections in each cell in the second day network, Friday, October 2nd 2009. The number of infections within the selected areas is achieved through calculating the sum of infected individuals on each of the 10,000 runs and then dividing by 10,000 runs. The average number of infections outside the selected areas is calculated through dividing by the number of local control failures, because the number of infections is zero when the local control is successful. a The random-based vaccination strategy, b the degree-based vaccination strategy,
Fig. 10 The spatial–social patterns of local degree based vaccination strategies with 20 % vaccination rate with varying spatial–social scales (in the purple square) after reordering with the average number of infections in each cell in the first day network, Thursday, October 1st 2009. The number of infections within the selected areas is achieved through calculating the sum of infected individuals on each of the 10,000 runs and then dividing by 10,000 runs. The average number of infections outside the selected areas is calculated through dividing by the number of local control.
resources (e.g., vaccines) in time critical situations during an outbreak. After the first infections are reported, the varying spatial–social scales can help identify a proper scale for immediate actions. The distribution of avail-able vaccines within the proper scale can also give an idea how likely it is that the infection can be confined within the scale. Based on the likelihood, policy makers can have a priority list according to limited resources and time to prepare for the situation when the infection cannot be confined within the scale.
Though the real, high-resolution human interaction data analysed here provides a proof of concept to study the impact of geo-social mixing patterns and scales on infectious disease control, three major limitations of this research are important to mention. First, the data used in this research measure the frequency of spatial prox-imity between individuals, but they do not include spa-tial topology information (e.g., relative position of the classrooms). Such spatial information has mostly been used to build human interaction network such as assign-ing individuals to home or workplace accordassign-ing to their relative positions [36, 52]. After the human interaction network is built, infectious disease simulation is based on the network topology rather than spatial topology. Thus, the agent-based simulation processes based on our data are similar as other models with spatial topol-ogy information. Second, though vaccination strategies we discussed in this research are novel, we only tested them with one specific dataset corresponding to one particular school. High resolution data collected from different schools or different countries [7] can capture varying human interaction patterns within the classes and among different classes. Lastly, though the high resolution data can capture the real human interaction patterns for epidemic analysis research purpose, its limi-tation comes from relatively small network size.
The above limitations illustrate several future research directions in terms of GS-EpiViz development with more complex human interaction data. First, insights could be achieved by comparing effectiveness of the proposed strategies using such high-resolution data describing the real spatial–social interaction patterns from other schools or countries. Second, It would repre-sent an important step to apply the proposed strategies to human interaction data at a larger scale (e.g., urban). In reality, each classroom in this study can be viewed as one geographical location (e.g., workplace, home) at larger spatial scales (e.g., cities), whereas human move-ment among different classrooms can be viewed as spa-tial interactions among geographical locations. Gao and Bian [53] found that human interaction network within a metropolitan community is spatially clustered. Thus, the effectiveness of our vaccination strategies based on
the school data with the high density of CPIs implies that those strategies are very likely to be effective to control disease spread with larger scale spatial–social network data with a large number of individuals move within and between communities on a daily basis such as urban areas [22]. We expect that the strategies would be more effective to control infectious disease trans-missions with larger scale spatial–social network with weak connections between sparse population distribu-tions such as rural areas [22]. In terms of network size, the space complexity in GS-EpiViz is O(m + n + k2), in
which m represents the total number of edges, n repre-sents the number of nodes, and k reprerepre-sents the num-ber of communities. Then it would not be a problem for GS-EpiViz to deal with large data sets (up to 1 GB). For example, a network with 1,000,000 nodes and 5,000,000 edges and 1000 communities requires approximately 1 gigabytes of internal memory for handling the data all at once.
In summary, infectious disease transmission is deter-mined by the mixed interactions of the social and spatial relationships among individuals [17, 54]. Either relation-ship can play an important role in exploring proper vac-cination strategies. Social or spatial relationships, respectively, have received substantial attention, while the mixed interactions of the social and spatial relation-ships have often been under-studied [22]. To our knowl-edge, this research is the first attempt to evaluate the efficacy of control scenarios when considering geo-social interaction patterns and to bring the concept of scale into the design of control scenarios. GS-EpiViz facilitates the vaccination strategy evaluation with local spatial–social interaction patterns and varying spatial–social scales. The results provide insights into community-based plan-ning within school environment and potentially at larger spatial scale (e.g., urban, rural) for controlling emerging air-borne infectious diseases.
Authors’ information
WL is a Postdoctoral Fellow of Geography Department at University of Califor-nia, Santa Barbara. He was a Postdoctoral Research Assistant of Computing, Informatics, and Decision Systems Engineering at Arizona State University. He received his Ph.D. from Geography Department at Penn State University. His research focuses on developing new geo-social visual analytical methods to take advantage of human intuition, decision-making ability, and compu-tational power to facilitate, and enable insight gaining process, as well as aid decision-making in related applications (e.g., international trade, public health).
Acknowledgements
I thank Alan M. MacEachren and Susan Cassels for their continuous support and valuable advice to this project. I also thank for the SocioPatterns collabo-ration to distribute the data used in this study: http://www.sociopatterns.org.
Competing interests
Received: 7 April 2016 Accepted: 3 August 2016
References
1. Taubenberger J, Morens D. 1918 influenza: the mother of all pandemics. Emerg Infect Dis. 2006;12(1):15–22. doi:10.3201/eid1209.05-0979. 2. Leung G, Hedley A, Ho L, Chau P, Wong I, Thach T, Ghani A,
Don-nelly C, Fraser C, Riley S. The epidemiology of severe acute respiratory syndrome in the 2003 Hong Kong epidemic: an analysis of all 1755 patients. Ann Intern Med. 2004;141(9):662–73. doi:10.7326/0003-4819-141-9-200411020-00006.
3. Fraser C, Donnelly C, Cauchemez S, Hanage W, Van Kerkhove M, Hollings-worth T, Griffin J, Baggaley R, Jenkins H, Lyons E. Pandemic potential of a strain of influenza A (H1N1): early findings. Science. 2009;324(5934):1557– 61. doi:10.1126/science.1176062.
4. Anderson R, Fraser C, Ghani A, Donnelly C, Riley S, Ferguson N, Leung G, Lam T, Hedley A. Epidemiology, transmission dynamics and control of SARS: the 2002–2003 epidemic. Philos Trans R Soc B Biol Sci. 2004;359(1447):1091–105. doi:10.1098/rstb.2004.1490. 5. Meyers L, Pourbohloul B, Newman M, Skowronski D, Brunham R.
Network theory and SARS: predicting outbreak diversity. J Theor Biol. 2005;232(1):71–81. doi:10.1016/j.jtbi.2004.07.026.
6. Read J, Eames K, Edmunds W. Dynamic social networks and the implications for the spread of infectious disease. J R Soc Interface. 2008;5(26):1001–7. doi:10.1098/rsif.2008.0013.
7. Salathé M, Kazandjieva M, Lee JW, Levis P, Feldman MW, Jones JH. A high-resolution human contact network for infectious disease transmission. Proc Natl Acad Sci. 2010;107(51):22020–5. doi:10.1073/pnas.1009094108. 8. Meyers LA, Newman M, Martin M, Schrag S. Applying network theory
to epidemics: control measures for Mycoplasma pneumoniae outbreaks. Emerg Infect Dis. 2003;9(2):204–10.
9. Eubank S, Kumar VSA, Marathe MV, Srinivasan A, Wang N. Structure of social contact networks and their impact on epidemics. DIMACS Ser Discrete Math Theor Comput Sci. 2006;70:179–85.
10. Guo D. Visual analytics of spatial interaction patterns for pan-demic decision support. Int J Geogr Inf Sci. 2007;21(8):859–77. doi:10.1080/13658810701349037.
11. Luo W, MacEachren AM. Geo-social visual analytics. J Spat Inf Sci. 2014;8:27–66. doi:10.5311/JOSIS.2014.8.139.
12. Lee VJ, Lye DC, Wilder-Smith A. Combination strategies for pandemic influenza response—a systematic review of mathematical modeling studies. BMC Med. 2009;7(1):76. doi:10.1186/1741-7015-7-76.
13. Broeck WV, Gioannini C, Gonçalves B, Quaggiotto M, Colizza V, Vespignani A. The GLEaMviz computational tool, a publicly available software to explore realistic epidemic spreading scenarios at the global scale. BMC Infect Dis. 2011;11(1):37. doi:10.1186/1471-2334-11-37.
14. Maciejewski R, Livengood P, Rudolph S, Collins TF, Ebert DS, Brigantic RT, Corley CD, Muller GA, Sanders SW. A pandemic influenza modeling and visualization tool. J Vis Lang Comput. 2011;22(4):268–78. doi:10.1016/j. jvlc.2011.04.002.
all can? Science. 2010;312(5775):854–5. doi:10.1126/science.1125347. 22. Mao L, Bian L. A dynamic network with individual mobility for
designing vaccination strategies. Trans GIS. 2010;14(4):533–45. doi:10.1111/j.1467-9671.2010.01201.x.
23. Masuda N. Immunization of networks with community structure. New J Phys. 2009;11:123018. doi:10.1088/1367-2630/11/12/123018.
24. Zanette DH, Kuperman M. Effects of immunization in small-world epidemics. Phys A. 2002;309(3–4):445–52. doi:10.1016/ S0378-4371(02)00618-0.
25. Carrat F, Luong J, Lao H, Sallé AV, Lajaunie C, Wackernagel H. A ‘small-world-like’ model for comparing interventions aimed at preventing and controlling influenza pandemics. BMC Med. 2006;4(1):26.
26. Kiss IZ, Green DM, Kao RR. Disease contact tracing in random and clustered networks. Proc R Soc Lond B Biol Sci. 2005;272(1570):1407–14. doi:10.1098/rspb.2005.3092.
27. Rhodes C, Anderson RM. Epidemic thresholds and vaccination in a lattice model of disease spread. Theor Popul Biol. 1997;52(2):101–18. doi:10.1006/tpbi.1997.1323.
28. Pastor-Satorras R, Vespignani A. Immunization of complex networks. Phys Rev E. 2002;65(3):036104. doi:10.1103/PhysRevE.65.036104.
29. Salathé M, Jones J. Dynamics and control of diseases in networks with community structure. PLoS Comput Biol. 2010;6(4):e1000736. doi:10.1371/journal.pcbi.1000736.
30. Zanette DH, Kuperman M. Effects of immunization in small-world epi-demics. Phys A. 2002;309(3):445–52. doi:10.1016/S0378-4371(02)00618-0. 31. Burke DS, Epstein JM, Cummings DA, Parker JI, Cline KC, Singa RM,
Chakravarty S. Individual-based computational modeling of smallpox epidemic control strategies. Acad Emerg Med. 2006;13(11):1142–9. 32. Ferguson N, Cummings D, Fraser C, Cajka J, Cooley P, Burke D. Strategies
for mitigating an influenza pandemic. Nature. 2006;442(7101):448–52. doi:10.1038/nature04795.
33. Mao L, Bian L. Spatial-temporal transmission of influenza and its health risks in an urbanized area. Comput Environ Urban Syst. 2010;34(3):204–15. doi:10.1016/j.compenvurbsys.2010.03.004.
34. Thomas J, Cook K. Illuminating the path: the research and development agenda for visual analytics. Washington, DC: IEEE Computer Society; 2005. 35. Bisset KR, Chen J, Feng X, Kumar V, Marathe MV. EpiFast: a fast
algo-rithm for large scale realistic epidemic simulations on distributed memory systems. In: Proceedings of the 23rd international confer-ence on supercomputing, New York, NY, USA; 2009. ACM. p. 430–9. doi:10.1145/1542275.1542336.
36. Bisset K, Marathe M. A cyber environment to support pandemic planning and response. DOE SciDAC Rev Mag. 2009;13:36–47.
37. Stehle J, Voirin N, Barrat A, Cattuto C, Isella L, Pinton JF, Quaggiotto M, Van Den Broeck W, Regis C, Lina B. High-resolution measurements of face-to-face contact patterns in a primary school. PLoS One. 2011;6(8):e23176. doi:10.1371/journal.pone.0023176.
38. Cattuto C, Van den Broeck W, Barrat A, Colizza V, Pinton J-F, Vespignani A. Dynamics of person-to-person interactions from distributed RFID sensor networks. PLoS One. 2010;5(7):e11596. doi:10.1371/journal.pone.0011596. 39. Gemmetto V, Barrat A, Cattuto C. Mitigation of infectious disease
• We accept pre-submission inquiries
• Our selector tool helps you to find the most relevant journal
• We provide round the clock customer support
• Convenient online submission
• Thorough peer review
• Inclusion in PubMed and all major indexing services
• Maximum visibility for your research
Submit your manuscript at www.biomedcentral.com/submit
Submit your next manuscript to BioMed Central
and we will help you at every step:
40. Halloran ME, Ferguson NM, Eubank S, Longini IM, Cummings DAT, Lewis B, Xu S, Fraser C, Vullikanti A, Germann TC. Modeling targeted layered containment of an influenza pandemic in the United States. Proc Natl Acad Sci. 2008;105(12):4639–44. doi:10.1073/pnas.0706849105. 41. Di Battista G, Eades P, Tamassia R, Tollis IG. Graph drawing: algorithms for
the visualization of graphs. Upper Saddle River: Prentice-Hall; 1998. 42. Herman I, Melançon G, Marshall M. Graph visualization and naviga-tion in informanaviga-tion visualizanaviga-tion: a survey. IEEE Trans Vis Comput Graph. 2000;6(1):24–43. doi:10.1109/2945.841119.
43. Henry N, Fekete J, McGuffin M. NodeTrix: a hybrid visualization of social networks. IEEE Trans Vis Comput Graph. 2007;13(6):1302–9. doi:10.1109/ TVCG.2007.70582.
44. Bertin J, Barbut M. Sémiologie graphique: les diagrammes, les réseaux, les cartes. Paris: Editions de l’Ecole des Hautes Etudes en Sciences; 1967. 45. Anderson R, May R. Infectious diseases of humans: dynamics and control.
Oxford: Oxford University Press; 1992.
46. Mills CE, Robins JM, Lipsitch M. Transmissibility of 1918 pandemic influ-enza. Nature. 2004;432(7019):904–6. doi:10.1038/nature03063. 47. Ferguson N, Cummings D, Cauchemez S, Fraser C, Riley S, Meeyai A,
Iam-sirithaworn S, Burke D. Strategies for containing an emerging influenza pandemic in Southeast Asia. Nature. 2005;437(7056):209–14. doi:10.1038/ nature04017.
48. Diekmann O, Heesterbeek J, Metz JA. On the definition and the computa-tion of the basic reproduccomputa-tion ratio R0 in models for infectious diseases in
heterogeneous populations. J Math Biol. 1990;28(4):365–82. doi:10.1007/ BF00178324.
49. Heymann D. Control of communicable diseases manual. 18th ed. Washington, DC: American Public Health Association; 2004. doi:10.2105/ CCDM.2745.
50. Freeman LC. Centrality in social networks conceptual clarification. Soc Netw. 1978;1(3):215–39. doi:10.1016/0378-8733(78)90021-7. 51. Eubank S, Guclu H, Anil Kumar V, Marathe M, Srinivasan A, Toroczkai Z,
Wang N. Modelling disease outbreaks in realistic urban social networks. Nature. 2004;429(6988):180–4. doi:10.1038/nature02541.
52. Apolloni A, Kumar VSA, Marathe MV, Swarup S. Computational epidemiol-ogy in a connected world. Computer. 2009;42(12):83–6. doi:10.1109/ MC.2009.386.
53. Gao P, Bian L. Scale effects on spatially embedded contact net-works. Comput Environ Urban Syst. 2016;59:142–51. doi:10.1016/j. compenvurbsys.2016.06.002.