Vol. 31, No. 1, March, 2012, pp. 17–24. Copyrightc2012 Faculty of Engineering, University of Nigeria. ISSN 1115-8443
EFFECT OF MULTI-RESPONSE PERFORMANCE
CHARACTERISTICS ON OPTIMUM PLASMA ARC WELDING
PROCESS PARAMETERS
J.I. Achebo
Department of Production Engineering, University of Benin, Benin City, Edo State. Email: [email protected]
Abstract
A significant number of failures that occur in metal structures usually occur first at welded joints. Weldments are usually of lower strength than the parent metal because of certain factors such as the presence of pores due to entrapped gases, overheat treatment due to prolonged welding, brittleness of the weld as a result of weld metal oxidization, and possibly poor quality welding from operators’ lack of skills. However, these inadequa-cies can be corrected by altering the process parameters aimed at optimizing the welding. In this research, the process parameters were optimized by applying the Taguchi method along with the Grey relational analysis. From this analysis, an optimum combination of process parameters is obtained. The optimum combination of A1B3C3D1; a torch stand-off of 4.5mm, welding current of 220A, welding speed of 500 mm/min and plasma flow rate of 2.2 litres/min, were the optimum plasma arc welding process parameter combina-tion obtained in this study. The resulting optimal combinacombina-tion was further investigated by applying the Analysis of Variance, ANOVA, to show which welding process param-eter significantly affected the performance characteristic of the welding process. From the ANOVA, the torch stand-off, welding speed and plasma flow rate were found to be the primary contributing factors that greatly influence welding performance whereas the welding current was considered a secondary factor. The confirmation test shows that the proposed optimum process parameters are 1.41 times better in terms of the fracture strength of the weldment, than the existing parameters. This indicates that the multiple response performance characteristics are greatly improved through this study.
Keywords: weld strength, process parameters, PAW, Taguchi method with grey relational analysis
1. Introduction
Welding is the process of joining two or more work pieces together to form a weldment. This welding process is a much faster and economic way of joining metals when compared to casting and riveting [1]. Arc welding was developed over 200 years ago, and plasma arc welding came into use in 1964 [2]. Plasma Arc Welding is better in speed and quality than other arc welding pro-cesses and is employed by the aviation industry,
dyeing machinery manufacturing, steel pipe man-ufacturing, and flanged valve component manu-facturing and assembly[3] . The Plasma arc weld-ing (PAW) process was appraised in this study.
and the attendant need for strength and preci-sion in metal works fabrication. Welds therefore need to possess equivalent strength when com-pared to the parent metal. The Taguchi method with grey relational analysis is used in this study to optimize the process parameters.
Other researchers who have also adopted this method are Hsiao et al [3], they optimized the plasma arc welding parameters using the Taguchi method with the grey relational analysis. Tarng et al [5] used the grey based Taguchi methods to determine the submerged arc welding process pa-rameters in hardfacing. Fung [6] studied the man-ufacturing process optimization for wear prop-erty of fiber reinforced polybutylene terephtha-late composites with grey relational analysis.
Balasubramanian and Ganapathy [7] said that the grey relational analysis is a normalization evaluation technique extended to solve the com-plicated multi-performance characteristics that are optimized effectively. This claim was also sup-ported by Deng [8] and Lin [9]. The relevance of this study is to produce welds of higher strength quality that can match the strength of the work piece and would meet the expected load demands than the existing quality of the welds by applying the methods used by Hsiao et al [3].
2. Materials and Methods
2.1. Materials
40mm × 40mm pieces of steel metals were joined using the PAW process. The process pa-rameters in Table 2, arranged in the orthogonal array layout were used to conduct several welding tests. Tables 3-4 were used as the performance in-dicators in evaluating the postweld measurements
2.2. The Method used in the optimization process
Aneru et al. [10] used the steps mentioned hereunder for the optimization of process param-eters using the grey relational analysis.
2.2.1. Application of Taguchi method with grey relational analysis
Table 1 shows the welding process parameters in their various levels. These process parameters were substituted into Table 2 in their various lev-els to make weld deposits at the grooved undercut
Table 1: Welding parameters and their levels.
Factor Variable Level 1
Level 2
Level 3 A Torch Stand Off
(mm)
4.5 5.5
-B Welding Current (A)
160 180 220
C Welding Speed (mm/min)
300 400 500
D Plasma gas Flow rate (L/min)
2.2 2.8 3.4
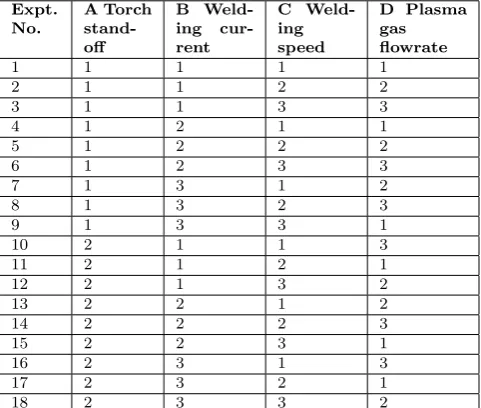
Table 2: Experimental layout using an L18 or-thogonal array.
Expt. No.
A Torch stand-off
B Weld-ing cur-rent
C Weld-ing speed
D Plasma gas flowrate
1 1 1 1 1
2 1 1 2 2
3 1 1 3 3
4 1 2 1 1
5 1 2 2 2
6 1 2 3 3
7 1 3 1 2
8 1 3 2 3
9 1 3 3 1
10 2 1 1 3
11 2 1 2 1
12 2 1 3 2
13 2 2 1 2
14 2 2 2 3
15 2 2 3 1
16 2 3 1 3
17 2 3 2 1
18 2 3 3 2
parts of the steel specimens to be joined, eventu-ally producing an average of 18 experimenteventu-ally it-erated results containing the multi-response qual-ity characteristics (i.e, root penetration, groove width and front undercut).
The Taguchi method involves the use of stan-dard orthogonal arrays in its optimization pro-cesses. The L18 orthogonal array used in this study is shown in Table 2.
The performance indicators used by Hsiao et al (2008) were adopted in this study. For the welding root penetration, Table 3 was used as the indicator evaluation criteria.
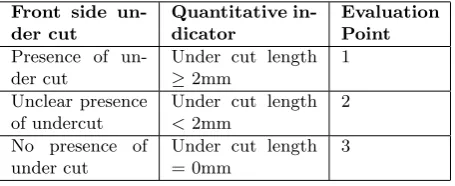
Also for the Front side undercut, Table 4 was used as the performance criteria. This is used for evaluating the measured level of undercut present at the welded portions of the steel specimens.
com-Multi-Response Perf. Characteristics & Optimum Plasma Arc Welding Parameters
Table 3: Welding groove root penetration evalu-ation levels.
Root Pen-etration
Quantitative indicator Evaluation Point
Incomplete Penetration
No keyhole generated due to inadequate arc force
1
Insufficient Penetration
Root penetration height<
0.5mm
2
Adequate Penetration
Root penetration height = 0.5 to 1.0mm
3
Excessive Penetration
Root penetration height>
1.0 mm
4
Penetrated Root
Welding joint can not be formed via surface tension due to excessive arc force
5
Table 4: Front-side under cut evaluation levels.
Front side un-der cut
Quantitative in-dicator
Evaluation Point
Presence of un-der cut
Under cut length
≥2mm
1
Unclear presence of undercut
Under cut length
<2mm
2
No presence of under cut
Under cut length = 0mm
3
pleted, weld deposits were made on three of the steel specimens which constituted one experimen-tal procedure. This was repeated 18 times, re-sulting in a total of 54 specimens used for this study. The three different types of measurement made of the multi-response quality characteristics recorded are shown in Table 5.
The next step, was to generate the Signal-to-Noise (S/N) ratios, η for the values in Table 5. This action lead to the generation of Table 6. In generating these S/N ratios, two equations were used.
Equation 1 was used to determine theS/N ra-tios for the root penetration and welding groove width.
η=−10 logy
2
s2 (1)
Where S = standard deviation and y = average of experimental data for each procedure
S2=
Pn
i=1(yi−y)2
n
Where, yi = evaluation indicator value of root penetration or welding groove width measured for
Table 5: Experimental results for the analysis of welding characteristic performance.
Exptl. No. Root Pene-tration, mm Groove Width, mm Under cut, mm
Table 6: Multi-response signal-to-noise ratio for the welding performance.
Expt. No.
Root Penetra-tion (mm),η1
Groove Width (mm),η2
Under cut (mm),η3
1 -13.90 -36.57 6.0205
2 -11.30 -36.72 3.0102
3 -4.95 -18.16 1.2494
4 -10.97 -35.49 9.5468
5 -8.54 -27.28 8.0410
6 -13.89 -31.72 6.0205
7 -13.80 -39.01 0
8 -11.80 -29.29 6.9037
9 -5.44 -24.43 9.5468
10 -11.30 -36.39 1.2494
11 -13.89 -41.58 3.0102
12 -7.78 -33.53 1.2494
13 -17.82 -27.12 6.9037
14 -15.06 -42.65 8.0410
15 -15.06 -31.82 6.0205
16 -19.27 -35.49 1.2494
17 -11.30 -43.69 9.5468
18 -11.30 -25.24 3.0102
theith time andn= number of repeated experi-ments; here n= 3.
Equation 1 is a simplified nominal-the-better function, for which the target value is adjusted to the average value. The greater the evaluation in-dicator of the front undercut, a higher-the-better type, and the better it is, and its S/N ratio was determined using Eq (2).
η =−10 log 1 n
n
X
i=0
1 y2
i
!
(2)
Where, yi= evaluation indicator value of the un-dercut measured in theithtime and n= number of repeated experiment, in this case n= 3.
In Table 6, columns 2 and 3 i.e the signal-to-noise ratio for root penetration and groove width respectively, are obtained using Eq (1) on Table 5. Also, in column 4 i.e the signal-to-noise ratio for undercut is obtained using Eq(2) on Table 5. The results therefrom are shown in Table 6.
2.2.2. Grey relational analysis for the S/N ratio
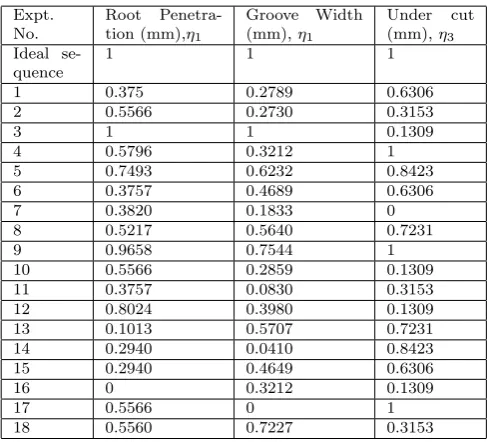
In this analysis, the S/N ratio data in Table 6 were normalized using Eq (3). The normalized S/N ratio,xij for theith performance character-istic in the jth experiment can be expressed as
xij = ηij −minjηij
maxjηij −minjηij
(3)
Where: ηij is the S/N ratio for each parameter in each experiment, minjηij is the minimumS/N
Table 7: Normalized S/N ratio for root penetra-tion, groove width and undercut.
Expt. No.
Root Penetra-tion (mm),η1
Groove Width (mm),η1
Under cut (mm),η3
Ideal se-quence
1 1 1
1 0.375 0.2789 0.6306
2 0.5566 0.2730 0.3153
3 1 1 0.1309
4 0.5796 0.3212 1
5 0.7493 0.6232 0.8423
6 0.3757 0.4689 0.6306
7 0.3820 0.1833 0
8 0.5217 0.5640 0.7231
9 0.9658 0.7544 1
10 0.5566 0.2859 0.1309
11 0.3757 0.0830 0.3153
12 0.8024 0.3980 0.1309
13 0.1013 0.5707 0.7231
14 0.2940 0.0410 0.8423
15 0.2940 0.4649 0.6306
16 0 0.3212 0.1309
17 0.5566 0 1
18 0.5560 0.7227 0.3153
ratio for each parameter in Table 6, maxjηij is the maximum S/N ratio for each parameter in Table 6.
The normalizedS/N ratio are presented in Ta-ble 7. In TaTa-ble 7, the first row shows the best normalized S/N ratios. The larger normalized S/N ratio corresponds to the better performance and the best normalized S/N ratio is equal to unity.
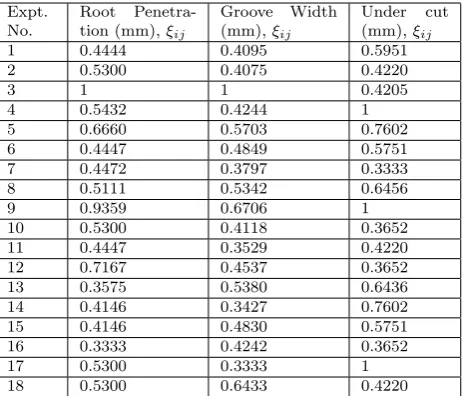
The Grey relational coefficient is determined to show the relationship between the ideal (best) and actual normalizedS/N ratio. The Grey rela-tional coefficientξij for theith performance char-acteristic in the jth experiment can be expressed as
ξij =
miniminj|x0i −xij|+ζmaximaxj|x0i −xij| |x0i −xij|+ζmaximaxj|x0i −xij|
(4) Wherex0i = ideal normalizedS/N ratio for theith performance characteristic = 1.0; xij = the nor-malized S/N ratio obtained; ζ = distinguishing coefficient which has value 0≤ζ ≤1 but usually taken as 0.5; ξij The grey relational coefficient, miniminj|x0i −xij|= the least value ofx0i −xij values; maximaxj|x0i−xij|= the maximum value of the x0i −xij values.
Multi-Response Perf. Characteristics & Optimum Plasma Arc Welding Parameters
Table 8: Grey relational coefficient.
Expt. No.
Root Penetra-tion (mm),ξij
Groove Width (mm),ξij
Under cut (mm),ξij
1 0.4444 0.4095 0.5951
2 0.5300 0.4075 0.4220
3 1 1 0.4205
4 0.5432 0.4244 1
5 0.6660 0.5703 0.7602
6 0.4447 0.4849 0.5751
7 0.4472 0.3797 0.3333
8 0.5111 0.5342 0.6456
9 0.9359 0.6706 1
10 0.5300 0.4118 0.3652
11 0.4447 0.3529 0.4220
12 0.7167 0.4537 0.3652
13 0.3575 0.5380 0.6436
14 0.4146 0.3427 0.7602
15 0.4146 0.4830 0.5751
16 0.3333 0.4242 0.3652
17 0.5300 0.3333 1
18 0.5300 0.6433 0.4220
Following the above, is to convert the grey rela-tional coefficients of each experiments in Table 8 into the grey relational grade in Table 9 by using a weighing method.
The overall evaluation of the multiple perfor-mance characteristics is based on the Grey rela-tional grade which is obtained using Eq (5).
γj =
1 m
m
X
i=1
wiξij (5)
Assume that: w1 =w2 =w3 = 1. Where; γj =
the Grey relational grade for the jth experiment, wi = the weighting factor for the ith performance characteristic, and m = the number of perfor-mance characteristics (in this case, root penetra-tion, groove width and front side undercut, ie, m= 3).
Equation(5) is applied to Table 8 to obtain Ta-ble 9.
From Table 9, the best welding process param-eters are the ones used to conduct experiment 9. Table10 is obtained from Table 9 by consider-ing the orthogonal array setup (in Table1), this requires the taking of the respective averages of each level for the process parameters from Table 9. Table 10 shows the optimal levels of each of the welding parameters.
Total mean value of the grey relational grade = 0.5431.
From Table 10, the optimum combination of welding process parameters is A1B3C3D1. This
Table 9: Grey relational grade and its order.
Expt. No. Grey relational Grade,γj Order
1 0.4830 13
2 0.4531 14
3 0.8068 2
4 0.6558 4
5 0.6655 3
6 0.5016 11
7 0.3867 17
8 0.5636 6
9 0.8689 1
10 0.4357 15
11 0.4065 16
12 0.5119 9
13 0.5130 8
14 0.5058 10
15 0.4909 12
16 0.3742 18
17 0.6211 5
18 0.5318 7
Table 10: Response Table for the Grey relational grade.
Symbol Process Parameter
Level 1
Level 2
Level 3
Max. - Min.
A Torch
stand-off
0.5983 0.4879 - 0.1104
B Welding
current
0.5162 0.5554 0.5577 0.0415
C Welding
speed
0.4747 0.5359 0.6187 0.1440
D Plasma gas
flowrate
0.5877 0.5103 0.5312 0.0774
result confirms the prediction made from Table 9, that Experiment 9 has the best process pa-rameters.
The layout of Table 10 is expressed, for further clarity by presenting it in a graphical form. This leads to the construction of Figure 1. Fig 1 shows the Grey relational grade, where the dashed (cen-ter) line is the value of the total mean of the Grey relational grade. Basically, the larger the Grey relational grade, the better the multiple perfor-mance characteristics.
However, the relative importance of each of these process parameters was determined. In other words, The contribution of each of these welding process parameters to the multiple per-formance characteristics of the welding method were determined by obtaining the Analysis of Variance (ANOVA) in Table 11.
Figure 1: Grey relational grade.
Table 11: The ANOVA Table.
Variation source
DF SS MS F %
Contri-bution
A 1 0.0549 0.0549 3.2470 17.56
B 2 0.00654 0.00327 0.1934 2.09
C 2 0.06218 0.03144 1.8595 20.11
D 2 0.01921 0.00961 0.5688 6.15
Residual 10 0.16908 0.01691 54.09
Total 17 0.33126 100.00
of Squares Total SST;
SST =
N
X
i=1
(γi−Y)2 (6)
Y =
N
X
i=1
γi (7)
Where, SST is the total sum of square over the whole 18 experiments, γi is the ith experiment conducted, Y is the average of all experimental outcomes, N is the total number of experiments conducted (N = 18).
Sum of Squares of individual process parame-ters SSP;
SSP = 1
t k
X
j=1 X
γi2
j− 1 N
" N X
i=1
γi
#2
(8)
Where, SSP = Sum of squares of each process parameter,t= Number of times of each level
rep-etition, P
γi = sum of experimental outcome for each level manipulation, K = Number of levels.
Residual Sum of Square,SSR;
SSR= (SST −(SSA+SSB+SSC+SSD)) (9)
Degree of freedom, Df;
Df =n−1 (10)
Mean Square or Variance,M S;
M S= SSP
Df (11)
Variance ratio,F;
F = M SP
M SR
(12)
Percentage contribution
% contr.= SSP
SST
×100% (13)
3. Confirmation tests
Experiments through the Taguchi orthogonal array reveal that the optimal welding parame-ter combination is A1B3C3D1, which is then
em-ployed to predict the Grey relation that repre-sents the welding quality.
Multi-Response Perf. Characteristics & Optimum Plasma Arc Welding Parameters
Table 12: The predictedS/N ratios and fracture strength values of optimum and existing process parameters.
A1C3D1
(Predicted optimum)
A1B3C3D1
(Experimen-tal optimum)
A2B2C3D3
(Initial/exist-ing parameter)
S/N Ratio 0.7185 0.7331 0.5639 Fracture
strength
481 MPa 432 MPa 342 MPa
ANOVA. Prediction of the Grey relation of the optimal welding parameters can be expressed as
b
η =ηm+
q
X
i=1
(ηi−ηm) (14)
Where; ηb = Grey relational grade for
predict-ing the optimal weldpredict-ing parameters,ηi = average Grey relational grade of the optimal level of cer-tain significant factors A, C, and D,ηm= average Grey relational grade, q = number of significant factors which is 3.
Since factor B is an insignificant factor, the ef-fect of that factor is excluded in the prediction computation. Only the effect of A1C3D1 is
in-cluded.
Computation of the Grey relational grade for predicting the optimal welding parameters is as follows
b
η =ηm+Pqi=1(ηi−ηm)
= 0.5431 + (0.5983−0.5431) + (0.6187−0.5431) +(0.5877−0.5431)
= 0.7185
Finally, the confirmation test were done for the entire optimum combination of A1B3C3D1, and
the existing process parameters of A2B2C3D3.
The summary of the confirmation test is pre-sented in Table 12.
From Table 12, it is shown that the S/N ra-tios of the predicted and experimental process parameters respectively are 1.27 and 1.30 times better than theS/N ratio of the existing welding process parameter. The fracture strengths of the predicted and experimental process parameters, respectively, are 1.41 and 1.26 times better than that of the existing welding parameter.
4. Conclusions
The Taguchi method with grey relational anal-ysis has been used to optimize the PAW process parameters. The multiresponse quality charac-teristics used for this study are the root penetra-tion, groove width, and front undercut. These variables were used to determine welding perfor-mance that can produce weldment with excellent bead appearance, absence of pores, and of good quality. These features are considered to be vi-tal determinants for increased strength in weld-ments.
From the Grey Relational Grade analysis, op-timum combinations were suggested. In the first optimum combination, the parameter that is the least significant was eliminated based on the ANOVA evaluation results. The second optimum combination contains all the parameters. How-ever, these combinations have shown significant improvement over the existing process parame-ters, in terms of the fracture strength and the multiresponse signal to noise ratios.
Summarily, the optimum process combinations have a better weld strength than the weld made by the existing process parameters. This proves that the Taguchi method with grey relational analysis can be applied to satisfactory effect.
References
1. The Lincoln Electric Co. The Procedure Hand-book of Arc Welding. Lincoln Electric Press, USA, 1973.
2. Mannion, B. and Heinzman, J. Plasma Arc Weld-ing BrWeld-ings Better Control, 1999. (Available at www.pro-fusiononline.com).
3. Hsiao, Y.F., Tarng, Y.S. and Huang, W.J. Opti-mization of Plasma Arc Welding Parameters by Using the Taguchi Method with the Grey Re-lational Analysis. Materials and Manufacturing Processes, Vol. 23, Number 1, 2008, pp. 51-58.
4. Howard, B.C. Modern Welding Technology. 2nd Ed. Prentice Hall, New Jersey, 1989, pp. 257.
6. Fung, C.P. Manufacturing Process Optimization for Wear Property of Fiber-Reinforced Polybuty-lene Terephthalate Composites with Grey Rela-tional Analysis. Wear, 254, 2003, pp. 298-306.
7. Balasubramanian, S. and Ganapathy, S. Grey Relational Analysis to determine Optimum Pro-cess Parameters for Wire Electro Discharge Ma-chining (WEDM).Int. J. of Engineering Science and Technology, Volume. 3, Number 1, 2011, pp. 95 - 101.
8. Deng, J. Introduction to Grey System. J. Grey System, Volume 1, Number 1, 1989, pp. 1–24.
9. Lin, C.L. Use of the Taguchi Method and Grey Relational Analysis to Optimize Turning Oper-ations with Multiple Performance Characteris-tics. Materials and Manufacturing Processes, 19, 2003, pp. 209–220.