SCHOOLING MATTER?
Anil Duman, PhD* Article**
Central European University UDC 37.014(560)
Budapest, Hungary JEL D31, I20, I22
Abstract
The paper examines the link between educational variables and income inequality in Turkey. First, I evaluate the impact of educational level, then I move on to assess educa-tional inequality and finally I consider educaeduca-tional spending by public and private sec-tors. I argue that due to the limited public spending on primary and secondary educati-on and growing private spending, the spread between socio-eceducati-onomic groups will not be decreased significantly.
Keywords: inequality of income, education, public spending
1 Introduction
Inequality and economic vulnerability have once again started to gain importance in policy debates, since rising inequality and social exclusion have in recent years become perceptible in many countries1. Although there is still controversy about whether income
inequality is necessary for growth, there are several arguments as to how excessive ality can hamper economic development. From a Keynesian perspective, income inequ-ality can be judged harmful for growth because it reduces aggregate demand, output and prospects for sustained growth. Others look at the implications of poverty for worker pro-ductivity, as it affects the nutritional level and access to health care of the working poor.
* The author would like to thank Political Economy Research Group (PERG) members at Central European University, Budapest and two anonymous referees for extremely useful comments and suggestions. The usual cave-at applies.
** Received: March 26, 2008 Accepted: August, 5, 2008
Over the long run, worker productivity diminishes, dimming prospects for a country’s sustainable growth. Persson and Tabellini (1994) point out that in a society with a wide-ning income gap, the need for redistribution becomes crucial for the health care, educa-tion and welfare of its populaeduca-tion at large2. Moreover, in a highly unequal society, there
are economic costs of enforcing law and order to protect the market system, property ri-ghts and political stability.
Within these factors, income inequality, demographic factors and especially educa-tion have been seen as of primary interest. Either through its effects on earnings or ski-lls, or its function in transmitting intergenerational disparities, education continues to be a pertinent aspect for studying inequality. Turkey is no exception with its high educa-tion premium and wide gap between the levels of schooling among the top and bottom quintiles. Although overall inequality as measured by the Gini coefficient in Turkey has been on the decline since the 1960s, the nonetheless high levels of inequality give rise to concern about there actually being more people living in deprivation despite the positive growth rates and macroeconomic stability.
In this paper, I argue that the reduction in inequality in Turkey is partly due to higher education attainments. However, the dispersal of education among the income groups is rather high and in recent years there has been a growing gap between the educational ex-penditures of rich and poor households. Since the private and social returns to primary and secondary schooling turn out to be quite high in Turkey, more spending in these areas could improve the education and earning disparities. However, as I discuss, government expenditure on education is diminishing and becoming more biased towards tertiary edu-cation, which in turn decreases the chances of poor households utilizing these services.
One of the elements that have been widely examined in the context of household in-come distribution is that of the initial conditions people receive when they are born. As stated by Bowles and Gintis (2002), the inheritance of inequality is a prevalent phenome-non and it is often very difficult to distinguish the returns to innate abilities and family backgrounds. People differ with respect to their family backgrounds; some are raised in richer families that have necessary resources to invest in their children’s education while others are born into poorer families with only limited means. Second, since the education premium is high in most countries, the education system plays an important role. If high-quality education were freely available to all children, family background would play a less significant role in determining the incomes. On the other hand, if educational oppor-tunities are limited by individuals’ economic or social background, education can in fact exacerbate the differences in initial conditions rather than reduce them. Once there are essential constraints to educational opportunities the public becomes an important player in preventing the further escalation of inequalities. This is mostly done through educati-onal expenditures and subsidies.
2 Redistribution is economically costly, for such measures inevitably result in taxing investment and growth promoting activities.
3 Bowles and Gintis (2002) discuss the intergenerational transmission of inequality in the case of U.S. 4 The education premium can simply be defined as the excess wage that is received by acquiring a higher edu-cational status.
In the literature there are contending views about the role education plays in deter-mining inequality. The first set of studies takes the average number of school years into account when assessing the role of education in inequality. In Partridge, Partridge and Ric-kman (1998), there is a direct association between higher years of average education and lower inequality in the USA at the level of county, and they claim that the higher the ave-rage level of education in a county, the more equal the distribution is. Mohan and Sabot (1988) point out that educational expansion will decrease income inequality because the labor supply of highly skilled workers will go up, which puts a pressure on the wage di-fferentials. On the other hand, in Sylvester (2002), countries with more average years of education also display higher levels of income inequality.
Besides the level of education, the access and availability of education across gro-ups might bring an influence to bear on the incomes of these grogro-ups. Studies looking at the relationship between income inequality and education inequality go back to Becker and Chiswick (1966). They claim that in the US, income and schooling inequality are po-sitively related. However, in a later analysis, Chiswick (1974) concludes that education inequality does not have a statistically significant effect on the Gini coefficient. From a theoretical perspective higher education inequality is generally taken as an indicator of higher income inequality since the former tends to widen the earnings gap6. Gregorio and
Lee (2002) argue that indeed higher educational inequality leads to higher income inequ-ality in their cross country study. However, according to these authors schooling varia-bles explain only a fraction of the cross country income distributions. Ram (1990) eva-luates both the schooling level and schooling inequality across countries and claims that neither of these factors have a significant impact on income dispersal.
Finally there are papers evaluating the impact of education expenditure as a factor of income inequality. Sylvester (2002) shows that countries with greater public expendi-ture on education have lower income inequality in his cross country analysis, which co-vers fifty countries from all around the world. Nevertheless, he draws attention to the fact that education expenditure has a miniscule effect on Gini coefficients and this might be even more pronounced if one were to take overall government spending into considera-tion. Doessel and Valadkhani (1998), examining the years 1967–1993 in Iran, found that total government expenditure tended to reduce income inequality, while education expen-diture had no significant effect. . Although not relying on empirical tests, Restuccia and Urruita (2004) assert that public spending on early education is much more effective in decreasing intergenerational inequalities. Early schooling allows poor children to build up the necessary human capital, which cannot be addressed by public expenditure on ter-tiary education. Zhang (1996) develops a model in which public spending on education decreases income inequality over time and promotes growth by enhancing the stock of human capital. Nonetheless, Jimenez (1996) illustrates that the poor by and large do not benefit from governmental spending on education, especially when these expenses are directed to higher education. Public expenditure on schooling harms the poor most if they have only limited (or no) access to public education yet finance public spending on edu-cation via taxes.
This paper aims first of all to study the effect of education on income inequality in Turkey in a qualitative way. For this purpose, the average levels of schooling and scho-oling distribution for income quintiles will be investigated. Until recently, the decompo-sition of inequality was a relatively unexplored field in Turkey, with the exception of the spatial dimension. Duygan and Guner (2006) model fertility and education decisions to see the impact on persistence of inequality. Dayioglu and Tunali (2004) study gender dif-ferences in education and earnings. Although they do not consider the total returns, Dayi-oglu and KasnakDayi-oglu (1997) examine the returns on education by gender. Utilizing the 1994 survey they conclude that females have higher private returns for every educatio-nal category than males. Tansel (1994), employing the 1987 Household Income and Con-sumption Expenditures Survey (HICES), computes the private rate of return on education in urban areas. She finds that the primary and secondary returns on education for males are lower than for females. And overall, the higher the education level is, the higher the returns are. To our knowledge the only other study that investigates the social returns of education in Turkey is by Turkmen (2002). According to this paper, the social return of primary education has declined from 1987 to 1994 while the return on secondary schoo-ling has remained stable. Nevertheless, none of these studies explicitly analyze the effect of educational variables or look deeper into public and private spending on education.
Secondly, the paper argues that educational impediments are not decreased by the Turkish government and hence the intergenerational transmission of inequality is still a substantial drawback for the country’s development prospects. This is partly due to the declining share of education in total Turkish government spending over the last decade, and partly the higher share obtained by the wealthier segments through tertiary education. The richest socio-economic groups manage to compensate for the decrease in public spen-ding on education by paying for education out of their own pocket; however, this option is not available for the poorer groups. The spending on primary and secondary education by households became significant, adding to the initial differences between the children from the poor and the rich households in the last decade. During the same period, the go-vernment changed its distribution of spending in favor of tertiary education, which furt-her restricts the opportunities at hand for the poor.
In the next section, I will give a succinct picture of the state of inequality and its de-composition with respect to educational factors. In the last part, I will provide an empirical account of the private and social returns on education in Turkey. Then, I assess the gover-nment policies and provide policy recommendations. The final section concludes.
2 Income Inequality and Education in Turkey
2.1 Overview of Inequality
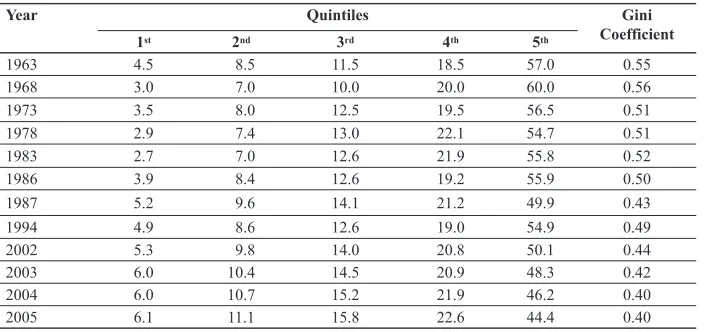
Sta-tistical Institute has been trying to standardize the surveys and to obtain results that are more comparable. The decrease in Gini is also reported in Gursel (2000). Table 1 shows the Gini coefficients and the share of income quintiles for 1963-2005. For the period of 1963-1987, the figures are taken from Kasnakoglu (1997). The data for 1994-2005 are obtained from the Household Income and Consumption Expenditures Surveys conduc-ted by Turkish Statistical Institute.
Table 1 Income Inequality in Turkey per quintile: 1963-2005
Year Quintiles Gini
Coefficient
1st 2nd 3rd 4th 5th
1963 4.5 8.5 11.5 18.5 57.0 0.55
1968 3.0 7.0 10.0 20.0 60.0 0.56
1973 3.5 8.0 12.5 19.5 56.5 0.51
1978 2.9 7.4 13.0 22.1 54.7 0.51
1983 2.7 7.0 12.6 21.9 55.8 0.52
1986 3.9 8.4 12.6 19.2 55.9 0.50
1987 5.2 9.6 14.1 21.2 49.9 0.43
1994 4.9 8.6 12.6 19.0 54.9 0.49
2002 5.3 9.8 14.0 20.8 50.1 0.44
2003 6.0 10.4 14.5 20.9 48.3 0.42
2004 6.0 10.7 15.2 21.9 46.2 0.40
2005 6.1 11.1 15.8 22.6 44.4 0.40
Source: Kasnakoglu (1997), TUIK (various years)
As can be clearly seen from Table 1, both the Gini coefficients and the share of inco-me quintiles indicate a decrease in incoinco-me inequality in Turkey for the tiinco-me period with the exception of 1994. The income represents the total annual household income, and has not been adjusted for the number of households for each quintile group. The share of in-come accruing to the poorest quintile was 4.5% in 1963 and 3% in 1968 while it rose to 6% in 2004 and 6.1% in 2005. The increase in the incomes of the lowest quintile was accompanied by a decline in the share of the richest quintile. These figures were 57% in 1963 and 60% in 1968 while they went down to 46.2% in 2004 and 44.4% in 2005. The Gini coefficient also has receded to 0.4 in 2005 from 0.55 in 1963.
The differences between the income groups become more profound when deciles are considered, however7. The richest 10% of the households earned 22.5 times more than
tells us that the annual average per-capita incomes of the richest 1% of households was 250 times more than the poorest 1% in 2002.8
Despite the improvements in income distribution, Turkey is still a relatively unequ-al country compared to OECD countries and most of the developing economies. When Gini coefficients are examined across developing countries it is immediately apparent that only two regions, Latin America and Sub-Saharan Africa, have a more unequal income distribution than Turkey. All of the OECD countries with the exception of Mexico have lower Gini coefficients.When the country is compared to developed areas, it becomes clear that Turkey’s income skewness arises from the higher shares the richest quintile re-ceives. For example, during the 2000s, in developed countries, the wealthiest quintile got less than 40% of the per capita income while this was 50% in Turkey for the year 20029.
In Turkey, the middle-income group (2nd and 3rd quintiles) gets a lower share, 34.8%,
as compared with 41.8% in developed countries. The income share of the bottom 40% is quite close, at 18.4% in developed countries versus 15.1% in Turkey.
2.2 Factors behind Inequality
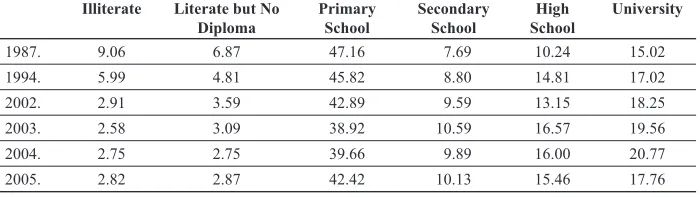
There are numerous reasons why income is unequally distributed. From a micro-economic point of view, changes in income distribution can be derived from changes in labor force participation decisions, in demographic characteristics, and in the returns to those characteristics. Nevertheless I abstract from most of these developments and solely focus on the role education plays. Certainly, there are numerous determinants of income inequality in Turkey but as I discussed in the introductory part, education is gaining more importance and this is the reason why it is emphasized here. Also, despite the growing importance of education in the examination of income inequality, not many studies have looked deeply at education and this paper might provide additional and interesting insi-ghts. For this purpose, I analyze first the income shares of the educational groups. Table 2 provides the results.
Table 2 Income Shares by Education Level (in % of total income earned)
Illiterate Literate but No Diploma
Primary School
Secondary School
High School
University
1987. 9.06 6.87 47.16 7.69 10.24 15.02
1994. 5.99 4.81 45.82 8.80 14.81 17.02
2002. 2.91 3.59 42.89 9.59 13.15 18.25
2003. 2.58 3.09 38.92 10.59 16.57 19.56
2004. 2.75 2.75 39.66 9.89 16.00 20.77
2005. 2.82 2.87 42.42 10.13 15.46 17.76
Source: TUIK (various years) and State Planning Organization (2001)
Table 2 indicates that over the years the share of income accruing to primary scho-ol graduates has decreased from 47.16% to 38.92% in 2003 and then has risen a little to 42.42% in 2005. Secondary school graduates received 7.69% of total income in 1987 while their share had gone up to 10.13% in 2005. People with university degrees have seen a steady increase in their income share from 15% in 1987 to almost 21% in 2004. The biggest decline over the period was for the illiterate group and following it, the lite-rate but without a diploma. 2005 turned out to be a peculiar year since the income sha-res of more educated people showed a decrease and both primary and secondary scho-ol graduates got a bigger share of the total income. However, if one considers the size of these groups and looks at the average earnings, then it could be seen that over the years the average earnings of university graduates have increased from 3.4 times that of people with primary school degrees in 1987 to 4.5 times in 2005. This points to the fact that hi-gher education levels pay hihi-gher in terms of income. Although the table does not reveal a causal relationship between income and education, it illustrates the fact that income and education are highly correlated in Turkey. Tansel (2004) shows that for an illiterate male urban wage earner, the hourly real earnings were 435 TL in 2002 while they were 1627 for a university graduate. The ratio between illiterate and university graduate was accen-tuated for females: the former earned 272 TL while the latter received 1274 TL10. This
is especially important for intergenerational transmission of inequalities since an initial low education will be accompanied by low levels of income, which in turn will genera-te the same dynamics in the long run if there are no structural changes to the position of the household members.
One of the suggestions in the literature is about the years of schooling, and generally it has been claimed that more schooling years on average brings more equality. These re-sults usually apply to within-country developments11. When the overall educational
de-velopments in Turkey are analysed, it can be seen that the average years of schooling have gone up considerably over the last four decades. According to Table 3 below, the average schooling years for the whole country have increased from 2.7 years in the 1960s to 5.3 years in the 2000s. Turkey, with these aggregate figures, lies slightly above the ping countries but it seems that there is a strong convergence. In comparison to develo-ped countries, Turkey has a lot of catching up to do. The average schooling in the deve-loped sample is 9.8 years for 2000s. Nonetheless, the gap between Turkey’s and develo-ped countries’ years of schooling decreased from 4.96 to 4.47 years.
The rising level of average schooling is reflected in the declining number of workers with a lower level of education in the labor force. As shown in Table 2, this also means a bigger share of income for higher educational groups. In the year 1987, the share of pri-mary school graduates in the labor force was 52 % while the share of university gradua-tes was less than 5%. In 2005, these ratios changed to 44% and 11.5% respectively. The Turkish labor force became more educated as the number of schooling years on avera-ge went up.
10 For more explanation see Tansel (2004).
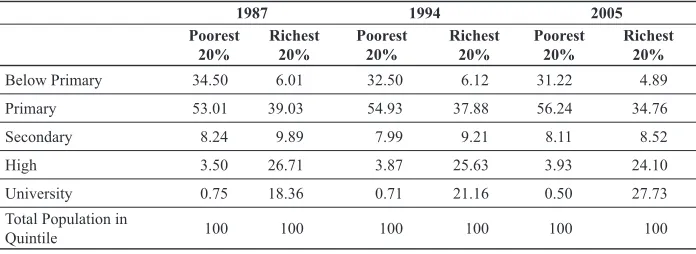
Next, I examine the distribution of schooling among different income quintiles. The access and availability of education across different socio-economic groups can alter the earnings dispersion significantly. For this reason, it would be useful to analyze the between-group educational difference; however, since I have not had access to the raw data for all the survey years, I have been unable to calculate the education Gini or stan-dard deviation of educational achievements by households. A closer look at the distribu-tion of educadistribu-tion among the income quintiles will give us hints about whether educadistribu-tion is accessible to all socio-economic groups equally, and if not, the extent of the differen-ces between them. Table 4 summarizes the findings of the education characteristics of various income quintiles.
Table 4 Educational Attainment of the Richest and the Poorest Quintile in %
1987 1994 2005
Poorest 20%
Richest 20%
Poorest 20%
Richest 20%
Poorest 20%
Richest 20%
Below Primary 34.50 6.01 32.50 6.12 31.22 4.89
Primary 53.01 39.03 54.93 37.88 56.24 34.76
Secondary 8.24 9.89 7.99 9.21 8.11 8.52
High 3.50 26.71 3.87 25.63 3.93 24.10
University 0.75 18.36 0.71 21.16 0.50 27.73
Total Population in
Quintile 100 100 100 100 100 100
Source: Author’s calculation based on HICES (1987, 1994, 2005).
Table 4 presents the educational levels for different income quintiles. It clearly illu-strates that there is a wide gap between the educational levels of the poorest and richest socio-economic groups in Turkey. For example in 1987, 53% of the lowest income quin-tile had a primary school leaving certificate while this ratio was less than 40% for the ri-chest quintile. Only 0.75% of households with a university degree belonged to the lowest quintile in the same year. These ratios got even higher over the years as the share of
hou-Table 3 Average Years of Schooling
Years Schooling
Turkey Developing Countries Developed Countries
1960s 2.10 2.05 7.06
1970s 2.71 2.67 7.56
1980s 3.50 3.57 8.86
1990s 4.70 4.50 9.41
2000s 5.29 5.13 9.76
seholds with primary school completion, which is in the poorest segment, rose over 56% whereas the ratio of university graduates in the same category declined to 0.5%. Within the richest portion, households with university educations started to have a share of al-most 28% in 2005. The numbers suggest that higher educational levels are associated with higher incomes.
All the analyses in this section suggest that income shares are significantly affected by education in Turkey. Both the schooling levels and the distribution of education con-tribute to the income differences. The socio-economic group with higher education on average as well as relative to the whole sample receives a higher income. Therefore, edu-cation policy can be one of the tools used in order to decrease the income dispersal and boost the economic status of the poor. Before I evaluate the educational policy in Tur-key I would like to discuss the private and social returns on education in the following part of the paper.
3 Returns on Education and Education Expenditure
3.1 Returns on Education
The rate of return from schooling is an important decision factor for an individual to make educational choices and for governments to make educational policy decisions. Be-sides, the rates of return in developing and developed countries significantly differ from each other for various educational categories12, hence policies that should be pursued are
also varied. Simply, the private return on schooling can be understood as the discount rate that equalizes the present value of the private costs and benefits generated by an increa-se in the schooling of a repreincrea-sentative individual13. The social return on schooling can be
defined as the discount rate that equalizes the present value of social costs and the bene-fits of increased schooling. Rate of return on schooling is independent of the type of the school, and this rate tries to capture the benefits that an individual derives by higher edu-cational attainment in relation to the expenses incurred by the public and private sectors. To assess the efficiency of public policy the social rate of return becomes vital.
The formal education system in Turkey is divided into three categories; primary scho-ol, high schoscho-ol, and university. Until 1997, there was also middle school category, which was merged with primary schools at that year; as a result the compulsory education incre-ased to eight years. In 2001 the government passed a law raising compulsory education from eight to twelve years covering high school; however, it is not being yet being enfor-ced. Formally, university education is open to anybody with a high school degree and su-fficient scores from the national entrance examination. The centralized test is seen as an equalizing factor but a recent survey in Hatakenaka (2006) of students taking the college entrance exam has shown that students from high-income families, with more educated parents, and from larger cities are more likely to be placed in higher education.
12 Psacharopoulos (1994) presents the rate of returns across countries and shows the differences between devel-oped and developing countries.
Chiswick (1997) outlined a method based on the earnings function to analyze the rates of return on education. In his model, it is assumed that the earnings of a worker with an education level of i, denoted by Ei, are identical to the annual earnings that he/she would have received with a year less of education, plus the cost of investing in one extra year of schooling, Ci, multiplied by the rate of return on that investment, ri, or;
(1)
(2)
In the above equation, Kt denotes the cost of investing in education level t relative to a full year’s potential earnings if investments were not made in that level of schooling. Taking the natural logarithm of both sides gives us;
(3)
(4) The last equation is derived by assuming that the rates of return on additional years of education and the cost of it do not vary with years of education. This is equivalent to the Mincerian earnings function15. In the original Mincer model, the earnings are
deter-mined by years of schooling as well as experience. I will further assume that rt and Kt
di-ffer across educational categories. This will enable us to calculate the returns on vario-us education levels. The categories are primary school, secondary school, and university completion. In Turkey, eight years are necessary to finish primary school, while secon-dary school education demands an additional 3 years and finally for a university degree an individual needs on average 4 years more.
When I incorporate the educational categories and use equation (4), I get the exten-ded earnings function specified by Lachler16. Below,r denotes the discount rate, K, the
cost of investment and I, the number of years required to move from one schooling ca-tegory to the next.
(5)
15 Mincer’s earnings model captures both the wage function and the rate of return on schooling which can be compared with the interest rate to determine optimality of human capital investments.
By estimating equation (5) I get the earnings coefficients for each educational cate-gory. Finally the rates of return for each category can be estimated as follows;
(6)
(7)
I = years required to move to the next schooling category i = educational category
Cp = private costs Cs = social costs
Equation (6) gives us the private return on education and the return is the rate that makes the marginal benefit from acquiring an additional year of education equal to ear-nings foregone by an additional year of education plus the private costs. The social return captures the costs of education that are not borne by individuals but paid by the public sec-tor17. According to the above formula, the rates of private and social return for Turkey in
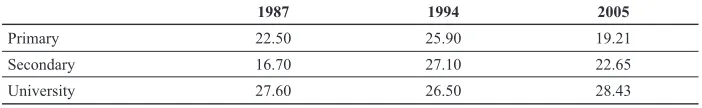
1987, 1994, and 2005 are calculated. The results are presented in Table 6 and Table 7.
Table 5 Private Returns on Education in %
1987 1994 2005
Primary 22.50 25.90 19.21
Secondary 16.70 27.10 22.65
University 27.60 26.50 28.43
Source: Author’s own calculations based on the 1987, 1994 and 2005 surveys. The cost data are derived from State Planning Institute and Ministry of Education.
As can be seen from Table 5, the private return on primary schooling has increased from 22.5% in 1987 to 25.9% in 1994. But this figure declined to 19.2% in 2005. The private return on university education was quite steady across the period with a slight in-crease from 27.6% in 1985 to 28.4% in 2005. Another interesting finding is that in 2005, the return on primary education and secondary education converged considerably. Our results confirm Tansel’s finding for 1987 and 2005, but in 1994, secondary had a higher private return rate than university education.
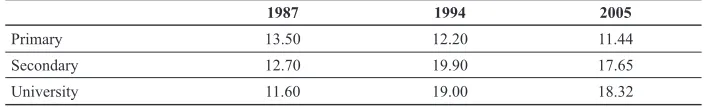
Table 6 Social Returns to Education in %
1987 1994 2005
Primary 13.50 12.20 11.44
Secondary 12.70 19.90 17.65
University 11.60 19.00 18.32
Source: Author’s own calculations based on the 1987, 1994 and 2005 surveys. The cost data are derived from State Planning Institute and Ministry of Education.
Now, I move forward to analyze the social returns for the same period. Table 6 shows that the social returns on primary education steadily went down from 13.5% in 1985 to 11.4% in 2005. There was also a little decrease in the social return on university educa-tion from 19% in 1994 to 18.3% in 2005. For secondary schooling, the rate of return ini-tially increased to almost 20% in 1994 and then diminished to 17.7% in 2005. My re-sults confirm the findings in Turkmen for 1987 but the rates vary significantly for 1994, which might be due to the different categorization. Nevertheless, the direction of change is same in both studies.
One thing that arises from both tables is that tertiary education in Turkey has both high private and social returns. Compared to the rest of the world, Turkey is an outlier since the social rates of primary education are lower than what in the other developing countries. For example, the most recent estimates show that the social rate of returns on primary education is 18.8% in middle income countries, 21.3% in low income countri-es and 13.4% in high income countricountri-es18. Moving to the returns on tertiary education, we
can see that Turkey again has much higher returns. This is also true for private returns. Generally, the developing countries have higher returns on all educational categories and there is a greater gap between the private and social benefits of higher education. Turkey, despite its relatively higher returns, follows the same path. This is because the labor force is not exhausted by highly educated workers in developing countries and hence there is greater education premium.
3.2 Education Expenditures
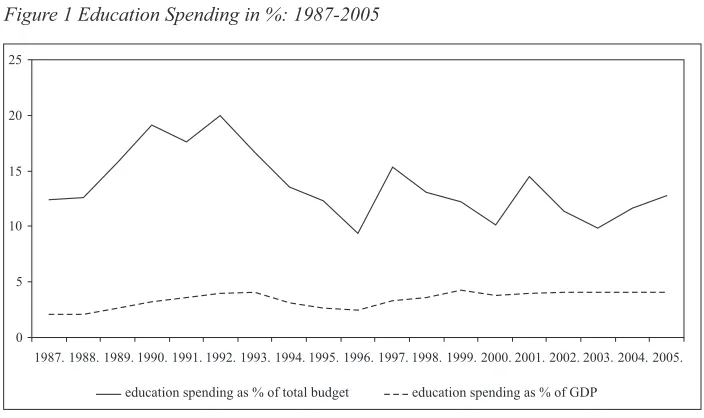
Turkish government spending on education as a percentage of GDP is significantly behind any of the OECD countries and it has been stagnant for a long time. Figure 1 dis-plays the education spending as percentage of the total budget and percentage of GDP from 1987 to 2005. Education spending peaked in 1992 when it amounted to the 20% of the government budget. From then onwards, there have been ups and downs but on ave-rage 11-12% of the total budget has used for educational investments. This number has been on average 14%. In relation to GDP, educational expenditures increased slightly in 1998 but remained the same thereafter. Over this period, the average education spending as fraction of GDP has been 4%, which is substantially lower than the developed
tries and most of the developing countries. The OECD average is around 5.3% of GDP for the same years.
In the following section, I will try to investigate the spending patterns of public and private expenditure. My claim is that the government is restricting its spending on pri-mary and secondary education while keeping high levels of relative spending on tertiary education. Moreover, the shares of public and private spending in the different categori-es are deteriorating and becoming more favorable to richer segments. For the purpose of my study, besides the total spending on education, the sub-categories also matter. There are very limited data on how much the Turkish government is investing in primary, se-condary and tertiary education per student as a percentage of per capita GDP. Table 7 presents the data.
Table 7 indicates that there was an initial rise in the share tertiary education got from 1985 to 1994. And even with the slight decrease in 2003, higher education per spending per pupil was threefold that of secondary education and almost fourfold that of primary
Figure 1 Education Spending in %: 1987-2005
Source: Author’s own calculations based on data derived from State Planning Organization.
Table 7 Public Expenditure on Primary, Secondary and Tertiary Education per student (% of p.c. GDP)
Education 1985 1994 2003
Primary 9 13 12
Secondary 6 9 15
Tertiary 38 51 45
Source: World Bank, Education Statistics (various years)
education over the whole period. Since it has been shown that there are very high soci-al returns to primary and secondary education in Turkey, more investment in these areas could prove beneficial.
Besides the public expenditures, the private expenditures on different categories of schooling have also altered over the years in Turkey. According to the World Bank data, the share of private expenditures on primary and secondary schooling as a share of total education expenditures increased from 6% in 1995 to 10.4% in 2002. The same figure for tertiary education was 3% in 1995 and went up to 9.9% in 2002. Mirroring public spen-ding patterns, the bulk of private educational investments are also directed towards higher education. Moreover, the richest households spent 26 times more on each child for edu-cation than the poorer households in 2006. Although, this might not be so problematic at the individual level, at the societal level the uneven private spending and the insufficien-cy of public funds to compensate for the poor will engender further inequalities.
4 Conclusion
The paper has tried to assess the links between education and inequality in Turkey. Income inequality, despite the recent diminution, is a sizeable problem in Turkey and edu-cation opportunities and access to schooling are highly associated with income dispersal. To uncover the effects of schooling on inequality I evaluated the average years of schoo-ling, distribution of education across income groups and spending on education. Additi-onally, the private and public spending on education is examined.
The higher social and private returns to tertiary education indicate that more spending in this category could bring higher earnings. Nonetheless, as I conclude from the data, in the Turkish context, the private returns to higher education are relatively greater than their social returns. More importantly, a secondary school certificate offers very similar rates of return. Therefore, spending on secondary education will contribute to the earnings of this category both individually and socially. Besides, Schultz (1988) has argued that po-sitive externalities from education are highest at the primary and the secondary level and progressively decline at tertiary level. The individuals receive a larger share of social be-nefits in terms of wages in the case of higher education while primary and secondary edu-cation has positive spillovers. Equally importantly is the access to eduedu-cation.
In Turkey, the education premium is quite high and households with greater levels of schooling manage to earn significantly higher incomes. This in turn contributes to their willingness to invest in their children’s education. Thus, intergenerational inequalities will be reproduced if educational opportunities are not expanded and made available to the poor. Moreover, there are still considerable private and social returns on primary and secondary schools in Turkey; hence, funding these types of education will be beneficial both individually and socially. I argue that Turkish government is not investing suffici-ently into education. The overall level of expenditure on education lags behind that of the OECD countries. Also, Turkey is spending relatively higher amounts on tertiary educa-tion while expenditures on primary and secondary educaeduca-tion are significantly below the OECD averages. This has limited public spending on primary and secondary education and growing private spending increases the spread between various income groups.
LITERATURE
Becker, G. S. and Chiswick, B. R., 1966. “Education and the Distribution of Ear-nings”. American Economic Review, 56 (Supplement), 358-369.
Bowles, S. and Gintis, H., 2002. “The Inheritance of Inequality”. Journal of Econo-mic Perspectives, 16 (3), 3-30.
Chinhui, J., Murphy, K. M. and Pierce, B., 1993. “Wage Inequality and the Rise in Returns to Skill”. Journal of Political Economy, 101 (3), 410-442.
Chiswick, B. R. 1974. Income Inequality: Regional Analyses within a Human Capi-tal Framework. New York: NBER.
Chu, H. -J., 2000. “The Impacts of Educational Expansion and Schooling Inequality on Income Distribution”. Quarterly Journal of Business & Economics,39 (2), 39-49.
Ciccone, A., Cingano, F. and Cipollone, P., 2004. “The Individual and Social Re-turn to Schooling in Italian Macro Regions” [online]. Available from: [http://www.ente-luigieinauid.it].
Cornia, A. and Kiiski, S., 2001. “Trends in Income Distribution in the Post-World War II Period: evidence and interpretation”. UNDP Discussion Paper, No. 93.
Dayioglu, M and Tunalı, İ., 2004. Falling Behind While Catching Up: Changes in the Female-Male Wage Differential in Urban Turkey, 1988 to 1994. Mimeo. Istambul: Koc University.
Dayioglu, M. and Kasnakoglu, Z., 1997. “Kentsel Kesimde Kadın ve Erkeklerin İşgücüne Katılımları ve Kazanç Farklılıkları”. METU Studies in Development, 24 (3), 329-361.
Doessel, D. P. and Valadkhani, A., 1998. “An Analysis of Government Capital Ex-penditure in Iran, 1963-1993, Using Non-Nested Tests”. The Middle East Business and Economic Review, 10 (1-2), 1-17.
Eco-nomy: The Real Economy, Corporate Governance and Reform and Stabilization Policy. Routledge.
Gregorio, J. and J.W. Lee. 2002, “Education and Income Inequality: new evidence from cross country data”. Review of Income and Wealth, 48 (3), 395-416.
Gursel, S. [et al.], 2000. Individual Income Distribution in Turkey. Istanbul: Turkish Industrialists’ and Businessmen’s Association.
Hatakenaka, S., 2006. Higher Education in Turkey for the 21st Century: Size and Composition [online]. Available from: [http://siteresources.worldbank.org/EXTECARE- GTOPEDUCATION/Resources/444607-1192636551820/S._Hatakenakas_report_on_Hi-gher_Education_in_Turkey_for_21st_Century_Nov_2006.pdf].
Hendel, I., Shapiro, J. and Willen, P., 2004. “Educational Opportunity and Income Inequality”. Federal Reserve Bank of Boston Public Policy Discussion Paper, No. 04-5.
Jimenez, E., 1986. “The Public Subsidization of Education and Health in Developing Countries: a review of equity and efficiency”. Research Observer, (1), 111–129.
Kasnakoğlu, Z. 1997. “Income Distribution in Turkey: Who Gets What?” Private View(Autumn). Istanbul.
Lachler, U., 1998. “Education and Earnings Inequality in Mexico”. World Bank Po-licy Research Working Paper,No. 1949.
Mincer, J., 1974. Schooling, Experience, and Earnings. New York, NY: National Bureau of Economic Research.
Mohan, R. and Sabot, R. H., 1988. “Educational Expansion and the Inequality of Pay: Columbia 1973-1978”. Oxford Bulletin of Economics and Statistics, (50), 175-182.
Ocampo, J., 1998. “Income Distribution, Poverty and Social Expenditure in Latin America”. ECLAC Working Paper, No. 6.
Partridge, J. S., Partridge, M. D. and Rickman, D. S., 1998. “State Patterns in Fa-mily Income Inequality”. Contemporary Economic Policy, 16 (3), 277–294.
Persson, T. and Tabellini, G., 1994. “Is Inequality Harmful for Growth”. American Economic Review,84 (3), 600-621.
Psacharopoulos, G. and Patrinos, H. A., 2002. “Returns to investment in educati-on: a further update”. Policy Research Working Paper Series, No: 2881.
Psacharopoulos, G., 1994. “Returns to investment in education: A global update”. World Development,(22), 325-1343.
Ram, R., 1990. “Educational Expansion and Schooling Inequality: International Evi-dence and Some Implications”. Review of Economics and Statistics, 72 (2), 266-274.
Restuccia, D. and Urrutia, C., 2004. “ Intergenerational Persistence of Earnings The Role of Early and College Education”. American Economic Review, 94, 1354-1378.
Schultz, T. P., 1988. “Education investments and returns” in: H. Chenery and T. N. Srinivasan, eds. Handbook of Development Economics, 543-630.
Sylwester, K., 2002. “Can Education Expenditures Reduce Income Inequality?”. Economics of EducationReview, 21 (1), 43–52.
Tansel, A., 1994. “Wage Employment, Earnings and Returns to Schooling for Men and Women in Turkey”. Economics of Education Review, 13 (4), 305-320.
Tansel, A., 2004. Education and Labor Market Outcomes in Turkey.Background Report for World Bank Report. Istambul: Education Sector Study.
Turkmen, F., 2002. Egitimin Ekonomik ve Sosyal Faydalari ve Turkiye’de Egitim Ekonomik Buyume Iliskisinin Arastirilmasi. Mimeo. Ankara: State Planning Institute.
World Bank, 2006.2005 World Development Report. Washington, D.C.: World Bank.