ISSN 0975-928X
Research Note
Possible effect of threshing method on grain iron and zinc density
estimation in pearl millet: a contribution to biofortification breeding
Mahalingam Govindaraj
Crop Improvement, International Crops Research Institute for the Semi-Arid Tropics (ICRISAT), Patancheru – 502 324
E-mail: [email protected]
(Received: 16 Feb 2017; Revised: 01 June 2017; Accepted: 24 June 2017)
Abstract
In crop biofortification research, threshing part is the primary place of contamination while dealing with grain mineral traits such as iron (Fe) and zinc (Zn) density, thus type of threshing operation is one of the important and effective factors for efficient grain mineral traits determination. This study is aimed at the effects of threshing methods namely power-operated single-head thresher and manual-hand threshing on Fe and Zn density estimation. In this context, 50 pearl millet progenies each from two broad-based populations (AIMP 92901 and ICMR 312) were evaluated in field condition and tested for machine and hand threshing. Grain samples were analyzed for Fe and Zn density using Inductively Coupled Plasma Optical-Emission Spectrometry (ICP-OES) method. The analysis of variance showed the significant difference among population progenies for these micronutrients by recording two-fold variations for Fe (40-91 mg kg-1) and Zn (32-74 mg kg
-1
) density. Threshing method had significant effect, however, estimated Fe and Zn values from both the methods were highly comparable, further non-significant t-test and linear correlations-coefficients showed machine-threshed samples results were highly positively significantly correlated with hand-threshed samples values for both micronutrients (r=0.88 to 0.93; p<0.01 for Fe and r= 0.92 to 0.95; p<0.01 for Zn) in two populations. This study indicating the high levels of consistency on ranking of test entries and threshing method has no effect on grain Fe and Zn estimation. Therefore, single-head thresher will be a reliable and faster method for large-number of breeding materials threshing and its grain micronutrient determination in pearl millet biofortification.
Key words
Biofortification; iron; pearl millet; threshing; zinc
Pearl millet is an important climate-smart cereal and staple food in dry areas of Asia and Africa and grown on an area about >26 million ha, predominately in India (9 m ha). Dominant pearl millet cultivated areas in India are Rajasthan, Haryana, Maharashtra, Gujarat and Uttar Pradesh where majority of the populations relies upon pearl millet grain as a staple food and its fodder for animal husbandry (Yadav and Rai, 2013) and these states contributes a larger portion of total area (70%) and production (80%). Micronutrient malnutrition is primarily caused by inadequate intake of essential nutrients, particularly prevalent among resource poor families in the developing world, has emerged as a major health challenge where they mainly rely on cereal-based diet as staple food. India is home to a large number of undernourished people (18% of its population) in the world, where 42% of children (<3 years old) are underweight and 58% of them are stunted by two years of age (FAO/WFP/IFAD, 2012). Historically, pearl millet is well known for its total nutritional values but not all the released and commercialized cultivars (varieties and hybrids) has its unique nutritional levels as they were selectively bred for high yield potential with an average grain Fe level in the marketed hybrids was ≤45 mg kg-1. For instance, a recent study (Rai et
al., 2016) on released cultivars (18 open-pollinated varieties and 122 hybrids), jointly conducted by ICRISAT and All India Coordinated Pearl Millet Improvement Project, showed Fe density varying from 42 to 67 mg kg-1 in varieties
and from 31 to 61 mg kg-1 in hybrids. The zinc density varied from 37 to 52 mg kg-1 in varieties and from 32 to 52 mg kg-1 in hybrids. Clearly, all of these pearl millet cultivars had much higher Fe and Zn levels than the best rice and wheat varieties (less than 20-30 mg kg-1).
ISSN 0975-928X
of Fe and Zn contamination are residues from soils, grain handling threshers and residues from human hands used during the preparation of grain samples (Sager and Mittendorfer, 1997; Jones, 2001). These types and sources of contaminations are generally not consistently reproduced in replicated analysis. Therefore, grain aluminum (Al) levels have largely been used to identify genotypes that are contaminated (Stangoulis and Sison, 2008). Al is even more abundant in soil than the Fe level (Ibia, 2002; Rauch and Pacyna, 2009) but is not found in clean plant tissue and is easily analyzed by ICP–OES, it can be used as an indicator of soil contamination. Typically, soil contamination of grain is considered to be acceptably low in grain analysis reports where Al is present at <5 mg kg−1 (Pfeiffer and McClafferty, 2007). The Al factor is now highly considered for selection and advancement of high-iron progenies in breeding program. After harvest, threshing is primary place for contamination while dealing with grain mineral traits, thus type of threshing operation is one of the important and effective factors for efficient grain mineral traits determination. For instance, if iron-blade thresher used then higher possibility of grain Fe level may get biased particularly on higher estimation as the Fe also comes from dusts/any other materials while handling. There is no information in the literature relating Fe and Zn density with the thresher effect in biofortification crops including pearl millet. This study is aimed at the effects of panicle threshing methods namely power –operated single head machine thresher and manual-hand threshing on Fe and Zn density estimation.
Genetic materials: This study consisted of 50 progenies each from two open-pollinated varieties (OPVs) namely AIMP 92901 and ICMR 312. Both the OPVs are early-maturing and possess bold seeds with ample variation for grain Fe and Zn within these populations (Govindaraj et al.,
2016). AIMP 92901 was jointly developed by ICRISAT and Marathwada Agricultural University, National Agricultural Research Project Station, Aurangabad, Maharashtra, by random mating of Bold-Seeded Early Composite (BSEC) progenies and it was found resistant to downy mildew (Sclerospora graminicola (Sacc. Schroet.) in screening at ICRISAT. AIMP 92901 was released in 2001 for cultivation in peninsular India. ICMR 312 was developed at ICRISAT by mass selection in BSEC with further progeny testing to improve its male fertility restoration ability and resistance to downy mildew. ICMR 312 is a pollen parent of a topcross hybrid ICMH 312 which was developed at ICRISAT and released in 1993 for cultivation in peninsular India.
Seed production: These populations were planted in Alfisol (red soil) at Patancheru, during the 2010 summer season in 4 beds (i.e., 20 row of two meter
bed-1) to produce >100 selfed (S1) progenies. In
each plot, 8-10 random plants were selfed using parchment paper bag at boot leaf stage. About 50 S1s progenies were randomly selected from the field trials owing to its self-seed set more than 70 percent to meet the required quantity of seed for planting and to avoid any genotypic dependence on seed set percentage which is expected to influence grain micronutrient density.
Field trial and grain sample production: All these S1s seeds were planted in 2010 rainy season in 4m plots with spacing of 75 cm between rows and 15 cm between plants and replicated twice. The seedlings were thinned at 15 days after sowing to maintain one seedling per hill at a spacing of approximately 10-cm. Basal dose of 100 kg of DAP (Diammonium phosphate, contains 18%N: 46%P) was applied at the time of field preparation and 100 kg ha-1of urea (46%N) was applied as side-dressing after the thinning. Ten random plants in each plot were selfed at the panicle emergence stage. At maturity, 5-6 panicles that had self-seed set percentage above 80 percent in every plot were harvested and sun dried for 15 days.
ISSN 0975-928X
Analysis of variance: Analysis of variance showed highly significant genotypic variation for Fe and Zn density in progenies derived from both the populations (Table 1). Similarly, results showed the significant differences among two-threshing methods (P<0.01) on the grain Fe and Zn density in both population progenies. However, genotypic variance was greater than the variance due to threshing methods as the effect of methods that contributed one-third of genotypic variances. Although results showed significant differences between hand and machine threshing for Fe density, however, regardless of the populations, the method within genotype mean squares was lesser magnitude than the genotypic mean squares for Fe and Zn density (Table 1). The Al density showed significant variation but Al was not a genotypic origin as it comes either dust/metal contaminant and in very much lower magnitude, and all the samples had acceptable level (<5 mg kg-1) suggesting no significant contamination occurred during the threshing process.
Genetic variability: The mean coefficient of variation (CV) for Fe density in each population varied from 9.0 to 9.6% for hand threshing and from 11.3 to 12.7% for machine threshing, while for Zn density it varied from 9.0 to 9.3% for hand threshing and from 10.7 to 12.0% for machine threshing, revealed that CV for machine threshing was about 3% higher than the hand threshing for both Fe and Zn density and these were much lesser than most of the highly heritable traits. The Fe density among AIMP 92901 progenies varied between 40 and 81 mg kg-1 in the machine thresh and 41 to 77 mg kg-1 in hand thresh, while the Zn density varied 37 to 70 mg kg-1 and 37 to 74 mg kg-1, respectively with similar average Fe (57 mg kg-1) and Zn (53 mg kg-1 ) density in both the methods (Table 2). Of these, five progenies had high Fe (66-81 mg kg-1) and four had high Zn (65-70 mg kg-1) density in both the methods. The Fe density among ICMR 312 progenies varied from 43-85 mg kg-1 in the machine method 41-91 mg kg-1 in hand method, while the mean Zn density
varied from 32-65 mg kg-1 to 32-69 mg kg-1, respectively, with similar average Fe (60-61 mg kg-1 ) and Zn (51 mg kg-1 ) density in both the methods. Of these, 14 progenies had high Fe (66-91 mg kg-1) and high Zn (59-69 mg kg-1) density. Similar larger variability for these micronutrients was reported in pearl millet (Velu et al., 2008; Govindaraj et al., 2011, 2016; Rai et al., 2012).
Differences in threshing methods: Regardless of the populations and its derived progenies, the machine thresh revealed that, 12-18% of the entries had ≤55 mg kg-1 Fe, 18-28% of the entries
had >65 mg kg-1 Fe, with 4-10% of these exceeding 75 mg kg-1 Fe level, while 12-18% of entries had ≤55 mg kg-1 Fe, 14-24% of entries had
>65 mg kg-1 Fe with 2-10% of these exceeding 75
mg kg-1 Fe density (Table 3). A similar pattern was observed for Zn density, with 38-46% of the entries in machine method, and 42-46% of the progenies having ≤50 mg kg-1 Zn density while
0-6% of entries in Machine method and 0-6% of entries in hand method having >65 mg kg-1 Zn density in both the populations. With this, progenies in the micronutrients class (low ≤50 mg kg-1; medium 51-65 mg kg-1; high ≥66 mg kg-1) in both the threshing methods was shown close consistency patterns for Fe and Zn density (Table 3) as number of entries in low-Fe class for both methods was similar (18% in AIMP92901 and 12% in ICMR312) and in other class, either for Fe or Zn density, machine and hand threshed samples had 4% and 6 % higher Fe and Zn, respectively. Thus, the entries differed within the micronutrient class are just 4-6% for both Fe and Zn density indicate the close proximity and consistency among threshing methods and no bearing effect on these micronutrients. In both population progenies, although the mean differences between two threshing methods were 7-18 mg kg-1 for Fe density and 9-14 mg kg-1 for Zn density, however, the mean differences across progenies were just 0-1 mg kg-1 for Fe and Zn density. Further, results can explain that the differences ≥ 5 ppm between two threshing method at every progenies varied 18-22% for Fe density and 10-12% for Zn density. The similar effect of threshing method and differences for grain quality traits such oil and protein content was reported in soybean (El-Abady
et al., 2012).
The paired‘t’-calculated value are lesser that of table value for both micronutrients (Table 3), failing to reject the null hypothesis (H0: μ1 = μ2) so
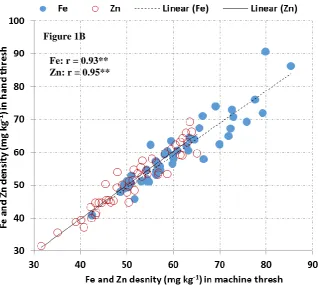
results would not be statistically different between the two methods and average micronutrients of both threshing methods are very similar at a probability level of 5%; which is again confirms the differences between the results obtained from both methods are highly negligible. Assuming the variances of both threshing methods are not independent, as every sample is exposed equally to both the threshing method, the correlation coefficients were estimated for each population to compare the precision of hand threshing with that of machine threshing method. The results showed that, machine threshed samples were highly positively significantly correlated with hand threshed samples for Fe density (p<0.01) in these two population progenies, however, the magnitude of coefficients was varied from 0.88 in AIMP 92901 (Figure 1A) to 0.93 in ICMR 312 (Figure 1B). A similar pattern was observed for Zn density (r=0.92-0.95; P<0.01). Although earlier studies in pearl millet reported highly positive and significant association between these micronutrient (Rai et al.,
ISSN 0975-928X
and highly significant correlation coefficient between these two threshing methods in both the populations for grain Fe and Zn density, indicating high levels of consistency of the ranking of entries across the methods as well as populations for these micronutrients in pearl millet. Thus, stainless machine thresher can be effectively used for panicle threshing while dealing with a large number of entries or trials in pearl millet biofortification programs targeting genetic improvement for these micronutrient densities.
Conclusions
In order to reduce possible contaminations during threshing, processing and storage in pearl millet biofortification materials, and based on this study, use of the single-head thresher in threshing of biofortified lines has shown the comparability of results between threshing methods and had no effect on grain Fe and Zn estimation. Therefore, manual harvesting followed by single-head machine threshing found to be reliable and economical for selection and advancing large number of high-iron germplasm/lines and cultivars in biofortification program. The present results merit further evaluation using large numbers of populations/cultivars of pearl millet and different type thresher (multi-head thresher for commercial case) for large-scale applications.
Acknowledgements
This study was undertaken with pearl millet biofortification breeding program support from the HarvestPlus Challenge Program of the CGIAR.
References
El-Abady, M.I., El-Emam, A.A.M., Seadh S.E. and Yousof, F.I. 2012. Soybean Seed Quality as Affected by Cultivars, Threshing Methods and Storage Periods. Res. J. Seed Sci., 5: 115-125. FAO/WFP/IFAD., 2012. The State of Food Insecurity in
the World. Economic growth is necessary but not sufficient to accelerate reduction of hunger and malnutrition. Rome, FAO: PP. 61.
GenStat, Version 14. 2011. Lawes Agricultural Trust, Rothamsted Experimental Station, UK.
Gomez, K.A. and Gomez A.A. 1984. Statistical procedures for agricultural research. 2nd Edition, John Wiley & Sons, New York, USA.
Govindaraj, M., Rai K.N. and Shanmugasundaram, P. 2016. Intra-population genetic variance for grain iron and zinc contents and agronomic traits in pearl millet. The Crop Journal,04: 48-54. Govindaraj, M., Rai, K. N., Pfeiffer, W. H., Kanatti, A.
and Shivade, H. 2016. Energy-Dispersive X-ray Fluorescence Spectrometry for Cost-effective and Rapid Screening of Pearl Millet Germplasm and Breeding Lines for Grain Iron and Zinc Density. Comm. Soil Sci. Pl. Anal.,47:18, 2126-2134.
Govindaraj, M., Selvi, B. and Sudhir Kumar, I., 2011. Genetic diversity studies in indigenous pearl millet [Pennisetum glauccum (L.) R. Br.] accessions based on biometrical and nutritional
quality traits. Indian J. Plant Genet. Resour., 24:
186–193.
Ibia, T.O. 2002. Forms of Fe and Al in soil profiles of inland flood plains of South Eastern Nigeria. Nig. J. Soil Res.,3:72–77.
Jones, J.B. 2001. Plant analysis. in: Laboratory guide for conducting soil tests and plant analysis. CRC Press, Boca Raton, FL, PP. 191–239.
Kanatti, A., Rai, K.N., Radhika, K. and Govindaraj, M., 2016. Genetic architecture of open-pollinated varieties of pearl millet for grain iron and zinc densities. Indian J. Genet. Pl. Breed., 76: 299-303.
Kanatti, A., Rai, K.N., Radhika, K., Govindaraj, M., Sahrawat, K.L., Srinivasu, K. and Shivade, H. 2014. Relationship of grain iron and zinc content with grain yield in pearl millet hybrids. Crop Improv.,41: 91-96.
Pfeiffer, W.H. and McClafferty, B. 2007. HarvestPlus: Breeding crops for better nutrition. Crop Sci.,47: S88–S105.
Rai, K.N., Yadav, O.P., Govindaraj, M., Pfeiffer, W.H., Yadav, H.P., Rajpurohit, B.S., Patil, H.T., Kanatti, A., Rathore, A., Rao, A.S. and Shivade, H., 2016. Grain iron and zinc densities in released and commercial cultivars of pearl millet (Pennisetum glaucum). Indian J Agric Sci., 86: 11-16.
Rai, K.N., Govindaraj, M. and Rao A.S. 2012. Genetic enhancement of grain iron and zinc content in pearl millet. Qual. Assur. Saf. Crops Foods,
4:119–125.
Rauch, J.N. and Pacyna, J.M. 2009. Earth’s global Ag, Al, Cr, Cu, Fe, Ni, Pb, and Zn cycles. Global Biol. Cycles,23: GB2001.
Sager, M. and Mittendorfer, J. 1997. Influence of milling or cutting procedures on trace element contents of plant samples. Int. J. Environ. Anal. Chem., 67: 59–71.
Snedecor, G.W. and Cochran, W.G. 1967. Statistical methods, 6th Edition,Ames, IA: The Iowa State University Press.
Stangoulis, J. and Sison, C., 2008. Crop sampling protocols for micronutrient analysis. HarvestPlus Tech. monogr. series 7. HarvestPlus, Washington, DC. http://www.harvestplus.org /sites/default/files/TM7%20complete.pdf (accessed 5th Jan 2017).
Velu, G., Rai, K.N. and ahrawat K.L. 2008. Variability for grain iron and zinc content in a diverse range of pearl millet populations. Crop Improv.,
35:186-191.
Wheal, M.S., Fowles, T.O. and Palmer L.T. 2011. A cost-effective acid digestion method using closed polypropylene tubes for inductively coupled plasma optical emission spectrometry (ICP-OES) analysis of plant essential elements. Anal. Method., 3: 2854–2863.
Yadav, O.P. and Rai, K.N. 2013. Genetic Improvement of Pearl Millet in India. Agric.Res., 2: 275-292 Yasmin, Z., Paltridge, N., Graham, R., Huynh, B. and
ISSN 0975-928X
672
Table 1. Analysis of variance for iron (Fe), zinc (Zn) and aluminum (Al) density in pearl millet
Source df Fe density Zn density Al density AIMP92901 ICMR312 AIMP92901 ICMR312 AIMP92901 ICMR312
Replication 1 977.3 557.0 568.3 496.1 3.97 0.00
Genotype (G) 49 256.5** 357.2** 251.8** 254.3** 1.75 2.86**
Error (a) 49 70.7 62.5 56.6 45.5 1.18 0.67
Threshing /G 50 100.6** 92.2** 67.3** 65.0** 1.77** 4.09**
Error (b) 50 13.2 13.2 7.9 8.0 0.17 0.13
CV (%) 10.5 9.3 10 9.3 28.7 23.9
LSD (5%) 11.94 11.24 10.69 9.58 1.65 1.26
SE (m) 6.48 6.15 5.68 5.17 0.82 0.63
** significant at the 1% probability level
Table 2. Mean and range for iron (Fe) and zinc (Zn) density of two threshing method in pearl millet
Micronutrient class (ppm)
AIMP 92901 ICMR312 Machine Hand Machine Hand
Fe Mean 57 56 61 60
Range 40-81 41-77 43-85 41-91
CV (%) 12.7 9.6 11.3 10.7
Zn Mean 53 53 51 51
Range 37-70 37-74 32-65 32-69
CV (%) 12.0 9.0 9.0 9.3
CV, co-efficient of variation for threshing methods
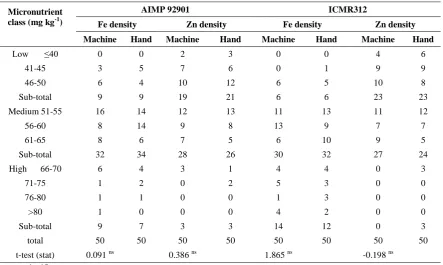
Table 3. Frequency distribution and t-test for iron (Fe) and zinc (Zn) density of two threshing method in pearl millet population progenies
Micronutrient class (mg kg-1)
AIMP 92901 ICMR312
Fe density Zn density Fe density Zn density Machine Hand Machine Hand Machine Hand Machine Hand
Low ≤40 0 0 2 3 0 0 4 6
41-45 3 5 7 6 0 1 9 9
46-50 6 4 10 12 6 5 10 8
Sub-total 9 9 19 21 6 6 23 23
Medium 51-55 16 14 12 13 11 13 11 12
56-60 8 14 9 8 13 9 7 7
61-65 8 6 7 5 6 10 9 5
Sub-total 32 34 28 26 30 32 27 24
High 66-70 6 4 3 1 4 4 0 3
71-75 1 2 0 2 5 3 0 0
76-80 1 1 0 0 1 3 0 0
>80 1 0 0 0 4 2 0 0
Sub-total 9 7 3 3 14 12 0 3
total 50 50 50 50 50 50 50 50
t-test (stat) 0.091 ns 0.386 ns 1.865 ns -0.198 ns
ISSN 0975-928X
673
Fig. 1. Interrelationship between hand and machine threshing methods for iron (Fe) and zinc (Zn) density in pearl millet population progenies
(A. AIMP92901, n=50; B. ICMR312, n=50), ** significant at 1% probability level Fe: r = 0.93**
Zn: r = 0.95** Figure 1B