Remote Lab in Instrumentation and Control
Engineering Using LabVIEW
A. K. Singh,
S. Chatterji,
and S. L. Shimi
Department of Electrical Engineering, NITTTR, Chandigarh, India Email: {amitsingh6711, shimi.reji}@gmail.com,[email protected]
A. Gaur
Department of Electronics and Instrumentation Engineering, RGGI, Meerut, India Email: [email protected]
Abstract—Remote enabled Laboratory implementation of
Instrumentation and Control Lab is shown in this work. Many principles related with Instrumentation can be demonstrated by means of Remote enabled laboratory and it is the advancement in Instrumentation course teaching. The characteristic of LM35, LDR and Photodiode is shown in this work. One application of RPM measurement and control of PMDC motor is also shown in this work. By using LabVIEW developing software investigator has developed the remote laboratory for engineering students. The circuits as well as the combination of real and virtual are novel. The remote laboratories were developed using LabVIEW virtual instrumentation and they enable web control and
monitoring of the laboratory equipment, allowing
engineering students to perform the experiments in real time, at their own computers, from anywhere and whenever is suitable for them and also at reduced cost.
Index Terms—remote laboratory, instrumentation and control, RPM of PMDC motor
I. INTRODUCTION
Laboratories, which are found in all engineering and science programs, are an essential part of the education experience. Not only do laboratories demonstrate course concepts and ideas, but they also bring the course theory alive so students can see how unexpected events and natural phenomena affect real-world measurements and control algorithms. However, equipping a laboratory is a major expense and its maintenance can be difficult. Teaching assistants are required to set up the laboratory, instruct in the laboratory and grade laboratory reports. These time-consuming and costly tasks result in relatively low laboratory equipment usage, especially considering that laboratories are available only when equipment and teaching assistants are both available [1]-[12].
All of these and many more exciting applications are now easily achievable with the new technology available with National Instruments LabVIEW remote panels. With this standard feature of LabVIEW, a user can quickly and effortlessly publish the front panel of a LabVIEW program for use in a standard web browser. Once
Manuscript received February 14, 2014; revised July 22, 2014.
published, anyone on the web with the proper permissions can access and control the experiment from the local server. If the LabVIEW program controls a real-world experiment, demonstration, calculation, etc., LabVIEW remote panels turns the application into a remote laboratory with no additional programming or development time [13]-[15].
II. BLOCK DIAGRAM OF THE SYSTEM
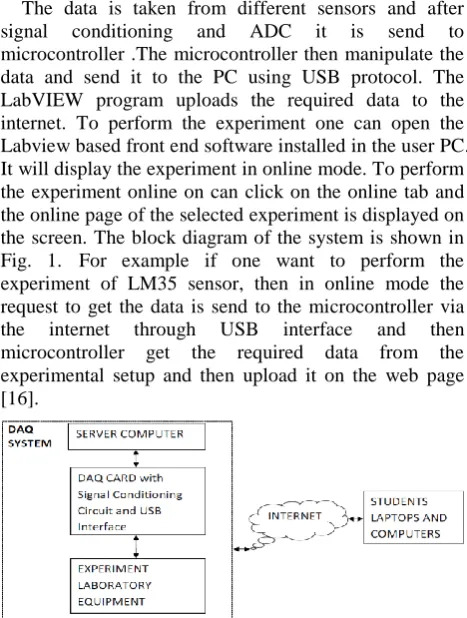
The data is taken from different sensors and after signal conditioning and ADC it is send to microcontroller .The microcontroller then manipulate the data and send it to the PC using USB protocol. The LabVIEW program uploads the required data to the internet. To perform the experiment one can open the Labview based front end software installed in the user PC. It will display the experiment in online mode. To perform the experiment online on can click on the online tab and the online page of the selected experiment is displayed on the screen. The block diagram of the system is shown in Fig. 1. For example if one want to perform the experiment of LM35 sensor, then in online mode the request to get the data is send to the microcontroller via the internet through USB interface and then microcontroller get the required data from the experimental setup and then upload it on the web page [16].
Figure 1. Block diagram of the system
III. HARDWARE
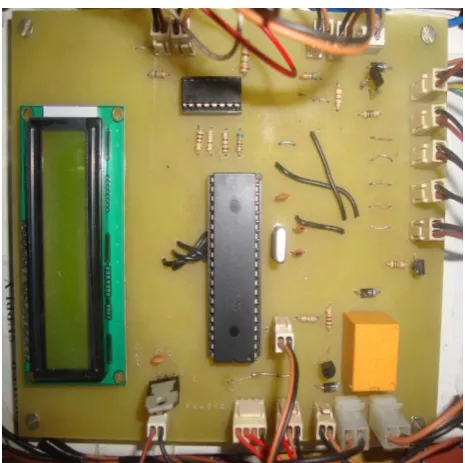
LCD, relay, USB connector and different sensors connectors etc. The circuit diagram is developed using Orcad Capture software. The microcontroller has in built 10 bit ADC, which converts the output voltages of the sensors into digital data. The voltages from sensors are readied through the ADC channel of the microcontroller. It is then processed and converted into a format to be displayed on the LCD and is sending to host computer using USB protocol. At computer side LabVIEW firmware receive this data. The power supply to the hardware is provided by the host computer through USB port and 12V dc SMPS. The hardware is simple, reliable and very cost effective. The LCD is used to monitor the hardware of experiment and for debugging purpose. First card circuit diagram in Orcad Capture is shown in Fig. 2, the signal conditioning of sensors to microcontroller is shown in Fig. 3.
R3 R S_C_PD3 RS PGD S_C_PD2 PGM Q1 BC547 S_C_PD1 R5 POT MCLR LS2
BULB RELAY LM35
3 5 4 1 2 U3 18f4550 1 2 3 4 5 6 7 8 9 10 11 12 13 14 15 16 17 18 19 20 21 22 23 24 25 26 27 28 29 30 32 33 34 35 36 37 38 39 40 31 MCLR RA0 RA1 RA2 RA3 RA4 RA5 RE0 RE1 RE2 VDD VSS CLK1 CLK0 RC0 RC1 RC2 VUSB RD0 RD1 RD2 RD3 RC4/D-RC5/D+ RC6 RC7 RD4 RD5 RD6 RD7 VDD RB0 RB1 RB2 RB3 RB4 RB5 RB6 RB7 VSS LDR_S_O J1 12VCC 1 2 LS1
FAN RELAY LM35
3 5 4 1 2 C4 CAP NP PGD RPM_S D1 DIODE MCLR PGC LDR_L_S3 R2 R GND Y1 CRYSTAL VCC VCC_12 J4 BULB CON_LM35 1 2 J6 PROG_CON 1 2 3 4 5 6 LDR_L_S2 GND R1 R GND PWM_DC_M D2 DIODE LDR_L_S1 C1 CAP NP C_LM35 U1 LM7805C/TO 1 3 2 IN OUT GN D 0 EN RS VCC PGC EN J7 USB CON 1 2 3 4 VCC Q2 BC547 PD_A_S R4 R 0 R6 R J3 Bulb_Supp_LM35 1 2 N GND
C3CAP NP J22
CON3
123
VCC GND 0 C5 CAP NP GND J2
FAN CON LM35
1 2 GND P C_LM35 J5 LCD CON 1 2 3 4 5 6 7 8 9 10 11 12 13 14 15 16 PGM
Figure 2. Circuit diagram of DAQ card
The circuit is made using PIC18F4550 microcontroller. It consists of the USB port and 10 bit ADC which is the basic requirement of the required system. The microcontroller is operated at 20Mhz frequency. The 16*2 smart LCD is used to display the concern experiment data to be visualized at the remote end of the experiment. LM7805 is used to provide the 5V dc supply for the system. J6 is the programming connector for ISP programming of the microcontroller. Power transistor is used for PMDC motor control. 12 V dc Relays are used for the bulb control. Different connectors are used to connect the PCB with the experimental setup.
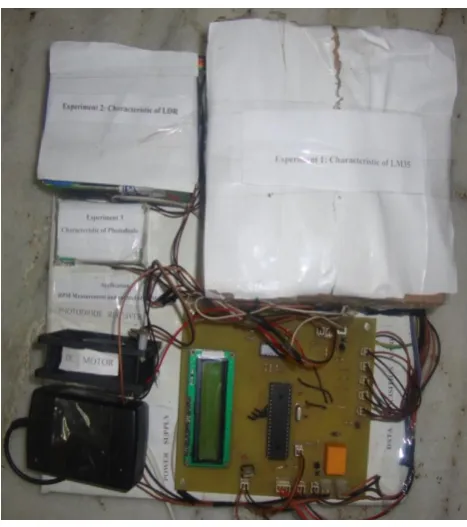
The diagram of DAQ card and the experimental setup is shown in Fig. 4 and Fig. 5 respectively.
0 J8 Led1 1 2 U4 74HC138 8 15 14 13 12 11 10 9 7 1 2 3 5 4 6 16 GN D Y0 Y1 Y2 Y3 Y4 Y5 Y6 Y7 A B C G2B G2A G1 VC C U5 4051 6 8 11 10 9 16 7 3 13 14 15 12 1 5 2 4 EN GN D A B C VDD VEE X X0 X1 X2 X3 X4 X5 X6 X7 VCC R31 R 0 R21 R R14 R Q3 BD139 Q4 BC547 LDR_S_O 0 R7 R VCC 0 0 PD_A_S R18R R30 R 0 R20 R 0 R13 R VCC R27 R R22 R 0 J11 Led3 1 2 R28R 0 R24 R RPM_S R10 R J15 Led5 1 2 LDR_L_S1 J9 Led2 1 2 R8 R J13 Led4 1 2 R19 R LDR_L_S2 J17 DC_M_CON 1 2 J18 Led7 1 2 PWM_DC_M J20 PD_RPM_TX 1 2 J16 Led6 1 2 J14 PD_C_RX 1 2 VCC S_C_PD1 R23 R R25 R 0 VCC_12 R17 R R29 R R15 R R12 R LDR_L_S3 R9 R J10 LDR_CON 1 2 0 S_C_PD2 R11 R D3 DIODE J12 PD_C_TX 1 2 J21 PD_RPM_RX 1 2 S_C_PD3
Figure 3. Circuit diagram of signal conditioning of DAQ card
Figure 5. Photo of experimental setup
A. Experiment: Characteristic of LM35
The data of LM35 is taken through con3 connector. This analog voltage is sent to analog PortRA3 which has in built ADC on this port and convert the analog signal into 10 bit digital signal. This signal is converted into voltage and sends temperature and voltage readings to the host PC using LabVIEW software. The experimental setup of this experiment is shown in Fig. 6.
Figure 6. Experimental setup of LM35 experiment
It consists of the AC bulb, LM35 sensor and DC fan. When the student starts the experiment by opening the LabVIEW program the microcontroller gets the address for the experiment and on the bulb. As soon as the bulb is ON the chamber temperature of the experiment increases thereby increasing the temperature of the LM35 and the output voltage of LM35 increases which is proportional to the chamber temperature. This data is then sent to student laptop through microcontroller via USB port. The LabVIEW plot the graph. After completing the experiment the LabVIEW stops the experiment. Then the microcontroller of the bulb and ON the dc fan for cooling the experimental chamber for some duration .After then the dc fan is also stopped and the system is ready for next experiment [17].
B. Experiment: Characteristic of Light Dependent
Resistor
The data of LDR is taken through LDR_CON connector. This analog voltage is sent to analog Port RA3 which has in built ADC on this port and convert the analog signal into 10 bit digital signal. This signal is converted into light intensity and resistance and then sends this data to the host PC using LabVIEW software. The experimental setup of this experiment is shown in Fig. 7. It consists of the white LED’s and LDR sensor. When the student starts the experiment on his laptop and run the LabVIEW program the microcontroller gets the address for the experiment and on the LED’s. As soon as the LED’s are ON the resistance of LDR changes. This data is then sent to student laptop through microcontroller via USB port. The LabVIEW plot the graph. After completing the experiment the LabVIEW stops the experiment. After then the system is ready for next round of experiment.
C. Experiment: Characteristic of Photodiode
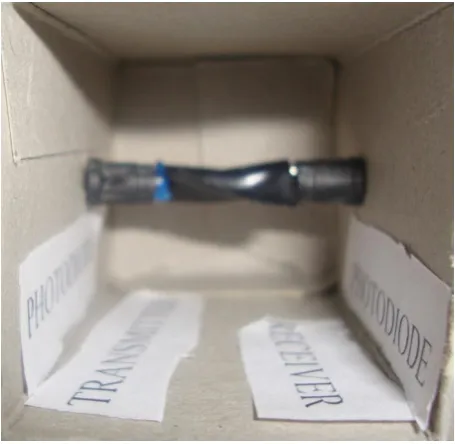
The data of photodiode is taken through J12 and J14 connector. This analog voltage is sent to analog Port RA1 which has in built ADC on this port and convert the analog signal into 10 bit digital signal. This signal is converted into irradiance and photodiode current and then sends this data to the host PC using LabVIEW software. The experimental setup of this experiment is shown in Fig. 8. It consists of trans-receiver pair of photodiode. When the student starts the experiment on his laptop and run the LabVIEW program the microcontroller gets the address for the experiment and on the trans-receiver photodiode. As soon as the trans-receiver photodiode is ON the photodiode irradiance changes the photodiode current changes. This data is then sent to student laptop through microcontroller via USB port. The LabVIEW plot the graph. After completing the experiment the LabVIEW stops the experiment. After then the system is ready for next round of experiment.
Figure 8. Experimental setup of photodiode experiment
D. Application: Hardware Setup of RPM Measurement
and Control of PMDC Motor
The data of RPM measurement is taken through J20 and J21 connector and the dc motor is controlled through J17 connector. The digital pulse received from photodiode is sent to digital Port RD1. This signal is converted into RPM and then sends the data to the host PC using LabVIEW software. The setup of this application is shown in Fig. 9. When the user starts the application on his laptop and run the LabVIEW program the microcontroller gets the address for the experiment and switches ON the trans-receiver photodiode. As soon as the trans-receiver photodiode is switched ON and the RMP of the dc motor changes the photodiode signal changes. This data is then sent to student laptop through microcontroller via USB port. The LabVIEW displays the RPM of PMDC motor. After completing the application the LabVIEW stops the setup. After that the system is ready for next round [18].
Figure 9. Setup of RPM measurement and control of PMDC motor
IV. SOFTWARE
Software for front end software for remote terminals is designed in LabVIEW. The block diagrams of the different experiments are shown here.
A. Block Diagram for LM35 Experiment
The LM35 series are precision integrated-circuit temperature sensors, with an output voltage linearly proportional to the Centigrade temperature. It has got three terminals. First is supply voltage, second is output voltage and third is ground terminal. The suitable dc voltage is applied at terminal one and we get the output voltage proportional to temperature of the sensor environment.
In this experiment investigator has designed the LabVIEW software to study the characteristic of LM35. The X-Y graph is plotted between output voltage of LM35 and temperature of the experiment chamber. The block diagram of the LM35 characteristic is shown in Fig. 10.
The program consists of the four steps:
Acquire data: The block diagram consists of the VISA functions for reading and writing the data through USB port. When the program is executed the program sends the channel number for the experiment to the microcontroller.
Data manipulations: The address and the data sent by the microcontroller are separated using index array functions. The signal is then manipulated as per the requirement of the experiment variable to be displayed on the graph.
Data representation: The acquired data is checked for the address of the experiment using formula node. If address matches then the manipulated signal is send to the XY graph to be plotted.
Termination of Loop: The loop is terminated using stop button or if the while loop count is completed as specified in the block diagram.
B. Block Diagram for LDR Experiment
A light dependent resistor (LDR) is a semiconductor product either cadmium sulphide or cadmium selenide arranged in a zigzag pattern. The resistance of the material varies with incident light. When it is connected to an external battery current flow depending on the light intensity, the current is controlled by incident light. It is a surface phenomenon. The suitable dc voltage is applied at terminal one and we get the output voltage proportional to resistance.
In this experiment investigator has designed the LabVIEW software to study the characteristic of LDR. The logarithmic X-Y graph is plotted between Illumination of LDR and the resistance of the LDR. The block diagram of the LDR characteristic is shown in Fig. 11.
Figure 11. Block diagram of LDR characteristic
The program consists of the four steps:
Acquire data: The block diagram consists of the VISA functions for reading and writing the data through USB port. When the program is executed the program sends the channel number for the experiment to the microcontroller.
Data manipulations: The address and the data sent by the microcontroller are separated using index array functions. The signal is then manipulated as per the requirement of the experiment variable to be displayed on the graph.
Data representation: The acquired data is checked for the address of the experiment using formula node. If address matches then the manipulated signal is send to the XY graph to be plotted.
Termination of Loop: The loop is terminated using stop button or if the while loop count is completed as specified in the block diagram.
C. Block Diagram for Photodiode Experiment
An Infrared Photodiode is a semiconductor product which is based on the principle of photodiode effect- the generation of a voltage across the PN junction of the semiconductor when the junction is exposed to infrared light. The low Cj planer diffusion type photodiode is used
for the manufacturing of Infrared Photodiode.
In this experiment investigator has designed the LabVIEW software to study the characteristic of Infrared Photodiode. The logarithmic X-Y graph is plotted between Illumination of Infrared Photodiode and the shunt current of the Infrared Photodiode.
The block diagram of the Photodiode characteristic is shown in Fig. 12.
Figure 12. Block diagram of photodiode characteristic
The program consists of the four steps:
Acquire data: The block diagram consists of the VISA functions for reading and writing the data through USB port. When the program is executed the program sends the channel number for the experiment to the microcontroller.
Data manipulations: The address and the data sent by the microcontroller are separated using index array functions. The signal is then manipulated as per the requirement of the experiment variable to be displayed on the graph.
Termination of Loop: The loop is terminated using stop button or if the while loop count is completed as specified in the block diagram.
D. Block Diagram for RPM Measurement and Control
of PMDC Motor
In this experiment investigator has designed the LabVIEW software to control and measure the RPM of the dc motor.
The block diagram of the RPM Measurement of dc Motor is shown in Fig. 13.
Figure 13. Block diagram of RPM measurement of dc motor
The program consists of the four steps:
Acquire data: The block diagram consists of the VISA functions for reading and writing the data through USB port. When the program is executed the program sends the channel number for the experiment to the microcontroller.
Data manipulations: The address and the data sent by the microcontroller are separated using index array functions. The signal is then manipulated as per the requirement of the application variable to be displayed.
Data representation: The acquired data is checked for the address of the application using formula node. If address matches then the manipulated signal is send to the front panel to be displayed.
Termination of loop: The loop is terminated using stop button or if the while loop count is completed as specified in the block diagram.
V. EXPERIMENTAL RESULTS
A. Real Time Remote Plotting of LM35 Characteristic
First open the HTML page as shown in Fig. 14 opens. When the HTML page opens right click on the window the window ask for the Request control of vi and select it. The control is now transferred to the remote HTML page. The response of the output voltage of LM35 and the temperature is shown in Fig. 14. This graph is obtained after the online experiment is completed and the student can save the X-Y graph into the bitmap image and later
on paste it on the practical file for later use. The readings of the sensor are shown in Table I. This table can be saved into the working computer for future reference.
Figure 14. Response of the output voltage and temperature of LM35
TABLEI. VOLTAGE VERSUS TEMPERATURE READINGS OF LM35
S. NO Voltage (volts) Temperature (0C)
1 0.156 16
2 1.11 114
3 1.12 115
4 1.14 117
5 1.20 123
B. Real Time Remote Plotting of LDR Characteristic
First open the HTML page as shown in Fig. 15 opens. When the HTML page opens right click on the window the window ask for the Request control of vi and select it. The control is now transferred to the remote HTML page. Now the student can run the vi program and LDR resistance change to Illumination is shown in Fig. 15 is plotted. This graph is obtained after the online experiment is completed and the student can save the X-Y graph into the bitmap image and later on paste it on the practical file for later use.
The readings of the sensor are shown in Table II. This table can be saved into the working computer for future reference.
TABLEII. RESISTANCE VERSES ILLUMINATION READINGS OF LDR
S. NO Resistance (ohms) Illumination (Lux)
1 4000 1.581
2 2300 2.085
3 1700 2.425
4 1400 2.672
5 1200 2.886
C. Real Time Remote Plotting of Photo Doide
Characteristic
First open the HTML page as shown in Fig. 16 opens. When the HTML page opens right click on the window the window ask for the Request control of vi and select it. The control is now transferred to the remote HTML page. Now the student can run the vi program and Photo Diode reverse current change to Irradiance graph is shown in Fig. 16 is plotted. This graph is obtained after the online experiment is completed and the student can save the X-Y graph into the bitmap image and later on paste it on the practical file for later use.
The readings of the sensor are shown in Table III. This table can be saved into the working computer for future reference.
Figure 16. Response of photo diode reverses current change to Irradiance
TABLEIII. REVERSE PHOTO DIODE CURRENT VERSES IRRADIANCE
READINGS OF PHOTO DIODE
S. NO Reverse Current (μA) Irradiance (mW/cm2)
1 77 0.76
2 74 0.73
3 66 0.65
4 41 0.40
5 40 0.39
D. Real Time Remote RPM Measurement and Control
of PMDC Motor
First open the HTML page as shown in Fig. 17. When the HTML page opens right click on the window the window ask for the Request control of vi and select it. The control is now transferred to the remote HTML page. Now the student can run the vi program and speed control of PMDC motor and RPM measurement is shown in Fig. 17.
Figure 17. Response of RPM measurement and control of dc motor
VI. CONCLUSIONS
In the present work, author has developed DAQ card, and three experimental setups and one application for Instrumentation and Control Engineering experiments. The experimental results have been compared with the datasheets of the sensors and the encouraging resuls have been found. This shows that LabVIEW is very good front end design tool. Futhermore this method of online experimentation can complement traditional laboratory experiments.
The features of the package developed by the investigator are mentioned below:
i. A user friendly web enabled virtual instrumentation laboratory package developed is proved very suitable tool in learning and experimental process.
ii. The package is developed using LabVIEW, Dreamweaver, Orcad and Mikro C compiler. iii. The characteristics of different sensors are being
plotted and stored on remote computers.
iv. The cost effective DAQ card is developed for performing the experiments online.
v. The cost of the system developed is very less as compared to ELVIS II, used by other authors as mentioned in the references [19].
REFERENCES
[1] M. T. Restivo, et al., “A remote laboratory in engineering
measurement,” IEEE Transactions on Industrial Electronics, vol.
56, no. 12, pp. 4836-4843, Dec. 2009.
[2] B. Kanmani, “An alternate approach to the laboratory
implementation of communication experiments,” in Proc. Digital
Signal Processing Workshop and IEEE Signal Processing Education Workshop (DSP/SPE), Sedona, Jan. 2011, pp. 517-522.
[3] Y. Bao and X. Jiang, “Application of virtual instrumentation
which based on labview in electronic measurement technology
course,” in Proc. International Conference on Electronics and
Optoelectronics, Dalian, Jul. 2011, pp. 215-218.
[4] C. K. Maiti, S. Mahata, and Ananda Maiti, “Design and
development of a cost effective online electronic circuits
laboratory,” in Proc. IEEE International Conference on
[5] H. Vargas, et al., “A network of automatic control web-based
laboratories,” IEEE Transactions on Learning Technologies, vol.
4, no. 3, pp. 197-208, 2011.
[6] A. Maiti and S. Mahata, “A study of switching mechanisms in
remote electronics laboratories for engineering education,” in Proc.
IEEE International Conference on Teaching, Assessment, and Learning for Engineering (TALE), Hong Kong, Aug. 2012, pp. W2B-4 - W2B-6.
[7] K. M. Moudgalya and I. Arora, “A virtual laboratory for distance
education,” in Proc. IEEE International Conference on
Technology for Education (T4E), Mumbai, Jul. 2010, pp. 190-193.
[8] N. Sousa, G. R. Alves, and M. G. Gericota, “An integrated
reusable remote laboratory to complement electronics teaching,”
IEEE Transactions on Learning Technologies, vol. 3, no. 3, pp. 265-271, 2010.
[9] C. Y. Nie, S. S. Xu and S. J. Ji, “Data acquisition and realization
of communication transmission based on LabVIEW,” in Proc.
International Conference on Computer Science and Electronics Engineering, Hangzhou, Mar. 2012, pp. 215-218.
[10] E. G. Guimaraes, E. Cardozo, D. H. Moraes, and P. R. Coelho,
“Design and implementation issues for modern remote
laboratories,” IEEE Transactions on Learning Technologies, vol.
4, no. 2, pp. 149-161, 2011.
[11] G. A. Meneses, “Design of an electronic instrumentation virtual
laboratory based on free-open resources,” in Proc. IEEE 6th
Colombian Conference on Computing Congress (CCC), Manizales, May 2011, pp. 1-6.
[12] A. V. Szarka, “Development of remote controlled virtual
laboratory,” in Proc. XIX IMEKO World Congress Fundamental
and Applied Metrology, Lisbon, Sep. 6-11, 2009, pp. 49-53.
[13] S. Sumathi and P. Surekha, LabVIEW Based Advanced
Instrumentation System, Springer Publication, 2007.
[14] R. Bitter, T. Mohuddin, and M. Nawrocki, LabVIEW Advanced
Programming Techniques, New York: CRC Press, 2001. [15] LabVIEW Tutorial Manual, National Instruments Corporation,
1996.
[17] I. Arora, K. M. Moudgalya, and S. Malewar, “A low cost open
source single board heater system,” in Proc. 4th IEEE
International Conference on E-Learning in Industrial Electronics (ICELIE), Glendale, Nov. 2010, pp. 7-12.
[18] A. P. J. Chandra and C. R. Venugopal, “Novel design solutions for
remote access, acquire and control of laboratory experiments on
dc machines,” IEEE Transactions on Instrumentation and
Measurement, vol. 61, no. 2, pp. 349-357, Feb. 2012.
[19] S. Mahata, A. Maiti, and C. K. Maiti, “Cost-Effective web-based
electronics laboratory using NI MultiSim, LabVIEW and ELVIS
II,” in Proc. IEEE International Conference on Technology for
Education (T4E), Mumbai, Jul. 2010, pp. 242-243.
Amit Kumar Singh was born in Meerut,
India in 1978. He received his B.Tech degree in Electronics and Instrumentation from the V.B.S. University, Jaunpur and M.E. degree in Instrumentation and control from Panjab University, Punjab. He is pursuing his Phd. from IIT, Delhi.
He has more 10 years of experience out of which 5 years are of teaching and 5 years are of Industrial. Since 2008 to August 2013 he had been an Assistant Professor with Radha Govind Engineering College, Meerut, India. He teaches subjects on Instrumentation for measurement and control systems. He has worked in different industries dealing with embedded, automation and instrumentation since 2003. He is a member of the ICEIT New Delhi.
Dr. S. Chatterji is presently working as a
Professor and Head, Electrical Engineering Department, NITTTR Chandigarh. Dr. S. Chatterji earned his Bachelor of Electrical Engineering from Bhopal University, Master of Electrical Engineering from Allahabad University and Ph.D from Panjab University, Chandigarh.
He has 37½ years of experience out of which 35½ years are of teaching and 2 years are of Industrial. He has more than 150 Research Articles to his credit. He has also authored 3 books in the field of Electronics, 4 Lab Manuals in Electrical and has produced a series of 21 Video films in Power Electronics. His areas of specialization are Power Electronics, Digital Electronics, Electrical Power, ANN, Fuzzy logic applications, Soft Computing Techniques etc.
Mrs Shimi S. L. is presently working as
Assistant Professor, Electrical Engineering Department, NITTTR Chandigarh. Mrs. Shimi S.L earned her Bachelor of Electrical and Electronics Engineering from J.J College of Engineering and Technology, Trichy, Tamil Nadu and Master of Power Electronics and Drives from Saranathan College of Engineering, Trichy, Tamil Nadu and pursing her Ph.D from PEC University of Technology, Chandigarh.
She has 10 years of experience out of which 9 years are of teaching and 1 year is of Industrial. She has more than 25 Research Articles to her credit. Her areas of specialization are Power Electronics, Digital Electronics, ANN, Fuzzy etc. She is a Member of IEEE (USA).
Mr. Anshul Gaur is presently working as an
Assistant Professor in Electronics and Instrumentation Engineering Department, RGGI Meerut. Mr. Anshul Gaur has earned his Bachelor of Technology degree in Instrumentation and Electronics from M.I.E.T. Meerut and Master of Technology degree from N.I.T. Kurukshetra in Instrumentation. He has 7 years of teaching experience. His areas of specialization are Embedded Systems and Control Systems. He is a life time member of ISTE. He is the Coordinator of Electronics and Instrumentation Engineering Department for more than 5 years.
[16] J. Jing, L. Nie, B. Wang, and J. Li, “Remote laboratory data
management system based on LabVIEW,” in Proc. International