VOLUME 40, ARTICLE 4, PAGES 61
,
94
PUBLISHED 17 JANUARY 2019
https://www.demographic-research.org/Volumes/Vol40/4/ DOI: 10.4054/DemRes.2019.40.4
Research Article
The Healthy Immigrant Effect:
The role of educational selectivity in the good
health of migrants
Mathieu Ichou
Matthew Wallace
© 2019 Mathieu Ichou & Matthew Wallace.
This open-access work is published under the terms of the Creative Commons Attribution 3.0 Germany (CC BY 3.0 DE), which permits use, reproduction, and distribution in any medium, provided the original author(s) and source are given credit.
1 Introduction 62
2 Background 63
2.1 The Healthy Immigrant Effect (HIE) 63
2.2 Migrant socioeconomic mortality paradox 64
2.3 Selection in migration 64
2.4 A lack of studies on the health effect of migrant selection 65
2.5 Contribution and hypotheses 66
3 Data and variables 67
3.1 TeO and Barro‒Lee 67
3.2 Variables used 69
3.2.1 Migrant generation 69
3.2.2 Region of origin 69
3.2.3 Duration of stay 70
3.2.4 Relative education level 70
3.2.5 Absolute education level 71
3.2.6 Health outcomes 73
4 Methods 74
5 Results 75
6 Discussion 81
References 83
The Healthy Immigrant Effect:
The role of educational selectivity in the good health of migrants
Mathieu Ichou1
Matthew Wallace2
Abstract
BACKGROUND
The Healthy Immigrant Effect (HIE) refers to the fact that recent migrants are in better health than the nonmigrant population in the host country. Central to explaining the HIE is the idea that migrants are positively selected in terms of their socioeconomic and health characteristics when compared to nonmigrants in their country of origin. However, due to a lack of reliable and comparable data, most existing studies rely on socioeconomic and health measures as collected in the host country after migration and do not actually measure selection.
OBJECTIVE
We directly test selection as an explanation of the HIE among migrants living in France.
METHODS
Using the French Trajectories and Origins (TeO) survey and Barro‒Lee dataset, we construct a direct measure of migrants’ educational selectivity. We then test its effect on health differences between migrants and nonmigrants using measures self-rated health, health limitations, and chronic illnesses, by fitting logistic regression and Karlson‒ Holm‒Breen (KHB) decompositions.
RESULTS
After demonstrating that migrants in France experience an HIE, especially males, we also show that educational level as measured in the host country cannot account for the HIE. By contrast, we provide important evidence that educational selectivity constitutes a significant factor in explaining health disparities between migrant and nonmigrant populations.
1 Institut National d’Études Démographiques, Paris, France. Email:[email protected].
2 Stockholm University Demography Unit, Stockholm, Sweden. Work completed at Institut National d’Études
CONTRIBUTION
Capitalizing on a novel measure of migrants’ educational selectivity, we give credit to the oft-cited but rarely tested theory that the HIE is a consequence of migrants’ positive selection.
1. Introduction
The Healthy Immigrant Effect (HIE) posits that recent migrants are in better health than the host population and other migrants who have lived in the host country for a long time (Domnich et al. 2012). One of the most intriguing features of this phenomenon is the socioeconomic paradox by which migrants have a lower socioeconomic status (SES) than nonmigrants in the host country, but nonetheless experience a health advantage (Palloni and Arias 2004). Researchers theorize that the HIE and SES paradox could be explained by selection; that is, the idea that migrants are not simply a random sample of their origin population but rather a select group who are healthier, wealthier, and more highly educated than the population they leave behind (Feliciano 2005).
Ideally, to capture this selection, one would compare migrants’ characteristics to those of nonmigrants in the origin country just before migration. However, this would require two harmonized national data sources that can follow migrants between countries. Due to these stringent demands, many studies instead compare migrants to nonmigrants in the host country. Such a comparison tells us little about the level and effects of selection into migration. On the contrary, SES as measured in the host country likely underestimates migrants’ previous social standing in the origin country (Ichou 2014). Thus, when such characteristics are used to try to explain migrant versus nonmigrant health differentials in the host country, they may actually be exacerbating them.
often cited but rarely tested expectation according to which the HIE is partly a product of migrants’ positive selection.
2. Background
2.1 The Healthy Immigrant Effect (HIE)
The HIE is a widely accepted phenomenon in the social science literature, which has been investigated in (typically) high-income host countries using a diverse range of different health outcomes including – but not limited to – self-rated health (Akresh and Frank 2008; Bostean 2013; De Grande et al. 2014; Dinesen et al. 2011; Newbold 2005; Riosmena, Wong, and Palloni 2013; Vaillant and Wolff 2010), chronic illnesses (Kotwal 2010; McDonald and Kennedy 2004; Newbold 2006), health limitations (Bostean 2013; Hofmann 2012; Thomson et al. 2013; Wallace and Kulu 2014), smoking patterns (Blue and Fenelon 2011; Fenelon 2013; Hosper et al. 2007; Reiss et al. 2014), and all-cause/cause-specific mortality (Abraido-Lanza et al. 1999; Anikeeva et al. 2015; Anson 2004; Boulogne et al. 2012; Deboosere and Gadeyne 2005; Hajat et al. 2010; Palloni and Arias 2004; Razum et al. 1998; Vandenheede et al. 2015; Wallace and Kulu 2015).
A recent review of the migrant health and mortality literature in France (Khlat and Guillot 2017) finds that the HIE is largely limited to studies of mortality. Most of the studies of health are in line with the representation of migrants as vulnerable populations, though there is more evidence of a disadvantage in self-rated health than in chronic diseases or health limitations (Khlat and Guillot 2017). Additionally, an important attenuating effect of duration of stay is often found (Attias-Donfut and Tessier 2005; Hamel and Moisy 2012; Jusot et al. 2009). These patterns are consistent with a systematic review of the Canadian literature (Vang et al. 2017). This convergence is generally interpreted as the “wearing off” of initial positive selection effects, combined with the acculturation to the beliefs, attitudes, and behaviors of the host society with time spent in the host country (Razum 2008).
(gender norms) and year of arrival (given growing female empowerment over time and increasing access to education and the labor market in the origin country).
2.2 Migrant socioeconomic mortality paradox
A closely related phenomenon to the HIE is the so-called socioeconomic paradox in migrant health. It is often referred to as the ‘Hispanic paradox’ as the paradox was first documented among Hispanics in the United States by Markides and Coreil (1986), and nearly all of the research since has focused on the same origin group (Bostean 2013; Goldman et al. 2006; Kimbro et al. 2008; Markides and Eschbach 2011; Medina-Inojosa et al. 2014; Palloni and Arias 2004; Ro et al. 2016; Ruiz, Steffen, and Smith 2013; Teruya and Bazargan-Hejazi 2013; Turra and Goldman 2007). It describes the seemingly paradoxical situation in which some migrant groups are in similar or better health than nonmigrants even though their socioeconomic status is significantly lower. In one of the few articles not focusing on Hispanic migration to the United States, Zufferey (2016) investigates the SES gradient among migrants aged 25–64 living in Switzerland. Consistent with US research, this study shows that the HIE is strongest in the lowest socioeconomic groups.
One of the most popular explanations of the paradox is that it may arise because migrants are positively selected, but this is not reflected in their comparatively lower SES profiles in the host country (Ichou 2014). Truly understanding health inequalities between population subgroups requires an approach that considers SES throughout the life course (Lynch et al. 1994). This is particularly pertinent for migrants, whose current health is a combination of their previous life experiences in the country of origin and current life situation in the host country (Anson 2004). If we only consider the latter we are ignoring a crucial formative part of the life course in which migrants could have accumulated such high levels of health, generating the paradox in the host country.
2.3 Selection in migration
host countries, and the historical relationship between the two countries (Feliciano 2005).
Migrant selection may occur on many observable and unobservable traits, including – but not limited to – SES characteristics (such as their education level and income) and health. These characteristics are positively associated with one another. People in ill health are less likely to be able to attain a given level of education or skill set, while people who attain higher levels of education or skills are more likely to be efficient health producers (Grossman 1972; Palloni and Ewbank 2004). Expectedly, unobserved characteristics (like being ambitious and forward-looking) are also linked with positive selection on SES and health (Chiswick, Lee, and Miller 2008).
Specifically, the positive association between education and health is well established, if not completely understood. Higher educational attainment improves health directly and indirectly through work and economic conditions (highly educated people have lower unemployment and tend to be wealthier), psychosocial resources (they have greater perceived control), and health lifestyle (they will make better-informed health-related decisions) (Ross and Wu 1995). Education level is strongly related to health behaviors such as smoking practices, physical activity, and diet (Lynch, Kaplan, and Salonen 1997). It has been posited that migrants who have received a higher level of education in the origin country are able to generate a higher level of health before migration and better maintain their health after moving (Chiswick, Lee, and Miller 2008; Grossman 1972; Pol and Thomas 1992).
2.4 A lack of studies on the health effect of migrant selection
Some studies take the United States as the host country but investigate different migrant groups. Mehta and Elo (2012) focus on the health selection of migrants from the former Soviet Union and find that Russian migrants report lower levels of disability compared with Russians living in Russia, which suggests that they are positively selected. In one of the most recent studies, Ro, Fleischer, and Blebu (2016) include a wider range of migrant streams by combining health information from the origin countries with comparable data from the United States. The authors find that migrants from South American countries display the largest degrees of positive health selection, while the two largest sending countries, Mexico and China, display the lowest levels.
Finally, one study pools national cross-sectional datasets from the United States, Canada, Australia, and the United Kingdom and compares the health of migrants moving between these four countries to both their host and origin populations (Kennedy et al. 2014). The authors observe a health advantage of migrants relative to the origin populations in all four destination countries (Kennedy et al. 2014).
The above studies share three limitations. First, their focus is largely restricted to the United States and Hispanics. Second, they use varying definitions of ‘recent’ migrants (10 years or less since arrival in Kennedy et al. (2014), 15 years or less in Riosmena et al. (2013), with no distinction between recent and established migrants in Mehta and Elo (2012)). These cut-offs make it difficult to discount the possibility that some of the current health status of migrants is a result of their current life conditions in the host country rather than their selection into migration. Finally, these studies focus on direct selection on health (i.e., difference in health status between those who migrate and those who stay in the origin country) and tend to leave in the background the effect of SES characteristics upon migrants’ health. Indeed, in a relatively young population, even if the health of migrants might not differ much from that of nonmigrants, they could still be selected on educational attainment, which could later have consequences for their health after migration.
2.5 Contribution and hypotheses
The main contribution of our study is to capture selection by considering the role of relative educational attainment (i.e., an individual’s relative position in the distribution of educational attainment in their country of birth) on health differences between migrants and nonmigrants in France.
We frame our analysis around three hypotheses:
French literature, we believe that an HIE is more likely to be observed in chronic illnesses and health limitations than self-rated health.
Hypothesis 2: We then expect the size of the HIE to increase when adjusting for the absolute level of educational attainment. This is because migrant populations in France, on average, are likely to have lower absolute levels of education than nonmigrants and because absolute educational attainment is likely to be strongly positively correlated with the three health outcomes under investigation.
Hypothesis 3: Once we adjust for migrants’ relative education level compared to the origin population (to better capture their selectivity) and provide a truer image of migrants’ socioeconomic status over the life course, we expect that observed health differences between migrants and the nonmigrant French population will vastly reduce, and may in some cases disappear.
3. Data and variables
3.1 TeO and Barro‒Lee
This paper uses the Barro–Lee Educational Attainment dataset (2013) and the Trajectoires et Origines (Trajectories and Origins, or TeO) survey from France (INED-INSEE 2008–2009). The Barro–Lee dataset (2013) compiles international data assembled by UNESCO, Eurostat, and several other data sources. It contains harmonized distributions of educational attainment in the adult population (aged 15+) by gender and 5-year age groups in seven categories (no formal education, incomplete and complete primary, incomplete and complete secondary, and incomplete and complete tertiary) in almost 150 countries between 1950 and 2010 in 5-year periods.
The TeO survey, conducted by the French Institute for Demographic Studies (INED) and the National Institute for Statistics and Economic Studies (INSEE) in 2008–2009, focuses on migrants and children of migrants in France. With respect to its representativeness and sample size, TeO constitutes the best available survey data on migrants and their children carried out in France (Beauchemin, Hamel, and Simon 2015). The sample of 21,761 respondents includes representative over-samples of more than 8,000 migrants and 8,000 children of one or two migrants.
(3,025; weighted: 3.7%), those with missing education attainment data in the TeO survey (2,930; weighted: 8.5%), and those whose country of birth could not be matched to the Barro‒Lee data (1,053; weighted: 2.0%). This results in an analytical sample of 12,938 individuals, with a gender ratio very similar to that in the original sample. Table 1 provides basic sample descriptive statistics; the variables are discussed below.
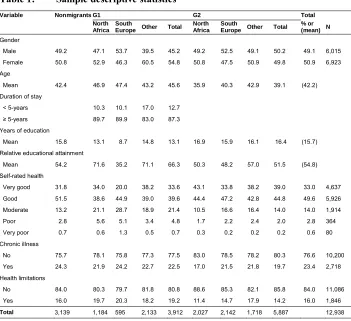
Table 1: Sample descriptive statistics
Variable Nonmigrants G1 G2 Total
North Africa
South
Europe Other Total North Africa
South
Europe Other Total % or (mean) N Gender
Male 49.2 47.1 53.7 39.5 45.2 49.2 52.5 49.1 50.2 49.1 6,015 Female 50.8 52.9 46.3 60.5 54.8 50.8 47.5 50.9 49.8 50.9 6,923 Age
Mean 42.4 46.9 47.4 43.2 45.6 35.9 40.3 42.9 39.1 (42.2) Duration of stay
< 5-years 10.3 10.1 17.0 12.7 ≥ 5-years 89.7 89.9 83.0 87.3 Years of education
Mean 15.8 13.1 8.7 14.8 13.1 16.9 15.9 16.1 16.4 (15.7) Relative educational attainment
Mean 54.2 71.6 35.2 71.1 66.3 50.3 48.2 57.0 51.5 (54.8) Self-rated health
Very good 31.8 34.0 20.0 38.2 33.6 43.1 33.8 38.2 39.0 33.0 4,637 Good 51.5 38.6 44.9 39.0 39.6 44.4 47.2 42.8 44.8 49.6 5,926 Moderate 13.2 21.1 28.7 18.9 21.4 10.5 16.6 16.4 14.0 14.0 1,914
Poor 2.8 5.6 5.1 3.4 4.8 1.7 2.2 2.4 2.0 2.8 364
Very poor 0.7 0.6 1.3 0.5 0.7 0.3 0.2 0.2 0.2 0.6 80 Chronic illness
No 75.7 78.1 75.8 77.3 77.5 83.0 78.5 78.2 80.3 76.6 10,200 Yes 24.3 21.9 24.2 22.7 22.5 17.0 21.5 21.8 19.7 23.4 2,718 Health limitations
No 84.0 80.3 79.7 81.8 80.8 88.6 85.3 82.1 85.8 84.0 11,086 Yes 16.0 19.7 20.3 18.2 19.2 11.4 14.7 17.9 14.2 16.0 1,846
Total 3,139 1,184 595 2,133 3,912 2,027 2,142 1,718 5,887 12,938
3.2 Variables used
We define migration status by combining three types of information: migrant generation (nonmigrant, G1, G2), region of origin (Southern Europe, North Africa, other regions), and duration of stay.
3.2.1 Migrant generation
To define our groups of interest we use two variables from the TeO survey: the respondent’s country of birth and their parents’ country of birth. The reference group, French nonmigrants, is defined as individuals who are born in France to two parents born in France (including overseas territories). First-generation migrants (G1) are defined as being born abroad (i.e., outside of France). The second generation (G2) is defined as those born in France to at least one parent born abroad (approximately 60% of G2 have two parents born abroad).
3.2.2 Region of origin
Our two main regions of interest, Southern Europe (Italy, Spain, and Portugal) and North Africa (Algeria, Morocco, and Tunisia), represent the two largest regions of origin for migrants in France. We also include the group ‘other’ (which is a diverse group of migrants originating from sub-Saharan Africa, European countries, Turkey, and Southeast Asia). The older age structure of the South European G1 and G2, and comparatively younger age structure of the North African and other G1 and G2, reflects the earlier arrival in France of Southern Europeans compared to North Africans and other regions (see Table 1 for some descriptive information).
3.2.3 Duration of stay
We construct the migration status variables used in the analyses by combining duration of stay with the migrant groups. We use two migration status variables: one that does not make any distinction between regions of origin and one that does. In models that do not distinguish the region of origin of migrants we use a three-category indicator of duration of stay (less than or equal to 5 years, 6 to 10 years, and more than 10 years). In models with more detailed migration status that identifies regions of origin we use a binary duration indicator identifying migrants who have lived in France for more than or less than 5 years. We include duration of stay because it has been proposed that the healthy immigrant effect and the positive effect of migrant selection on their health are most pronounced just after they arrive in the host country.
3.2.4 Relative education level
Respondents’ relative level of education (similar to what Feliciano and Lanuza (2017) named “contextual attainment”) constitutes the key variable in the analysis. Using a methodology developed for migrants by Ichou (2014) and extended to nonmigrants by Feliciano and Lanuza (2017), the Barro‒Lee and TeO datasets are combined to construct this measure. Initially, each respondent from TeO is matched with the distribution of educational attainment (measured in six categories in both data sources using the International Standard Classification of Education, ISCED) of individuals of the same gender and year of birth. The educational attainment of each respondent from the TeO survey is then positioned within this distribution. The resulting variable, measured as a percentile, shows the percentage of individuals from the same country of birth and of the same gender and age who have a lower level of educational attainment, plus half the percentage of individuals with the same level of education3 (see Appendix
for a fictional example).
Essential to the contribution of this paper is the fact that, for migrants, relative educational attainment functions as a direct indicator of migrants’ educational selectivity (i.e., how each migrant in a given host country compares in terms of educational attainment to nonmigrants in the origin country). This measure places migrants’ education in the context in which it was attained, which helps capture broader dimensions of education and SES including cultural dimensions (Feliciano and Lanuza 2017) that are crucial in determining the health status of migrants before arrival.
3 This calculation is closely aligned with the definition of ridits (Bross 1958), a standard way of transforming
Henceforth, we refer to relative educational attainment as educational selectivity when it is measured only among migrants, as in Figures 1 and 2. However, in the regression models, when the variable is also measured for nonmigrants, we refer to it as “relative educational attainment,” as nonmigrants do not experience this migration selection (Feliciano and Lanuza 2017).
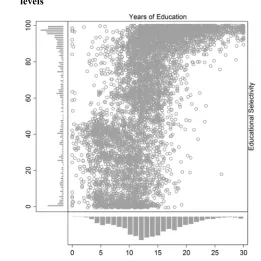
3.2.5 Absolute education level
Respondents’ absolute level of education is measured using number of years of education. This variable is derived from existing information in the French TeO survey. Figure 1 shows absolute education level on the x-axis (the number of years of education) plotted against educational selectivity on the y-axis for G1 only. The frequency distributions of the two variables are displayed on corresponding axes. There is a moderate positive correlation between these two measures. However, absolute number of years of education does not always translate to the same position in the educational distribution of the origin country. We show this with two examples.
Males A and B both completed 10 years of education in Algeria; A is 58 years old while B is only 31. A is positively selected (77th percentile), while B is negatively
selected (9th percentile). This is because A received 10 years of education at a time
when the education system in Algeria was less developed. Now consider females C and D, who are the same age (48 years old) but from different countries: Morocco (C) and Spain (D). Both complete 10 years of education. C is positively selected (83rd
percentile), but D is neither positively nor negatively selected (49th percentile). This is
Figure 1: Bivariate and univariate distributions of migrants’ absolute (number of years of education) and relative (educational selectivity) education levels
We can also observe from the univariate distribution of the educational selectivity variable in Figure 1 that, while migrants tend to be positively selected (i.e., above the 50th percentile in the educational distribution of the origin country), some originate
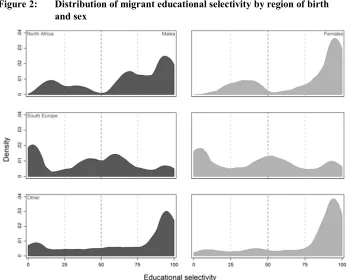
from the lower-middle region of the distribution (slightly negative selection). We provide a more nuanced look at this by presenting the smoothed distributions of educational selectivity by region of birth and by sex in Figure 2.
between North Africans and Southern Europeans manifests itself in the three health outcomes.4
Figure 2: Distribution of migrant educational selectivity by region of birth and sex
3.2.6 Health outcomes
We analyze three standard health outcomes: self-rated health, limiting health problems, and chronic illness. For self-rated health, respondents were asked, “What is your overall state of health?” on a 5-point scale from “very good” to “very poor.” For health limitations, respondents were asked, “Have you been limited in your normal activities for at least six months because of a health problem?” Respondents could answer “yes, very limited,” “yes, limited but not severely,” and “no.” For chronic illnesses
4 Further descriptive analyses reveal that educational selectivity distributions vary very little by duration of
respondents were asked, “Do you currently have one or more chronic illnesses? A chronic illness is one that lasts (or will last) a long time or regularly reappears (or will reappear).” Respondents could answer “yes” or “no.”
We study these outcomes because we believe that they capture different health problems. The chronic illness and health limitations questions should capture longer-term, permanent, or reoccurring issues, while the question on self-rated health should additionally capture shorter-term, temporary illnesses, alongside general perceptions of one’s own health. Moreover, the chronic illness outcome is arguably the most objective (in that to report one requires a prior diagnosis or specific knowledge of illnesses). Yet if migrants are not well integrated into the health care system, they are less likely to be able to report a chronic illness. However, such illnesses should be captured through the health limitations or self-rated health questions. Our three outcomes have pairwise linear correlations ranging from .48 to .50 and Cramer’s V ranging from .49 to .56. These moderately strong positive relationships suggest that all three indicators tap into respondents’ health but that it is still relevant to analyze them as separate indicators.
4. Methods
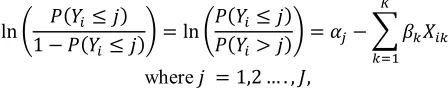
We use logistic regression to examine health differences between migrants and nonmigrants. For limiting health problems and chronic illnesses we fit binary logistic regression models (we combine answers “yes, very limited” and “yes, limited but not severely” for limiting health problems). The model is below, where P(Yi=1) is the estimated probability of having, e.g., a chronic illness for personi, α is a constant,Xik is the value of variable Xk for individual i, with K explanatory variables, and βkis the logistic regression coefficient associated with the variableXk.
ln ( = 1)
1 − ( = 1) = +
For the self-rated health outcome we fit ordinal logistic regression models (proportional odds models) where Y is now a response variable with J ordered categories; in this case the five categories are “very good,” “good,” “average,” “poor,” and “very poor”; αj are category-specific constants, while the βk coefficients are the same across values of Y; Xik is the value of variable Xk for individual i, with K
variable will be estimated to change by the value ofXik in the ordered log-odds scale, the other variables in the model being held constant. Consistent with the other outcomes, lower values of this variable indicate better health.
ln 1 − ( ≤ ) = ln( ≤ ) ( ≤ )( > ) = −
where = 1,2 … . , ,
Our analytical strategy consists in comparing the coefficients assessing migrants’ health advantages across nested models, successively adding our independent variables of interest. A series of methodological papers warn researchers against comparing coefficients from nested non-linear probability models (Allison 1999; Karlson, Holm, and Breen 2012; Mood 2010), such as the logit models we use. Consequently, we use a recent method to avoid this problem and achieve a more rigorous comparison of the same coefficient across logit models (Karlson, Holm, and Breen 2012). This is implemented in Stata through the KHB program (for Karlson‒Holm‒Breen decomposition) (Kohler, Karlson, and Holm 2011). We present the results of the decomposition of the regression coefficients associated with migrant status for our health outcomes. Importantly, the Karlson‒Holm‒Breen method lets us test the statistical significance of the difference in the values of coefficients across models. It will therefore allow us to test whether relative educational attainment plays a significant role in explaining migrants’ health advantages (Hypothesis 3).5
5. Results
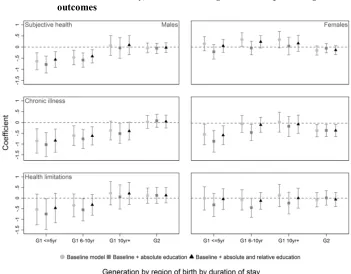
Figure 3 shows the results from three sex-specific nested logistic models (with the Karlson–Holm–Breen correction) for the G1 by duration of stay and G2 (full results shown in numerical form in Tables A-1 to A-3 of the Appendix). Model 1 (M1) is our baseline model, adjusting for age, age2, and migration status. Model 2 (M2) adds
respondents’ absolute education level to the baseline model. Model 3 (M3) includes our main independent variable of interest: relative educational attainment.6 In all models the
nonmigrant French population acts as the reference category.
5 We note from additional analyses that we would have reached similar conclusions without the KHB
corrections, but would not have been able to test the differences in the values of coefficients across models as rigorously without using the KHB method.
6 An alternative specification of Models 2 and 3 was also fitted including additional measures of
Figure 3: KHB logistic regression coefficients for migration status (generation and duration of stay) across nested logistic models predicting three outcomes
Note: The reference group is always the nonmigrant French population. On all three outcomes, lower values indicate better health.
From males in M1 we observe clear evidence of an HIE among the G1 in self-rated health and chronic illnesses. Consistent with Hypothesis 1, the HIE is strongest among recent arrivals and weaker among males who have lived in France for longer.7
The self-rated health of males who have lived in France for at least 10 years is no different from that of nonmigrants and their HIE in chronic diseases is only marginally
status, and income, this alternative specification lacked statistical power. Thus, the more parsimonious specification described in the text was favored. These supplementary results are available upon request.
7 We fitted models stratified into 15-year age intervals to ensure that convergence in duration of stay
significant. We observe the same gradient for duration of stay across health limitations among males, but these differences are not statistically significant in M1.
Evidence for an HIE among females is substantially weaker, consistent with the French literature. The only evidence of an HIE is in the lower prevalence of chronic illnesses for the most recent arrival cohorts (≤5 years). For the remaining two health outcomes, female migrants do not differ from nonmigrants and there is even marginal evidence of a slight disadvantage in self-rated health.
We will not consider the G2 results in detail, since, except for a slightly lower incidence of chronic illnesses among females, the G2’s health never differs from the reference population in any of the models. The inclusion of the education variables in Models 2 and 3 do not affect this finding.
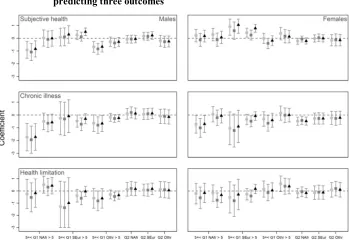
Figure 4 shows results from the same models using a different migration status variable which distinguishes between G1 groups of different regions of birth and duration of stay (full results shown in numerical form in Tables A-4 to A-6 of the Appendix). The HIE in self-rated health and chronic illnesses is found for G1 North African males only. Interestingly, G1 from Southern Europe never exhibit a statistically significant HIE in any of the three health outcomes. G1 Southern European females even report worse self-rated health than the reference group. The absence of an HIE among Southern European migrants, contrary to North Africans, could be linked to the fact that they are a more negatively selected migrant group in terms of education (see Figure 2).
Importantly, an expectation stated in Hypothesis 2 is verified in Figures 3 and 4, where adjusting for absolute educational attainment (M2) increases the magnitude of the existing migrant health advantages or generates statistically significant ones when they did not initially exist in the baseline model (M1). This pattern stems from a combination of two bivariate relationships: migrants, on average, tend to have lower absolute levels of education than nonmigrants; and absolute educational attainment is positively correlated with the three health outcomes.
Figure 4: KHB logistic regression coefficients for migration status (generation, region of birth, and duration of stay) across nested logistic models predicting three outcomes
Note: The reference group is always the nonmigrant French population. On all three outcomes, lower values indicate better health.
differences could be detected among Southern European migrants, males or females, at the p<0.05 level.
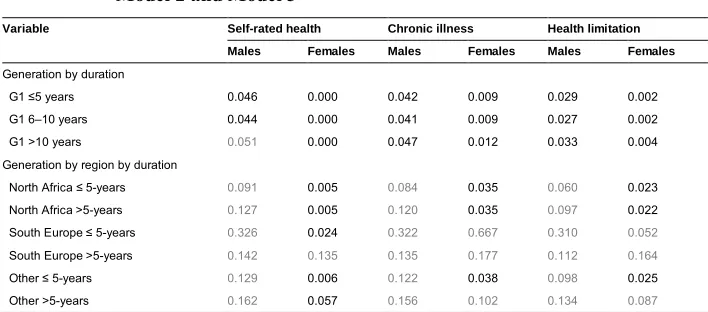
Table 2: KHB tests of difference in migration status coefficients between Model 2 and Model 3
Variable Self-rated health Chronic illness Health limitation
Males Females Males Females Males Females Generation by duration
G1 ≤5 years 0.046 0.000 0.042 0.009 0.029 0.002
G1 6–10 years 0.044 0.000 0.041 0.009 0.027 0.002 G1 >10 years 0.051 0.000 0.047 0.012 0.033 0.004 Generation by region by duration
North Africa ≤ 5-years 0.091 0.005 0.084 0.035 0.060 0.023 North Africa >5-years 0.127 0.005 0.120 0.035 0.097 0.022 South Europe ≤ 5-years 0.326 0.024 0.322 0.667 0.310 0.052
South Europe >5-years 0.142 0.135 0.135 0.177 0.112 0.164
Other ≤ 5-years 0.129 0.006 0.122 0.038 0.098 0.025 Other >5-years 0.162 0.057 0.156 0.102 0.134 0.087
Note: p≤0.05 is black p>0.05 is grey.
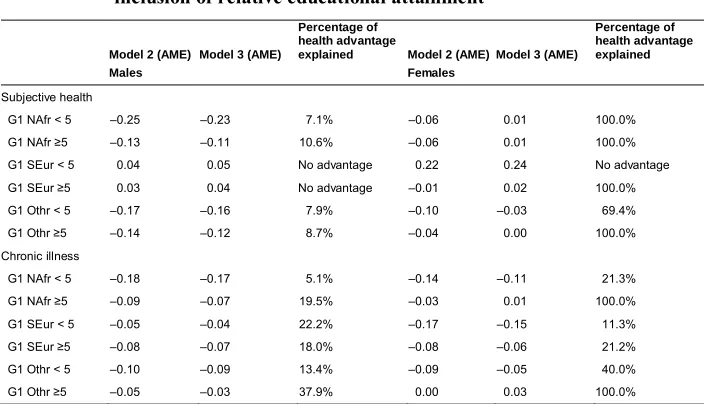
Table 3: Average marginal effects of migration status (duration of stay) in Models 2 and 3, and percentage explained by the inclusion of relative educational attainment
Model 2 (AME) Model 3 (AME)
Percentage of health advantage
explained Model 2 (AME) Model 3 (AME)
Percentage of health advantage explained
Males Females
Subjective health
G1 ≤5yr –0.17 –0.15 8.9% –0.06 0.00 100.0%
G1 6-10yr –0.16 –0.14 10.2% –0.03 0.03 100.0%
G1 10yr+ –0.10 –0.08 13.0% –0.05 0.00 100.0%
Chronic illness
G1 ≤5yr –0.12 –0.11 11.1% –0.12 –0.08 28.0%
G1 6–10yr –0.10 –0.08 17.8% –0.05 –0.01 87.0%
G1 10yr+ –0.07 –0.05 23.9% –0.03 0.01 100.0%
Health limit
G1 ≤5yr –0.07 –0.05 22.6% –0.04 0.00 96.6%
G1 6–10yr –0.06 –0.04 35.9% –0.05 –0.01 80.4%
G1 10yr+ 0.01 0.03 No advantage –0.02 0.02 100.0%
Note: Nonmigrants are always the reference group. Contrasts between nonmigrants and second generations are not presented for sake of brevity.
Table 4: Average marginal effects of migration status (duration of stay by region of origin) in Models 2 and 3, and percentage explained by the inclusion of relative educational attainment
Model 2 (AME) Model 3 (AME)
Percentage of health advantage
explained Model 2 (AME) Model 3 (AME)
Percentage of health advantage explained
Males Females
Subjective health
G1 NAfr < 5 –0.25 –0.23 7.1% –0.06 0.01 100.0%
G1 NAfr ≥5 –0.13 –0.11 10.6% –0.06 0.01 100.0%
G1 SEur < 5 0.04 0.05 No advantage 0.22 0.24 No advantage G1 SEur ≥5 0.03 0.04 No advantage –0.01 0.02 100.0% G1 Othr < 5 –0.17 –0.16 7.9% –0.10 –0.03 69.4%
G1 Othr ≥5 –0.14 –0.12 8.7% –0.04 0.00 100.0%
Chronic illness
G1 NAfr < 5 –0.18 –0.17 5.1% –0.14 –0.11 21.3%
G1 NAfr ≥5 –0.09 –0.07 19.5% –0.03 0.01 100.0%
G1 SEur < 5 –0.05 –0.04 22.2% –0.17 –0.15 11.3%
G1 SEur ≥5 –0.08 –0.07 18.0% –0.08 –0.06 21.2%
G1 Othr < 5 –0.10 –0.09 13.4% –0.09 –0.05 40.0%
Table 4: (Continued)
Model 2 (AME) Model 3 (AME)
Percentage of health advantage
explained Model 2 (AME) Model 3 (AME)
Percentage of health advantage explained
Males Females
Health limitation
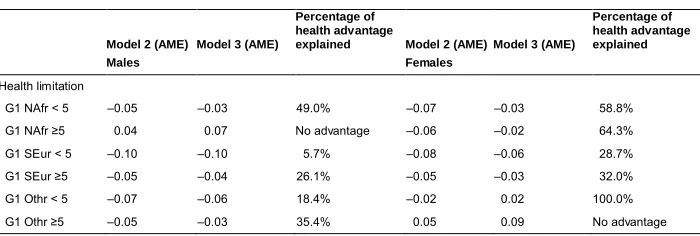
G1 NAfr < 5 –0.05 –0.03 49.0% –0.07 –0.03 58.8% G1 NAfr ≥5 0.04 0.07 No advantage –0.06 –0.02 64.3% G1 SEur < 5 –0.10 –0.10 5.7% –0.08 –0.06 28.7%
G1 SEur ≥5 –0.05 –0.04 26.1% –0.05 –0.03 32.0%
G1 Othr < 5 –0.07 –0.06 18.4% –0.02 0.02 100.0% G1 Othr ≥5 –0.05 –0.03 35.4% 0.05 0.09 No advantage
Note: Nonmigrants are always the reference group. Contrasts between nonmigrants and second generations are not presented for sake of brevity.
6. Discussion
In this study we have investigated the role of migrants’ relative educational attainment in explaining their health advantages over nonmigrants using three health outcomes: self-rated health, chronic illness, and health limitations. We set out to test three hypotheses. In the first hypothesis, we expected to observe a large HIE for migrants in France, which decreased with length of stay. This expectation was met among males, but less so among females. Such findings are in line with a recent systematic review of the HIE literature in France (Khlat and Guillot 2017). By region of origin, at least among males, the existence of an HIE was consistent with the direction of their educational selectivity. G1 North Africans and G1 from other regions were positively selected and experienced an HIE. G1 South Europeans, on the other hand, were negatively selected and did not experience an HIE. Despite similar educational selectivity, an HIE was not found among females. Khlat and Guillot (2017) ascribe this difference to men arriving primarily as workers and women arriving as “dependents” to reunify with their family. This assertion probably applies more to older migrant cohorts, which arrived at a time when gender norms and the position of women in the labor market in the origin and host countries were less egalitarian than they are now. For more recent arrival cohorts, this balance should be shifting favorably. Indeed, this could be reflected in the chronic illness advantage we observed among female migrants. Future research should try to investigate this possible trend with more recent data.
subjective of the three outcomes (women might perceive symptoms differently and be more willing to report them) (Verbrugge 1989). Such differences may also be enhanced by social isolation or hardship (Berchet and Jusot 2012). Women may also be more likely to report poor self-rated health due to the double discrimination they face in the host country, both as women and as ethnic minorities (Llacer 2007). One the other hand, chronic diseases and health limitations are more susceptible to being under-reported; migrants who are not well integrated into the health care system may find the concept of chronic illness and health limitations difficult to comprehend and report (Khlat and Guillot 2017).
With respect to the second and third hypotheses, we stated that the HIE would increase when adjusting for absolute educational attainment and then decrease or disappear when adjusting for relative educational attainment. The two expectations were well supported. This is important as it suggests that if we were to rely on absolute measures of SES when conducting analyses we would introduce bias into our estimates, inflating health disparities between migrants and natives.
Unfortunately, sample size did not allow us to analyze the full extent of the heterogeneity of France’s foreign-born population (Beauchemin et al. 2015). In particular, the present study uses broad regions of origin within which the health outcomes (Hamel and Moisy 2012) and levels of educational attainment (Ichou, Goujon, and DIPAS 2017) vary substantially. This study is also limited to a single dimension of migrant selection: education. Educational selection is correlated with many other – observed and unobserved ‒ sources of migrant selection, such as occupation and motivation, and future research could seek to produce a more systematic analysis of the health consequences of migrant selection by incorporating additional dimensions of selection. Finally, although not the focus of our paper, the role of migrants’ duration of stay was examined using a cross-sectional survey. Future studies could improve this analysis by relying on longitudinal data sufficiently large to allow analyses to be stratified into narrow age groups.
References
Abraido-Lanza, A.F., Dohrenwend, B.P., Ng-Mak, D.S., and Turner, J.B. (1999). The Latino mortality paradox: A test of the ‘salmon bias’ and healthy migrant hypotheses. American Journal of Public Health 89(10): 1543–1548.
doi:10.2105/AJPH.89.10.1543.
Akresh, I.R. and Frank, R. (2008). Health selection among new immigrants.American Journal of Public Health 98(11): 2058–2064.doi:10.2105/AJPH.2006.100974. Allison, P.D. (1999). Comparing logit and probit coefficients across groups.Journal of
Service Management Research 28(2): 186–208. doi:10.1177/0049124199028 002003.
Anikeeva, O., Bi, P., Hiller, J.E., Ryan, P., Roder, D., and Han, G.S. (2015). Trends in migrant mortality rates in Australia 1981–2007: A focus on the national health priority areas other than cancer.Ethnicity and Health20(1): 29–48.doi:10.1080/ 13557858.2014.883368.
Anson, J. (2004). The migrant mortality advantage: A 70 month follow-up of the Brussels population. European Journal of Population 20(3): 191–198.
doi:10.1007/s10680-004-0883-1.
Attias-Donfut, C. and Tessier, P. (2005). Santé et vieillissement des immigrés.Retraite et société 46(3): 90–129.
Barro, R. and Lee, J.W. (2013). A new data set of educational attainment in the world, 1950–2010. Journal of Development Economics 104: 184–198. doi:10.1016/j. jdeveco.2012.10.001.
Beauchemin, C., Hamel, C., and Simon, P. (2015).Trajectoires et origines: Enquête sur la diversité des populations en France. Paris: Éditions de l’INED.
Berchet, C. and Jusot, F. (2012). État de santé et recours aux soins des immigrés: Une synthèse des travaux français.Questions d’économie de la santé (172): 1‒7
Blue, L. and Fenelon, A. (2011). Explaining low mortality among US immigrants relative to native-born Americans: The role of smoking.International Journal of Epidemiology40(3): 786–793.doi:10.1093/ije/dyr011.
Boulogne, R., Jougla, E., Breem, Y., Kunst, A.E., and Rey, G. (2012). Mortality differences between the foreign-born and locally-born population in France (2004–2007). Social Science and Medicine 74(8): 1213–1223. doi:10.1016/j. socscimed.2012.01.002.
Bross, I.D.J. (1958). How to use ridit analysis. Biometrics 14(1): 18–38. doi:10.2307/ 2527727.
Chiswick, B., Lee, Y.L., and Miller, P.W. (2008). Immigration selection systems and immigrant health.Contemporary Economic Policy26(4): 555–578.doi:10.1111/ j.1465-7287.2008.00099.x.
Crimmins, E.M., Soldo, B.J., Ki Kim, J., and Alley, D.E. (2005). Using anthropometric indicators for Mexicans in the United States and Mexico to understand the selection of migrants and the ‘Hispanic paradox.’ Social Biology 52(3–4): 164– 177.
De Grande, H., Vandenheede, H., Gadeyne, S., and Deboosere, P. (2014). Health status and mortality rates of adolescents and young adults in the Brussels-Capital Region: Differences according to region of origin and migration history.
Ethnicity and Health 19(2): 122–143.doi:10.1080/13557858.2013.771149. Deboosere, P. and Gadeyne, S. (2005). Adult migrant mortality advantage in Belgium:
Evidence using census and register data. Population 60(5–6): 655–698.
doi:10.3917/pope.505.0655.
Dinesen, C., Nielsen, S.S., Mortensen, L.H., and Krasnik, A. (2011). Inequality in self-rated health among immigrants, their descendants and ethnic Danes: Examining the role of socioeconomic position. International Journal of Public Health
56(5): 503–514.doi:10.1007/s00038-011-0264-6.
Domnich, A., Panatto, D., Gasparini, R., and Amicizia, D. (2012). The ‘healthy immigrant’ effect: Does it exist in Europe today?International Journal of Public Health9(3): 1–7.doi:10.2427/7532.
Eikemo, T.A., Skalicka, V., and Avendano, M. (2009). Variations in health inequalities: Are they a mathematical artefact? International Journal for Equity in Health
8(32): 1–5.doi:10.1186/1475-9276-8-32.
Feliciano, C. and Lanuza, Y.R. (2017). An immigrant paradox? Contextual attainment and intergenerational educational mobility.American Sociological Review82(1): 211–241.doi:10.1177/0003122416684777.
Fenelon, A. (2013). Revisiting the Hispanic mortality advantage in the United States: The role of smoking. Social Science and Medicine 82: 1–9. doi:10.1016/j. socscimed.2012.12.028.
Goldman, N., Kimbro, R.T., Turra, C.M., and Pebley, A.R. (2006). Socioeconomic gradients in health for White and Mexican-origin populations.American Journal of Public Health 96(12): 2186–2193.doi:10.2105/AJPH.2005.062752.
Grossman, M. (1972). On the concept of health capital and the demand for health.
Journal of Political Economy 80(2): 223–255.doi:10.1086/259880.
Hajat, A., Blakely, T., Dayal, S., and Jatrana, S. (2010). Do New Zealand’s immigrants have a mortality advantage? Evidence from the New Zealand Census-Mortality Study. Ethnicity and Health 15(5): 531–547. doi:10.1080/13557858.2010. 496479.
Hamel, C. and Moisy, M. (2012). Migration et conditions de vie: Leur impact sur la santé. In: Beauchemin, C., Hamel, C., and Simon, P. (eds.). Trajectoires et origines. Paris: INED: 263–287.
Hofmann, E.T. (2012). The burden of culture? Health outcomes among immigrants from the former Soviet Union in the United States. Journal of Immigrant and Minority Health 14(2): 315–322.doi:10.1007/s10903-010-9436-3.
Hosper, K., Nierkens, V., Nicolaou, M., and Stronks, K. (2007). Behavioural risk factors in two generations of non-Western migrants: Do trends converge towards the host population? European Journal of Epidemiology 22(3): 163–172.
doi:10.1007/s10654-007-9104-7.
Houweling, T.A.J., Kunst, A.E., Huisman, M., and Mackenbach, J.P. (2007). Using relative and absolute measures or monitoring health inequalities: Experiences from cross-national analyses on maternal and child health.International Journal for Equity in Health 6(15): 1–9.doi:10.1186/1475-9276-6-15.
Ichou, M. (2014). Who they were there: Immigrants’ educational selectivity and their children’s educational attainment.European Sociology Review 30(6): 750–765.
Ichou, M., Goujon, A., and DIPAS (2017). Immigrants’ educational attainment: A mixed picture, but often higher than the average in their country of origin.
Population and Societies 541: 1–4.
INED-INSEE (2008–2009). Trajectoires et origines: Enquête sur la diversité des populations en France. Paris: INED/INSEE.
Jusot, F., Silva, J., Dourgnon, P., and Sermet, C. (2009). Inégalités de santé liées à l’immigration en France. Revue Économique 60(2): 385–411.doi:10.3917/reco. 602.0385.
Karlson, K.B., Holm, A., and Breen, R. (2012). Comparing regression coefficients between same-sample nested models using logit and probit a new method.
Sociological Methodology 42(1): 286–313.doi:10.1177/0081175012444861. Kennedy, S., Kidd, M.P., McDonald, J.T., and Biddle, N. (2014). The healthy
immigrant effect: Patterns and evidence from four countries. Journal of International Migration and Integration 16(2): 317–332. doi:10.1007/s12134-014-0340-x.
Khlat, M. and Guillot, M. (2017). Health and mortality patterns among migrants in France. In: Trovato, F. (ed.). Migration, health and survival. Cheltenham: Edward Elgar: 193–213.doi:10.4337/9781785365973.00016.
Kimbro, R.T., Bzostek, S., Goldman, N., and Rodriguez, G. (2008). Race, ethnicity, and the education gradient in health. Health Affairs 27(2): 361–372. doi:10.1377/ hlthaff.27.2.361.
Kohler, U., Karlson, K.B., and Holm, A. (2011). Comparing coefficients of nested nonlinear probability models.Stata Journal 11(3): 420–438.
Kotwal, A.A. (2010). Physical and psychological health of first and second generation Turkish immigrants in Germany. American Journal of Human Biology 22(4): 538–545.doi:10.1002/ajhb.21044.
Lee, E.S. (1966). A theory of migration. Demography 3(1): 47–57. doi:10.2307/ 2060063.
Llacer, A., Zunzunegui, M.V., del Amo, J., Mazarrasa, L., and Bolumar, F. (2007). The contribution of a gender perspective to the understanding of migrants’ health.
Lynch, J.W., Kaplan, G.A., and Salonen, J.T. (1997). Why do poor people behave poorly? Variation in adult health behaviours and psychosocial characteristics by stages of the socioeconomic lifecourse.Social Science and Medicine 44(6): 809– 819.doi:10.1016/S0277-9536(96)00191-8.
Markides, K.S. and Coreil, J. (1986). The health of Hispanics in the southwestern United States: An epidemiologic paradox. Public Health Reports 101(3): 253– 265.
Markides, K.S. and Eschbach, K. (2011). Hispanic paradox in adult mortality in the United States. In: Rogers, R.G. and Crimmins, E.M. (eds.). International handbook of adult mortality. Dordrecht: Springer: 227–240. doi:10.1007/978-90-481-9996-9_11.
McDonald, J.T. and Kennedy, S. (2004). Insights into the ‘healthy immigrant effect’: Health status and health service use of immigrants to Canada.Social Science and Medicine 59(8): 1613–1627.doi:10.1016/j.socscimed.2004.02.004.
Medina-Inojosa, J., Jean, N., Cortes-Bergoderi, M., and Lopez-Jimenez, F. (2014). The Hispanic paradox in cardiovascular disease and total mortality. Progress in Cardiovascular Diseases57(3): 286–292.doi:10.1016/j.pcad.2014.09.001. Mehta, N.K. and Elo, I.T. (2012). Migrant selection and the health of US immigrants
from the former Soviet Union. Demography 49(2): 425–447. doi:10.1007/ s13524-012-0099-7.
Mood, C. (2010). Logistic regression: Why we cannot do what we think we can do, and what we can do about it. European Sociological Review 26(1): 67–82.
doi:10.1093/esr/jcp006.
Newbold, K.B. (2005). Self-rated health within the Canadian immigrant population: Risk and the healthy immigrant effect. Social Science and Medicine 60(6): 1359–1370.doi:10.1016/j.socscimed.2004.06.048.
Newbold, K.B. (2006). Chronic conditions and the healthy immigrant effect: Evidence from Canadian immigrants.Journal of Ethnic and Migration Studies32(5): 765– 784.doi:10.1080/13691830600704149.
Palloni, A. and Ewbank, D.C. (2004). Selection processes in the study of racial and ethnic differentials in adult health and mortality. In: Anderson, N.B., Bulatao, R.A., and Cohen, B. (eds.).Critical perspectives on racial and ethnic differences in health in late life. Washington, D.C.: National Academies Press: 171–225. Pol, L.G. and Thomas, R.K. (1992).The demography of health and health care. New
York: Springer.doi:10.1007/978-1-4615-8012-6.
Razum, O. (2008). Migrant mortality, healthy migrant effect. In: Kirch, W. (ed.).
Encyclopedia of public health. New York: Springer International: 932–935.
doi:10.1007/978-1-4020-5614-7_2188.
Razum, O., Zeeb, H., Akgun, H.S., and Yilmaz, S. (1998). Low overall mortality of Turkish residents in Germany persists and extends into a second generation: Merely a healthy migrant effect? Tropical Medicine and International Health
3(4): 297–303.doi:10.1046/j.1365-3156.1998.00233.x.
Reiss, K., Sauzet, O., Breckenkamp, J., Spallek, J., and Razum, O. (2014). How immigrants adapt their smoking behaviour: Comparative analysis among Turkish immigrants in Germany and the Netherlands. BMC Public Health
14(844): 1–11.doi:10.1186/1471-2458-14-844.
Riosmena, F., Wong, R., and Palloni, A. (2013). Migration selection, protection, and acculturation in health: A binational perspective on older adults. Demography
50(3): 1039–1064.doi:10.1007/s13524-012-0178-9.
Ro, A., Fleischer, N.L., and Blebu, B. (2016). An examination of health selection among US immigrants using multi-national data. Social Science and Medicine
158: 114–121.doi:10.1016/j.socscimed.2016.04.023.
Ro, A., Geronimus, A., Bound, J., Griffith, D., and Gee, G. (2016). Educational gradients in five Asian immigrant populations: Do country of origin, duration and generational status moderate the education-health relationship? Preventive Medicine Reports4: 338–343.doi:10.1016/j.pmedr.2016.07.001.
Ross, C.E. and Wu, C. (1995). The links between education and health. American Sociological Review 60(5): 719–745.doi:10.2307/2096319.
Ruiz, J.M., Steffen, P., and Smith, T.B. (2013). Hispanic mortality paradox: A systematic review and meta-analysis of the longitudinal literature. American Journal of Public Health 103(3): e52–e60.doi:10.2105/AJPH.2012.301103. Teruya, S.A. and Bazargan-Hejazi, S. (2013). The immigrant and Hispanic paradoxes:
A systematic review of their predictions and effects. Hispanic Journal of Behavioral Sciences 35(4): 486–509.doi:10.1177/0739986313499004.
Thomson, E.F., Nuru-Jeter, A., Richardson, D., Raza, F., and Minkler, M. (2013). The Hispanic paradox and older adults’ disabilities: Is there a healthy migrant effect?
International Journal of Environmental Research and Public Health 10(5): 1786–1814.doi:10.3390/ijerph10051786.
Turra, C.M. and Goldman, N. (2007). Socioeconomic differences in mortality among US adults: Insights into the hispanic paradox. The Journals of Gerontology, Series B: Psychological Sciences and Social Sciences 62(3): S184–S192.
doi:10.1093/geronb/62.3.S184.
Vaillant, N. and Wolff, F.C. (2010). Origin differences in self-reported health among older migrants living in France. Public Health 124(2): 90–98. doi:10.1016/ j.puhe.2010.01.005.
van de Werfhorst, H.G. and Heath, A. (2018). Selectivity of migration and the educational disadvantages of second-generation immigrants in ten host societies.
European Journal of Population.doi:10.1007/s10680-018-9484-2.
Vandenheede, H., Willaert, D., De Grande, H., Simoens, S., and Vanroelen, C. (2015). Mortality in adult immigrants in the 2000s in Belgium: A test of the ‘healthy-migrant’ and the ‘migration-as-rapid-health-transition’ hypotheses. Tropical Medicine and International Health 20(12): 1832–1845.doi:10.1111/tmi.12610. Vang, Z.M., Sigouin, J., Flenon, A., and Gagnon, A. (2017). Are immigrants healthier
than native-born Canadians? A systematic review of the healthy immigrant effect in Canada. Ethnicity and Health 22(3): 209–241.doi:10.1080/13557858. 2016.1246518.
Verbrugge, L.M. (1989). The Twain meet: Empirical explanations of sex differences in health and mortality. Journal of Health and Social Behavior 30(3): 282–304.
doi:10.2307/2136961.
Wallace, M. (2016). Adult mortality among the descendants of immigrants in England and Wales: Does a migrant mortality advantage persist beyond the first generation? Journal of Ethnic and Migration Studies 42(9): 1558–1577.
Wallace, M. and Kulu, H. (2014). Migration and health in England and Scotland: A study of migrant selectivity and salmon bias.Population, Space and Place 20(8): 694–708.doi:10.1002/psp.1804.
Wallace, M. and Kulu, H. (2015). Mortality among immigrants in England and Wales by major causes of death, 1971–2012: A longitudinal analysis of register-based data. Social Science and Medicine 147: 209–221. doi:10.1016/j.socscimed. 2015.10.060.
Appendix
Fictional example of the educational selectivity measure
Let us illustrate this measure using an example. Imagine a male migrant born in 1950 in country X who completed upper secondary school before emigrating to France. In country X, among the male population born in 1950, educational attainment is distributed as follows: 20% have no education, 15% have some primary school education, 25% completed primary school, 20% attended lower secondary school, 15% attended upper secondary school, and 5% received higher education. In this case, the migrant in question would have a relative educational attainment of (20+15+25 20) + 15/2 = 87.5%. For individuals who are born in France (i.e., G2 and nonmigrants), the reference group used to construct the relative education measure is the French population of the same sex and birth cohort.
Table A-1: KHB logistic regression coefficients for migration status (generation and duration of stay) across nested logistic models predicting self-rated health
Self-rated health Model 1 Model 2 Model 3
Male Female Male Female Male Female
G1 ≤5yr –0.563*** 0.056 –0.758*** –0.211 –0.641*** 0.149 G1 6–10yr –0.415*** 0.236* –0.596*** –0.028 –0.470*** 0.339***
G1 10yr+ 0.091 0.168 –0.033 0.044 0.068 0.334**
G2 –0.026 –0.137 –0.026 –0.120 –0.038 –0.153
Absolute educ. attainment –0.0571*** –0.0717*** –0.0288* –0.00767
Relative educ. attainment –0.00464** –0.0117***
Observations 6,006 6,915 6,006 6,915 6,006 6,915
Note: Age and age squared are also included as controls. *** p<0.01, ** p<0.05, * p<0.1.
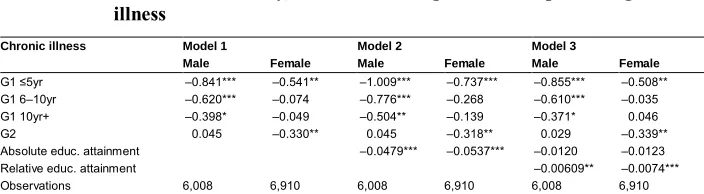
Table A-2: KHB logistic regression coefficients for migration status (generation and duration of stay) across nested logistic models predicting chronic illness
Chronic illness Model 1 Model 2 Model 3
Male Female Male Female Male Female
G1 ≤5yr –0.841*** –0.541** –1.009*** –0.737*** –0.855*** –0.508** G1 6–10yr –0.620*** –0.074 –0.776*** –0.268 –0.610*** –0.035 G1 10yr+ –0.398* –0.049 –0.504** –0.139 –0.371* 0.046
G2 0.045 –0.330** 0.045 –0.318** 0.029 –0.339**
Absolute educ. attainment –0.0479*** –0.0537*** –0.0120 –0.0123
Relative educ. attainment –0.00609** –0.0074***
Observations 6,008 6,910 6,008 6,910 6,008 6,910
Table A-3: KHB logistic regression coefficients for migration status (generation and duration of stay) across nested logistic models predicting health limitation
Health limitation Model 1 Model 2 Model 3
Male Female Male Female Male Female
G1 ≤5yr –0.466 –0.045 –0.747** –0.343 –0.532 –0.011 G1 6–10yr –0.314 –0.124 –0.575** –0.418* –0.342 –0.080
G1 10yr+ 0.220 0.000 0.043 –0.138 0.228 0.129
G2 0.136 –0.063 0.137 –0.044 0.115 –0.075
Absolute educ. attainment –0.0778*** –0.0802*** –0.0300 –0.0216
Relative educ. attainment –0.00854** –0.0107***
Observations 6,011 6,921 6,011 6,921 6,011 6,921
Note: Age and age squared are also included as controls. *** p<0.01, ** p<0.05, * p<0.1.
Table A-4: KHB logistic regression coefficients for migration status (generation, region of birth and duration of stay) across nested logistic models predicting self-rated health
Self-rated health Model 1 Model 2 Model 3
Male Female Male Female Male Female
G1 NAfr < 5 –0.838*** 0.168 –1.056*** –0.167 –0.913*** 0.201
G1 NAfr ≥5 –0.009 0.065 –0.095 –0.092 0.015 0.284
G1 SEur < 5 0.294 1.046*** 0.033 0.637* 0.088 0.904*** G1 SEur ≥5 0.503*** 0.780*** 0.149 0.285 0.252 0.443** G1 Othr < 5 –0.665*** –0.188 –0.795*** –0.375* –0.686*** –0.014 G1 Othr ≥5 –0.285 0.131 –0.365** 0.118 –0.272 0.367 G2 NAfr –0.061 –0.216* –0.063 –0.184 –0.078 –0.235*
G2 SEur 0.219 –0.007 0.189 0.005 0.163 –0.022
G2 Othr –0.252 –0.153 –0.211 –0.151 –0.203 –0.165
Absolute educ. attainment –0.0549*** –0.0710*** –0.0271 –0.00745
Relative educ. attainment –0.00457** –0.0116***
Observations 6,006 6,915 6,006 6,915 6,006 6,915
Table A-5: KHB logistic regression coefficients for migration status (generation, region of birth and duration of stay) across nested logistic models predicting chronic illness
Chronic illness Model 1 Model 2 Model 3
Male Female Male Female Male Female
G1 NAfr < 5 –1.724*** –0.704** –1.918*** –0.961*** –1.731*** –0.723** G1 NAfr ≥5 –0.571* –0.067 –0.647** –0.187 –0.503 0.058 G1 SEur < 5 –0.090 –0.900 –0.323 –1.213* –0.250 –1.040 G1 SEur ≥5 –0.296 –0.077 –0.613*** –0.453** –0.477** –0.351* G1 Othr < 5 –0.667** –0.408*** –0.783** –0.550* –0.640* –0.316 G1 Othr ≥5 –0.236 0.000 –0.307** –0.009 –0.185 0.152 G2 NAfr 0.120 –0.478 0.118 –0.454*** 0.099 –0.486***
G2 SEur 0.127 –0.270 0.100 –0.260 0.066 –0.278
G2 Othr –0.153 –0.213 –0.117 –0.212 –0.106 –0.220
Absolute educ. attainment –0.0477** –0.0552*** –0.0125 –0.0135
Relative educ. attainment –0.00599** –0.0075***
Observations 6,008 6,910 6,008 6,910 6,008 6,910
Note: Age and age squared are also included as controls. *** p<0.01, ** p<0.05, * p<0.1.
Table A-6: KHB logistic regression coefficients for migration status (generation, region of birth and duration of stay) across nested logistic models predicting health limitation
Health limitation Model 1 Model 2 Model 3
Male Female Male Female Male Female
G1 NAfr < 5 –0.178 –0.160 –0.518 –0.557 –0.242 –0.220
G1 NAfr ≥5 0.435 –0.337 0.302 –0.522 0.515 –0.177
G1 SEur < 5 –0.989 –0.289 –1.395 –0.773 –1.288 –0.528 G1 SEur ≥5 –0.037 0.169 –0.589** –0.413* –0.389 –0.268 G1 Othr < 5 –0.605 0.047 –0.808** –0.172 –0.597 0.158 G1 Othr ≥5 –0.342** 0.374 –0.466*** 0.359 –0.286 0.586*
G2 NAfr 0.168 –0.167 0.164 –0.129 0.137 –0.176
G2 SEur 0.176 –0.130 0.129 –0.115 0.079 –0.141
G2 Othr 0.052 0.106 0.115 0.108 0.132 0.095
Absolute educ. attainment –0.0807*** –0.0833*** –0.0317 –0.0262
Relative educ. attainment –0.00883** –0.0106***
Observations 6,011 6,921 6,011 6,921 6,011 6,921