yield of Shabut (
Seasonal changes in biochemical composition and meat
Barbus grypus
, Heckel 1843)
Ilkan Ali Olgunoglu
*; Mine Percin Olgunoglu; Engin Artar
Adiyaman University, Aquaculture and Fisheries Program, Kahta Vocational Training School, 02400
Kahta-Adıyaman, Turkey. *
Correspong author's email: iolgunoglu@adiyaman.edu.tr
Received: April 2010 Accepted: July 2010
Keywords: Shabut, Barbus grypus, Meat yield, Biochemical composition
According to the records of FAO (Food and Agriculture Organization), Shabut, also known as Barbus grypus, is one of the most signifcant fish species listed in the fresh waters of Iraq and in the rivers along South and Southwest Iran, the Karoon river, and also in The Euphrates River and Tigris Rivers in Turkey (Selki et al., 2005; Zivotofskya & Amar, 2006; Dorostghoal et al., 2009). This fish with dark anal and tail fins and other light colored fins (Selki et al., 2005) is one of the leading fish species from the Atatürk Dam Lake with great importance in economy (Olgunoğlu et al., 2009). Atatürk Dam is one of the largest earth-and-rock filled dams in the world, having been built on the Euphrates River in south-eastern Anatolia, Turkey, with a total area of 817 km2, is the biggest reservoir in Turkey and has a high fishing potential (Oymak et al., 2009). Through a retrospective study of the literature, it was recognized that the analysis carried out so far on Barbus grypus was insufficent and the data on its nutiritional value was inadequte. However, it is extremely important to determine and keep a record
of the nutritional quality of such type of nutrients for healthy consumption. In this study, Shabut (Barbus grypus) was examined for amino acid sufficiency and balance, aditionally the seasonal changes in nutritional values of mineral substances and fatty acids which are known to have extremely important effects on human health were identified with this research. The samples of Shabut (Barbus grypus) used in the research were classfied according to their length and then the amounts that were edible and inedible were identified with a 0.1g precesion scale to obtain meat yield. The ratio of the remaining weight of meat to the total body weight after removing the head, fins, scales and all internal organs was measured as the net edible meat yield and reported in percentage (%) (Izci & E rtan, 2004). For the spring and summer seasons 22 pairs and for autumn and winter seasons 21 pairs (86 fish) were used in this study. The average crude protein, fat, moisture, ash, carbohydrates, energy, copper, (Cu), zinc (Zn), iron (Fe), phosphorus (P) and calcium (Ca) amounts
182 Ilkan Ali Olgunoglu et al. Seasonal Changes in Biochemical Composition and ….
and analysis of fatty acids and amino acids on edible meat samples were carried out in the Industrial Services Laboratories of TUBITAK–MAM (The Scientific &
Technological Research Council of
Turkey at Marmara Reasearch Centre). The protein analysis belonging to the samples was carried out according to the Kjeldahl Method (Association of Official Analytical Chemists) (AOAC, 1995), the fat analysis was carried out according to the Acid Hydrolosis Soxtec System (AOAC, 1995), the moisture analysis was made by dehyrating the homogenized samples to a fixed weight with an incubator, and the raw ash was analysed by burning the samples at 550°C (AOAC, 1995). The carbohydrate and energy calculation of samples were evaluated with the Method of Watt and Merril (1975), Cu, Zn and Fe were identified according to Atomic Absorbtion Spectrophotometric
(AAS) Method (AOAC, 2005). The amino acid analysis was carried out on the Varian GC, CP-3800GC by using the devices (Anon, 1998), the fatty acids that belong to the samples were prepared according to the lipids methyl esters IUPAC II. D.19. (1979). Methods and analyses were carried out by using the Elmer Autosystem XL
Gas Chromotography and Flame
Ionization Detector (FID). Supelco 2330
Fused Silica Capillary Column
(30mx0.25mmx0.20μm film width) was used for determining the fatty acid composition. For data analysis, standard deviation and ANOVA were employed by using SPSS 13.0 Windows software. Significance of differences was defined at p<0.05. The average meat yield and biochemical composition values of Shabut (Barbus grypus) for four seasons are displayed on Table 1.
Table 1: Average meat yield and biochemical composition values of Shabut (Barbus grypus) for four seasons
Season Protein (g/100g)
Fat (g/100g)
Moisture (g/100g)
Ash (g/100g)
Carbo- hydrate (g/100g)
Energy (kcal/100g)
Meat yield (%)
Autumn
Winter
Spring
Summer
19.81±0.04a
19.63±0.09a
17.56±0.04b
20.38±0.05a
2.00±0.20a
5.73±0.12b
3.05±0.16a
5.40±0.21b
76.93±0.26a
72.40±0.18a
76.26±0.21a
73.02±0.19a
1.09±0.09a
1.24±0.02b
0.86±0.01c
1.07±0.07a
0.17±0.01a
1.00±0.02b
2.24±0.02c
0.13±0.01a
98±0.10a
134±0.13b
107±0.12a
131±0.20b
68.79±1.90a
71.83±4.80a
70.35±2.07a
68.66±6.47a
Seasonal
average 19.34±1.23 4.04±1.81 74.65±2.27 1.06±0.16 0.88±0.99 117.5±17.75 69.91±1.49 Values are shown as means ± SD of triplicate measurements
Mean values in the same row having the same superscript are significantly different (P<0.05)
The seasonal averages of protein, ash and moisture amounts displayed similarity to Papan & Moghaddam’s (2008) findings, the meat yield values of Shabut was higher compared to the other species reported by Özcan & Balık 2006; Şen et al.,1996; Duman et al., 2003. Considering that, energy amounts are commonly associated
with the fish fat content, the highest fat amount was found in winter and the energy value was also at the highest in this season.Shabut’s average copper (Cu), zinc (Zn), iron (Fe) phosphorus (P) and calcium (Ca) values according to seasons are displayed on Table 2.
Table 2: Average amount of mineral subtances in Shabut (Barbus grypus) according to seasons (mg/100g)
Season Cu Zn Fe P Ca
Autumn Winter Spring Summer
0.36±0.12a 0.08±0.00b 0.18±0.01c 0.24±0.01c
0.81±0.02a 1.07±0.04b 1.37±0.03b 0.95±0.05a
0.61±0.05a 0.13±0.02b 1.28±0.08c 0.73±0.11a
305.9±4.51a 252.7±2.94b 263.3±4.54b 237.4±4.59b
42.79±3.01a 12.38±2.06b 31.38±3.21a 65.24±3.21c
Seasonal
average 0.21±0.12 1.05±0.23 0.68±0.47 264.82±29.37 37.95±22.1
Values are shown as means ± SD of triplicate measurements
Mean values in the same row having the same superscript are significantly different (P<0.05).
The Fe amount obtained in our study is found close to the value that was reported by Oymak et .al (2009). From this point of view it can be said that Shabut is a significant source of Fe. Zn and Cu
findings were slightly higher than the reported values in the study carried out by Oymak et al., (2009). Shabut’s fatty acid
amounts according to seasons are
displayed on Table 3.
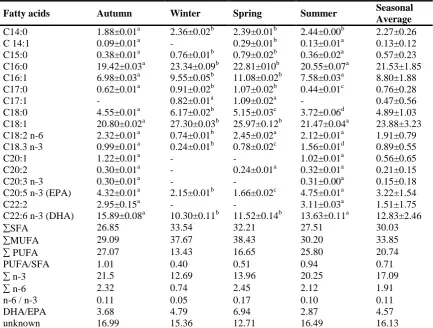
Table 3: The seasonal percent of fatty acid compostion in Shabut (Barbus grypus)
Values are shown as means ± SD of triplicate measurements.
Mean values in the same line having the same superscript are significantly different (P<0.05)
As displayed in Table 3, the highest fatty acid levels found in Shabut throughout all seasons were 16:0, 18:1, 22:6 n–3 ve 20:5 n–3. Palmithic acid (C 16:0) of the saturated fatty acids (SFA) was observed
as the primary fatty acid which remained predominant in Shabut in all seasons. In many studies caried out by researchers such as Rahman et al. (1995), Haliloğlu et al. (2002), Çeliket al. (2005) and Zlatanos
Fatty acids Autumn Winter Spring Summer Seasonal Average
C14:0 1.88±0.01a 2.36±0.02b 2.39±0.01b 2.44±0.00b 2.27±0.26
C 14:1 0.09±0.01a - 0.29±0.01b 0.13±0.01a 0.13±0.12 C15:0 0.38±0.01a 0.76±0.01b 0.79±0.02b 0.36±0.02a 0.57±0.23 C16:0 19.42±0.03a 23.34±0.09b 22.81±010b 20.55±0.07a 21.53±1.85 C16:1 6.98±0.03a 9.55±0.05b 11.08±0.02b 7.58±0.03a 8.80±1.88 C17:0 0.62±0.01a 0.91±0.02b 1.07±0.02b 0.44±0.01c 0.76±0.28
C17:1 - 0.82±0.01a 1.09±0.02a - 0.47±0.56
C18:0 4.55±0.01a 6.17±0.02b 5.15±0.03c 3.72±0.06d 4.89±1.03 C18:1 20.80±0.02a 27.30±0.03b 25.97±0.12b 21.47±0.04a 23.88±3.23 C18:2 n-6 2.32±0.01a 0.74±0.01b 2.45±0.02a 2.12±0.01a 1.91±0.79 C18.3 n-3 0.99±0.01a 0.24±0.01b 0.78±0.02c 1.56±0.01d 0.89±0.55 C20:1 1.22±0.01a - - 1.02±0.01a 0.56±0.65 C20:2 0.30±0.01a - 0.24±0.01a 0.32±0.01a 0.21±0.15 C20:3 n-3 0.30±0.01a - - 0.31±0.00a 0.15±0.18 C20:5 n-3 (EPA) 4.32±0.01a 2.15±0.01b 1.66±0.02c 4.75±0.01a 3.22±1.54 C22:2 2.95±0.15a - - 3.11±0.03a 1.51±1.75
C22:6 n-3 (DHA) 15.89±0.08a 10.30±0.11b 11.52±0.14b 13.63±0.11a 12.83±2.46
SFA 26.85 33.54 32.21 27.51 30.03
MUFA 29.09 37.67 38.43 30.20 33.85
PUFA 27.07 13.43 16.65 25.80 20.74
PUFA/SFA 1.01 0.40 0.51 0.94 0.71
n-3 21.5 12.69 13.96 20.25 17.09
n-6 2.32 0.74 2.45 2.12 1.91
n-6 / n-3 0.11 0.05 0.17 0.10 0.11
DHA/EPA 3.68 4.79 6.94 2.87 4.57
unknown 16.99 15.36 12.71 16.49 16.13
184 Ilkan Ali Olgunoglu et al. Seasonal Changes in Biochemical Composition and ….
and Laskaridis (2007) it was notified that the predominant primary saturated fatty acid (SFA) in fresh water fish was palmithic acid.
Through the study, oleic acid (C18:1), a monounsaturated fatty acid type
(MUFA), was observed as the
predominant primary fatty acid throughout four seasons. Palmitholeic acid (C 16:1) was identifed as the secondarily important monounsaturated fatty acid. In many studies carried out in order to determine the fatty acid composition of different fresh water fish, it has been reavealed that the predominant characteristic MUFA’s are oleic acid and palmitholeic acid (Oliveira et al., 2003; Çelik et al. 2005;
Gonza’lez et al., 2006; Güler et al. 2008; Suloma et al. 2008; £uczyñskaande et al. 2008; Akpınar et al. 2009; Osibona et al. 2009).Through the study, C22:6 n–3 (DHA) and C20:5 n–3 (EPA) of poly-unsaturated fatty acids were identified as the predominant primary fatty acids throughout four seasons. Information stating that DHA’s and EPA’s were predominant in fresh water fish out of total PUFAs was similarly reported by many researchers (Oliveira et al., 2003; Çelik et al., 2005; Sushchik et al., 2007; Güler et al., 2008, £uczyñska et al., 2008).The amino acid amounts in Shabut according to seasons are displayed in Table 4.
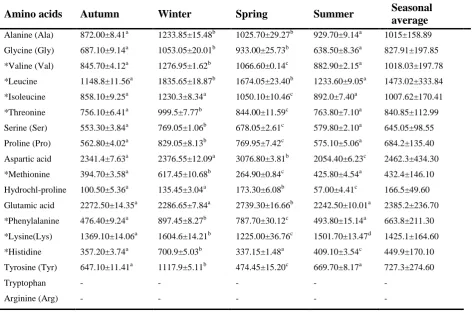
Table 4: The seasonal amino acid amounts (mg/100g) in Shabut (Barbus grypus)
Amino acids Autumn Winter Spring Summer Seasonal average Alanine (Ala) Glycine (Gly) *Valine (Val) *Leucine *Isoleucine *Threonine Serine (Ser) Proline (Pro) Aspartic acid *Methionine Hydrochl-proline Glutamic acid *Phenylalanine *Lysine(Lys) *Histidine Tyrosine (Tyr) Tryptophan Arginine (Arg) 872.00±8.41a 687.10±9.14a 845.70±4.12a 1148.8±11.56a 858.10±9.25a 756.10±6.41a 553.30±3.84a 562.80±4.02a 2341.4±7.63a 394.70±3.58a 100.50±5.36a 2272.50±14.35a 476.40±9.24a 1369.10±14.06a 357.20±3.74a 647.10±11.41a - - 1233.85±15.48b 1053.05±20.01b 1276.95±1.62b 1835.65±18.87b 1230.3±8.34a 999.5±7.77b 769.05±1.06b 829.05±8.13b 2376.55±12.09a 617.45±10.68b 135.45±3.04a 2286.65±7.84a 897.45±8.27b 1604.6±14.21b 700.9±5.03b 1117.9±5.11b - - 1025.70±29.27b 933.00±25.73b 1066.60±0.14c 1674.05±23.40b 1050.10±10.46c 844.00±11.59c 678.05±2.61c 769.95±7.42c 3076.80±3.81b 264.90±0.84c 173.30±6.08b 2739.30±16.66b 787.70±30.12c 1225.00±36.76c 337.15±1.48a 474.45±15.20c - - 929.70±9.14a 638.50±8.36a 882.90±2.15a 1233.60±9.05a 892.0±7.40a 763.80±7.10a 579.80±2.10a 575.10±5.06a 2054.40±6.23c 425.80±4.54a 57.00±4.41c 2242.50±10.01a 493.80±15.14a 1501.70±13.47d 409.10±3.54c 669.70±8.17a - - 1015±158.89 827.91±197.85 1018.03±197.78 1473.02±333.84 1007.62±170.41 840.85±112.99 645.05±98.55 684.2±135.40 2462.3±434.30 432.4±146.10 166.5±49.60 2385.2±236.70 663.8±211.30 1425.1±164.60 449.9±170.10 727.3±274.60 - -
*Essential amino acids
Mean values in the same rows having the same superscript are significantly different (P<0.05). Values are shown as means ± SD
Aspartic acid of the non-essential amino acids (Asp) and glutamic acid (Glu) were revealed as the amino acids with the highest levels in all seasons, while lysine (Lys), leusine (Leu) and valine (Val) were reported as the essential amino acids with the highest amounts. Similar results were reported for many fresh water species by many researchers (Adeyeye 2009; Kaya et al., 2008; Gonza’lez et al., 2006).
In conclusion, it is revealed that Shabut has a high meat effciency containing protein, fatty acids and amino acids, besides being a species rich in mineral content such as Cu, Zn, and Fe.
Acknowledgements
This Research Project was supported by
Adiyaman University Research
Foundation (Project No: KMYO BAP– 2008/1).
References
Adeyeye, E. I., 2009. Amino acid composition
of three species of Nigerian fish: Clarias anguillaris, Oreochromis niloticus and
Cynoglossus senegalensis. Food
Chemistry, 113, 43–46.
Association of Official Analytical Chemists,
1995. Method 925.10 and 990.03. Association of Official Analytical
Chemists Official Methods of Analysis 16th ed. Washington
Association of Official Analytical Chemists,
2005. Method 999.10. Official Methods of Analysis of AOAC International. Methods
18th.Ed. AOAC International, Gaithersburg, MD,USA
Akpinar, M. A., Görgün, S. and Akpinar, A.
E., 2009. A comparative analysis of the
fatty acid profiles in the liver and muscles
of male and female Salmo trutta macrostigma. Food Chemistry, 112, 6–8.
Celik, M., Diler, A. and Küçükgülmez, A.,
2005. A comparison of the proximate
compositions and fatty acid profiles of zander (Sander lucioperca) from two
different regions and climatic conditions.
Food Chemistry, 92, 637–641.
Dorostghoal, M., Peyghan, R., Papan, F.
and Khalili, L., 2009. Macroscopic and microscopic studies of annual ovarian
maturation cycle of Shirbot Barbus grypus in Karon river of Iran. Shiraz University.
Iranian Journal of Veterinary Research,
27, 172–179.
Duman, E., Yüksel, F. and Pala, M., 2003.
The investigation of growth characteristics and meat yield of Barbus capito pectoralis
(Heckel, 1843). Ege University Journal of Fisheries & Aquatic Sciences,20(3–4),
391–398 (in Turkish)
Gonza’lez, S., Flick, G. J., O’Keefe, S. F.,
Duncan, S. E., McLean, E. and Craig, S.
R., 2006. Composition of farmed and wild yellow perch (Perca flavescens).
Journal of Food Composition and
Analysis, 19, 720–726.
Guler, G. O., Kiztanir, B., Aktümsek, A.,
Citil, O. B. and Ozparlak, H., 2008.
Determination of the seasonal changes on
total fatty acid composition and 3/6
ratios of carp (Cyprinus carpio L.) muscle
lipids in Beysehir Lake (Turkey), Food Chemistry, 689–694.
Haliloglu, H. I and Aras, N. M., 2002.
Comparison of muscle fatty acids of three
trout species (Salvelinus alpinus, Salmo trutta fario, Oncorhynchus mykiss) raised
under the same conditions. Turkish
186 Ilkan Ali Olgunoglu et al. Seasonal Changes in Biochemical Composition and ….
Journal of Veterinary and Animal Science, 26, 1097–1102.
Anonymous, 1998. Eppendorf Biotronik LC 3000 Amino Acid Analyzer, Operation
Manuel 1998, June Phenomenex EZ Faast GC-FID Hydrolized Amino Acid Analysis
Kit, Varian GC, CP-3800GC Manuel
IUPAC 1979. Standard Methods for Analysis of Oils, Fats and Derivatives, 6th Edition
(Fifth Edition Method II.D.19) 96-102. Pergamon Pres, Oxford
İzci, L. and Ertan, O. Ö., 2004. Changes in
meat yield and food component of smoked
tench (Tinca tinca L., 1758). Turkish
Journal of Veterinary and Animal
Sciences, 28, 1037–1041.
Kaya, Y., Turan H. and Erdem M. E., 2008. Fatty acid and amino acid composition of
raw and hot smoked sturgeon (Huso huso, L. 1758). International Journal of Food
Sciences and Nutrition, 59(7–8), 635–642.
£uczyñska, J., Borejszo, Z. and £uczyñski,
M. J., 2008. The Composition of fatty
acids in muscles of six Freshwater fish
species from the Mazurian Great Lakes
(Northeastern Poland). Archives of Polish
Fisheries, 16(2), 167–178.
Olgunoğlu, İ. A., Artar E. and Olgunoğlu
M.P., 2009. The fısherıes sıtuatıon and economıc fısh species caught in Adıyaman provınce. Journal Agriculture Faculty of
Harran University, 13 (2), 29- 34.(in
Turkish)
Oliveira, E. R. N. de, Agostinho, A. A. and
Matsushita, M., 2003. Effect of Biological Variables and Capture Period
on the Proximate Composition and Fatty
Acid Composition of the Dorsal Muscle Tissue of Hypophthalmus edentatus
(Spix,1829). Brazilian Archives of Biology and Technology, 46,1 105–114.
Osibona, A. O., Kusemiju, K. and Akande
G. R., 2009. Proximate composition and
fatty acids profile of the African Catfish Clariasgariepinus. acta Satech, 3(1), 85 –
89.
Oymak, S. A., Akın, H. H. and Doğan, N., 2009. Heavy metal in tissues of Tor
grypus from Atatürk Dam Lake, Euphrates River-Turkey. Biologia, 64(1), 151—155. Özcan, G. and Balık, S., 2006. The
investigation of meat yield of
Chondrostoma meandrense Elvira, 1987 in
the Kemer Dam Lake. Ege University Journal of Fisheries & Aquatic Sciences,
23(3–4), 449–451.(in Turkish)
Papan, F. and Moghaddam, A. X., 2008.
Nutriotanal Evaluation of Some Species of Fishes in Khuzestan and Determination of
the Amount of Soy Bean Meal Used in the
Fish Food Formula on the Basis of its Isoflavone Content. Journal of Biological
Sciences, 8 (3), 667–670
Rahman, S. A, Huah, T. S., Hassan, O. and
Daud, N. M., 1995. Fatty acid composition of some Malaysian
freshwater fish. Food Chemistry, 54, 45–
49.
Selki, M. S., Başusta, N. and Çiftçioğlu, A.,
2005. A Stuy On Shabbout Fish (Tor grypus) Culture National Water Day. Turkish Journal
Of Aquatic Life, 3(4), 523–525. (in Turkish)
Suloma, A., Ogata, H. Y., Garibay, E. S,
Chavez, D. N. and El-Haroun, E. R.,
2008. Fatty Aciıd Composıtıon of Nile
Tilapia Oreochromıs niloticus muscles: a Comparatıve Study With Commercially
Important Tropical Freshwater fish in
Philippines 8th International Symposium on Tilapia in Aquaculture. 921–932.
Sushchik, N. N., Gladyshev, M. I. and
Kalachova, G. S., 2007. Seasonal
dynamics of fatty acid content of a common food fish from the Yenisei river,
Siberian grayling, Thymallus arcticus.
Food Chemistry, 104, 1353–1358.
Şen, D., Duman, E., Duman, M. and Yapar,
A., 1996. A investigation of biological features of Barbus esocinus Heckel, 1843
and Barbus xanthopterus Heckel, 1843 populations living in Keban Dam Lake. Fırat Univ., Journal of Science and
Engineering, 8(1), 113–129.
Watt, B. K. and Merrill, A. L., 1975.
Composition of Foods: Raw, Processed and Prepared (Agriculture Handbook No. 8.). United States Department of
Agriculture.Washington D.C.190p.
Zivotofskya, Ari Z. and Amar, Z., 2006.
Identifying the ancient shibuta fish.
Environmental Biology of Fishes,75, 361– 363.
Zlatanos, S. and Laskaridis, K., 2007. Seasonal variation in the fatty acid
composition of three Mediterranean fish – sardine (Sardina pilchardus), anchovy
(Engraulis encrasicholus) and picarel
(Spicara smaris). Food Chemistry, 103, 725–728.