Research Article
Simulation-Based Optimization for Improving
Hospital Performance
© 2017 Baghery et al; licensee Iran University of Medical Sciences. This is an open access article distributed under a Creative Commons Attribution-NonCommercial 3.0 Unported License (http://creativecommons.org/licenses/by/3.0), which
Background and Objectives
Recently, improving health services has become much important and has drawn attention among researchers. In this regard, quality of services provided for patients have been improved and is still improving due to its significance. Hospitals, which are considered as the substantial parts of the health service supply chain are not exempt from the mentioned improvements. Therefore, improving performance of hospital procedures has a major influence on the productivity and efficiency of the health care industry. Hence, researchers in various fields are moving toward improving the health service quality, for the purpose of meeting the requirements of physicians, nurses and patients. Recently, the major part of attention is only focused on emergency wards of health care centers and hospitals. In this regard, different patients with critical conditions referring to emergency ward should be prioritized according to the
*Corresponding Author: Azra Alizadeh, School of Medicine, Urmia Uni-versity of Medical Sciences, Urmia, Iran. Tel: +98 4431980265, Email: [email protected]
Majid Baghery
1, Hossein Pasha Abgarmi
2, Samuel Yousefi
3, Azra Alizadeh
4*, Hadi
Mahmoudzadeh
31Faculty of Management and Accounting, Allameh Tabataba’i University, Tehran, Iran. 2Faculty of Industrial Engineering, University of Kurdistan, Kurdistan, Iran. 3Faculty of Industrial Engineering, Urmia University of Technology, Urmia, Iran. 4School of Medicine, Urmia University of Medical Sciences, Urmia, Iran.
Background and Objectives: Hospitals are the final stage of health services delivery supply chain, and thus the quality of health services offered by hospitals directly impacts the well-being of individuals. Application of efficient operations research (OR) tools has proved powerful in finding non-intuitive solutions for enhanced hospital performance. The aim of the present study was to develop a design-of-experiments (DOE) model based on computer simulation to optimize key factors influencing health services quality, including queue length, patient waiting time, departure rate, and productivity.
Methods: The study was designed and implemented in Shomal hospital situated in Northern of Iran. The response surface methodology (RSM) was adopted as the DOE technique. The proposed simulation model considered all wards and their interactions together.
Findings: Our method demonstrated feasibility of reducing the decision-making risk and decreasing queue length and patient waiting time by evaluating and analyzing different scenarios.
Conclusions: Our study indicates the usefulness of adopting simulation-based approach in identifying bottlenecks of achieving high health services performance.
Keywords: Hospital performance, Medical processes, Simulation, Design of experiments, Response surface methodology
Abstract
type of health service they need. However, according to patient movements between various hospital wards, optimizing this supply chain by individually improving the performance of a specific ward is impossible and would not be an efficient strategy. Therefore, simultaneously optimizing the entire hospital procedures should be taken into account (comprising all movements done by patients between different wards, from his primary entrance until he exits the hospital). Hence, by taking advantage of this comprehensive approach, health service procedures will be improved in a continuous manner by concentrating on more critical hospital wards. On the other hand, hospital resource management is another important concept which should be addressed as well as possible by assigning the appropriate number of facilities, physicians, nurses, etc.1 Besides, optimization of some queueing theory parameters such as patient waiting time is of crucial importance. Therefore, by considering all the above mentioned concepts the satisfaction rate of patients could be increased and consequently the performance and productivity of the specific hospital will be improved. This paper aims at determining the appropriate number
IJHR
Open Access
Abstract
Background and Objectives: Endometrial hyperplasia (EH) is an abnormal overgrowth of endometrium that may lead to endometrial cancer, especially when accompanied by atypia. The treatment of EH is challenging, and previous studies report conflicting results. Metformin (dimethyl biguanide) is an anti-diabetic and insulin sensitizer agent, which is supposed to have antiproliferative and anticancer effects and the potential to decrease cell growth in endometrium. While some studies have evaluated the anticancer effect of metformin, studies on its potential effect on endometrial hyperplasia are rare. To address this gap, in this comparative trial study, we evaluate the effect of additive metformin to progesterone in patients with EH.
Methods: In this clinical trial, 64 women with EH were randomized in two groups. The progesterone-alone group received progesterone 20 mg daily (14 days/month, from the 14th menstrual day) based on the type of hyperplasia, and the progesterone-metformin group received metformin 1000 mg/day for 3 months in addition to progesterone. Duration of bleeding, hyperplasia, body mass index (BMI), and blood sugar (BS) of the patients were then com-pared between the two groups.
Findings: NA mean age of 44.5 years, mean BMI of 29 kg/m2 and mean duration of bleeding of 8 days were calcu -lated for the study sample. There was no significant difference in age, BMI, gravidity, bleeding duration, and duration of disease at baseline between the two groups. While all patients in the progesterone-metformin group showed bleeding and hyperplasia improvement, only 69% of the progesterone-alone patients showed such an improvement, with the difference between the two groups being significant (P = 0.001). Although the difference between two groups in the post treatment endometrial thickness was not significant (P = 0.55), post treatment BMI in the progesterone-metformin group was significantly lower than in the progesterone-alone group (P = 0.01). In addition, the BS reduction in the progesterone-metformin group was significantly larger than that in the progesterone-alone group (P = 0.001).
Conclusions: Our results indicated that administration of progesterone 20 mg/day plus metformin 1000 mg/day can significantly decrease bleeding duration, hyperplasia, BMI and BS in women with EH.
Keywords: Endometrial hyperplasia, Metformin, Progesterone
Background and Objectives
Endometrial hyperplasia (EH) is an abnormal over -growth of endometrium that may lead to endometrial cancer, especially when accompanied by atypia [1]. Although the effect appears only in 5% of asymptom-atic patients, its prevalence in patients with PCOS
and oligomenorrhea is about 20% [2]. Body mass index (BMI) and nulliparity are two main risk factors for EH. Other risk factors include chronic anovula-tion, early menarche, late onset of menopause and diabetes [3], which are related to increased circulat-ing estrogen [4]. The treatment of EH is challengcirculat-ing and previous studies report conflicting results [5]. Age, fertility, and severity of EH in histology are the most important factors determining the treatment op -tion [5]. Most studies have addressed hysterectomy in patients with atypical EH [5], particularly those with PCOS, and have led to conflicting results [5-11].
Evaluation of the Effect of Additive
Metformin to Progesterone on Patients
with Endometrial Hyperplasia
Afsaneh Tehranian 1, Nasim Zarifi 1*, Akram Sayfolahi 2, Sara Payami 2, Faezeh Aghajani 2
1 Department of Gynecology and Obstetrics, Arash Women's Hospital, Tehran University of Medical Sciences, Tehran, Iran 2 School of Medicine, Tehran University of Medical Sciences, Tehran, Iran
*Corresponding author: Afsaneh Tehranian, Department of Gynecology and Ob-stetrics, Arash Women's Hospital, Tehran University of Medical Sciences, Tehran, Iran, P.O.Box: 1653915981, Tel: +98 21 77719922, Fax: +98 21 2177883196, E-mail: [email protected]
RESEARCH ARTICLE
of physicians, nurses and other crucial resources and decreasing the unnecessary movements of patients between different hospital wards due to hospital resource restrictions. The main advantages of this approach are achieving customer satisfaction, higher profit margins, capacity prediction and finally patient health level enhancement as the most important achievement. In this regard, hospitals should focus on reliability of health care procedures and patient’s health, in order to gain higher profit margins and competitive advantages.
Computer simulations reproduce the behavior of a system using a model and could be used to evaluate the system outputs. The purpose of this research is optimizing the hospital procedures in addition to hospital resource management by presenting an integrated approach, by combing design of experiments (DOE) and computer simulation. This research concentrates on modeling the specialty and subspecialty wards of a specific hospital by utilizing discrete-event simulation. Then, with the purpose of identifying potential bottlenecks of hospital the simulation model has been run several times by ARENA version 14 software and different scenarios are proposed for the sake of improving hospital procedures. Afterwards, by the application of design of experiments (response surface methodology [RSM] in this study) Pareto optimum solution sets are obtained, according to available resource constraints and four predefined objective functions. The predefined objective functions are, namely queue length, productivity of resources, number of exits in the system and waiting time in queue. Finally, beneficial analysis is done by taking advantage of the outputs of Expert Design version 10.
This study is organized as follows: in Section 2, the literature review and previous conducted researches associated with the application of simulation methods in health service is presented and the research gap is identified in this area. In Section 3, theoretical foundations of our research, comprising simulation, design of experiments and RSM is gathered. In Section 4, the proposed approach is investigated. Section 5 covers studying a subspecialty hospital as our research case study. The results obtained from computer simulation and RSM outputs are analyzed in Section 6, and optimum resource levels are specified according to predefined objective functions. Finally, future research paths are gathered in Section 7.
Blasak et al applied simulation models for emergency department and medical telemetry units at Rush North Shore Medical Center. Their proposed model provided a better perception of the operations of both units as well as the interactions between the mentioned units.2 Yeh and Lin used an integrated approach of simulation and genetic
algorithm (GA) to improve the service quality of a hospital emergency ward. After analyzing results, it was revealed that by appropriate scheduling of nurses, patient waiting times will be decreased and as result patient satisfaction is enhanced.3 Hongqiao et al simulated the complicated hospital systems considering a multi-agent technology and satisfactory achievements were gained, such as minimized costs and maximized health service quality.4 Brenner et al carried out a research in the emergency department at the university of Kentucky Chandler hospital and were capable of identifying the bottlenecks, thereby assigning the appropriate number of resources in hospital departments.5
Steins et al concentrated on scheduling operating rooms in a regional hospital in Sweden and were seeking to obtain higher resource utilization.6 Simulation results revealed that implementation of proposed scenarios would increase resource utilization as well providing a more efficient scheduling for nurses. Günal and Pidd presented a paper providing a comprehensive literature review on the application of discrete event simulation models in health care.7 Their research revealed that there was a wide diversity in the objectives of previous researches. In this regard, the reasons why specific models are more prevalent in previous studies than generic approaches were discussed. Reynolds et al utilized a discrete event simulation model to simulate hospital pharmacy outpatient dispensing systems.8 Potential impacts of changes in prescription workload, staffing levels, etc. were estimated by examining different scenarios. Günal and Pidd presented a generic, discrete event simulation model for investigating aspects of hospital performance. In their research, it was demonstrated how the proposed approach was utilized to investigate entire performance of a hospital, located in England.9
investigated bed utilization rate of a hospital in Norway through simulation and optimization.13 Their approach provided a strong tool for optimizing bed utilization rate in hospitals, thereby indicating a dramatic decrease in number of utilized beds, in case of encountering a large flow of patients in hospital.
Van Buuren et al presented a discrete event simulation model for emergency medical service (EMS) call centers. Their approach provides a clear perception of EMS call centers and could be utilized in strategic issues.14 Shukla et al15 proposed a systematic methodology to develop a discrete event simulation model based on role activity diagram (RAD), capable of addressing bottlenecks, low throughputs, low resource utilization and long waiting times. Raja proposed a framework to forecast the possible future state of a hospital by combing two concepts of times series forecasting and simulation. Furthermore, this framework was capable of predicting inpatient unit (IN) length of stay (LOS) at the time of admission, by applying data mining techniques.16 Gateri predicted the number of patients in the queue by making use of Monte Carlo simulation.17 Their presented model, after conducting experiments, revealed that it could be implemented to enhance resource utilization and decrease operating costs. Brahma developed a technique based on queueing theory and simulation to optimize the hospital central laboratory sample collection room.18 Devapriya et al developed a decision support system tool based on a discrete event simulation model, to address issues such as bed capacity,19 validation of their simulation model proved its accuracy, consistency and generic nature. Wang et al presented a hypothetical inpatient flow process model based on discrete event simulation in a large acute care hospital. Multi-objective simulation and MO-COMPASS approach were examined to investigate Pareto optimal solutions.20
Mathews proposed a simulation model for intensive care unit (ICU) patient flow with the purpose of improving ICU throughout and planning hospital capacity. According to their results, ICU admission waiting time was decreased by reallocating beds and unit occupancy was increased.21
Kadı et al modeled a university hospital blood laboratory by discrete event simulation to identify bottlenecks and examine hospital processes.22 The obtained simulation results revealed that proposed scenarios were capable of decreasing the throughput time. Silva et al utilized a simulation model to facilitate health service management in a hospital.23 Their purpose was offering a discrete event simulation model representing a hospital subsystem, thereby revealing the advantage of the proposed model in reconfiguring service portfolio provided by the medical
unit. DeRienzo et al conducted a research in a hospital neonatal intensive care unit, aiming at prediction of staffing needs.24 Achieved results, demonstrated the capability of the model in estimating annual admissions, transfers and deaths, on the basis of two different staffing levels. Demir et al25 developed a decision support tool (DST) for the sake of management purposes in a National Health Service (NHS) in England.25 The tool allows decision makers to appreciate system operations according to its simplicity and applicability.
By taking into consideration all the above-mentioned papers, it could be understood that all of these researches are focusing on only a single hospital ward, thereby neglecting the total relationships between hospital wards. In other words, management of all hospital wards along with utilized resources, has not been considered in a comprehensive manner. Hence, in this study by presenting an integrated model of DES-DOE (discrete event simulation-design of experiments), the possibility of optimizing all hospital processes comprehensively is provided. In this research, DOE has been utilized for the sake of preventing a large number of experiments and determining levels of input factors simultaneously. In addition, RSM as one of DOE techniques, is beneficial in case of investigating interaction between experiments. Furthermore, utilizing simulation approaches has facilitated management of hospital processes, demonstrating interactions between hospital wards in real cases. In this research, a discrete event simulation model has been integrated with a DOE approach, utilizing computer simulation outputs as inputs of DOE approach. This proposed integrated approach is of significant importance, due to its capability of pausing the system or even reallocating resources, according to factors such as time, cost, individuals, etc. The novelty of this research is based on integrating a computer simulation model with RSM technique, providing a predictive model for optimization and selecting the best possible scenarios for the entire hospital processes/wards.
Methods
Simulation
computer simulation languages such as Arena, it is beneficial for a majority of groups. Simulation models are defined as tools for predicting the effects of changes made in existent systems, also as designing tools for predicting performance of new systems.26 Recently, application of simulation models has increased dramatically in health service affairs. The main reasons of these frequent applications are the increasing complexity of health care systems, wide capability of simulation models in modeling complex systems and finally the dramatic development of simulation soft wares. However, the application of simulation modeling in health care affairs is definitely less than in industrial areas. Simulation is an appropriate tool for precise decision making based on observations and provides exceptional results for examining complex systems. In this regard, complexity is known as one of the evident features of health care systems. This technique, provides us fascinating insight into the problem, by modeling and visualizing health care systems. In fact, simulation provides a real visualization of the system for the researcher, by performing a dynamic analysis of it. This process, improves the researcher’s perception of the real system and this clear understanding is very valuable for making improvement in the studying system.27 A major part of simulation models has been applied in emergency wards of hospitals for the purpose of enhancing efficiency. Many hospital simulation models allow managers to observe applicability of the model in real systems, before implementing them in real systems. Hence, managers would be given the chance of selecting the most satisfactory scenarios. The mechanism of simulation is based on predicting future by utilizing historical data. Therefore, application of simulation models in health care has drawn attention among researchers due to its significance and accuracy. In this regard, precise input data is substantial and required, given that people’s lives are influenced directly by taken decisions.
Simulation models are categorized according to different factors such as time, status and probabilistic components. Static simulation model is a representation of a system at a particular point in time. However, dynamic simulation models are used to model systems which time evolution is considered. Whenever simulation of dynamic behavior of the entire system is under consideration, these models are applied. On the other hand, simulation models could be categorized as discrete event simulation or continuous simulation, depending on system status. Continuous simulation models are attributed to modeled systems which vary continually with time. On the contrary, in discrete event simulation models the system can change only at a countable number of points in time. In this case, events
change system status, in which event is defined as an instantaneous occurrence (e.g. arrival of a new customer). This kind of simulation is utilized whenever a precise statistical analysis is required. Finally, models, depending on whether they contain probabilistic components or not, are categorized into stochastic models or deterministic models, respectively. To clarify, stochastic simulation models have at least one random input component and are presented by utilizing statistical distributions. In our research, according to the random arrival of patients, it is considered as stochastic simulation model; and due to considering time evolution, it is a dynamic simulation; and according to our queueing theory approach and related applied analysis in a specific hospital, this model fits into the category of discrete event simulation.
Response Surface Methodology
RSM is a branch of statistical and mathematical methods for improving, developing and optimizing processes. a Process could be defined as operations needed for converting a set of input variables to output variables (response variables). RSM methodology, is a technique used for estimating a relationship between some response variables and some independent variables, by applying a set of designed experiments and regression analysis.28,29 Furthermore, RSM methodology is an important branch of DOE, which implements a collection of statistical and mathematical techniques (encompassing statistical design of experiments, statistical modeling, preliminary optimization) for the purpose of developing a new process and production optimization.28,30 RSM is utilized in many industrial cases and other research areas such as31: 1) Designing a response procedure for the intended area 2) Optimization of the response or qualitative
characteristic (discovering the best factor levels for optimum production)
3) Joint optimization of several qualitative characteristics. RSM consists of a group of mathematical and statistical techniques for developing and optimizing processes. This approach, also has a significant application in designing and developing new products, in addition to improving existent products. Suppose, for instance, a researcher or engineer is considering a system or process consisting a response of interest, y and a number of associated control variables denoted by, x1,x2,…, xk. In this case, the relationship between the response variable and the control variables is approximated by the function presented in equation (1).28
1 2
( , ,..., )
ε
=
k+
y f x x
x
(1)could be very complicated.
ε
, is a random experimental error assumed to have a zero mean. In this case, the expected value of y is denoted by equation (2).1 2
( )= [ ( , ,..., )]k + [ ]
ε
E y E f x x x E (2)
x1,x2,…, xk variables are measured according to natural
units and are called natural variables. There are special cases of model (1), in case of having two independent variables, the fist-order model is as equation (3).
0 1 1 2 2
η β
=
+
β
x
+
β
x
(3)If the interactions between variables exists, they could be simply added to equation (3). The added interactions are defined as surface curvature. A general second-order design model is defined as:
2
0 1 1
η β = β = β β
<
= +
∑
kj j j+∑
kj jj j+∑∑
ij i ji j
x x x x (4)
Where xi and xj are design variables and β are tuning
parameters.
Research Methodology
First, indoor hospital processes are simulated via discrete event simulation. In fact, the main purpose of providing a simulation model in this study is modeling simultaneously different hospital wards and developing different scenarios, to examine patient waiting time, queue length, productivity and departure rate. After providing a computer simulation model, the next step is sampling and gathering data. The required data were randomly gathered according to each hospital ward’s entrance and are presented in Table 1. Main steps of the proposed integrated approach, achieved by combing RSM and discrete event simulation are outlined as follows. A) determining distribution functions of hospital wards. B) screening and merging defined wards to achieve main hospital wards based on decision maker’s opinion. C) utilizing computer simulation for generating 40 distinct scenarios. D) Optimization in order to determine optimum levels of input variables by RSM.
In fact, in order to determine more efficiently optimum values of input factors (variables), only main hospital resources are considered (or some resources are merged) according to the decision maker’s opinion. Main input resources of the under investigation hospital consist of operating room, labor room, ICU, CCU, specialist, general practitioner, physiotherapy, pharmacy, radiology and sonography. According to the levels of input variables and different outputs, RSM is applied to determine the Pareto optimum solutions. To clarify, in this research, outputs are queue length, departure rate, patient waiting
time and productivity. The conceptual model of research is illustrated in Figure 1.
Case Study
This research was conducted at a specialty and subspecialty hospital, named Shomal located in North of Iran. The wards of the hospital consist of clinic, paraclinic, inpatient, intensive care, surgery, etc. The clinic consists of ENT, orthopedics, internal, obstetrics and gynecology, neurosurgery and surgery. The paraclinic consists of imaging, pharmacy and laboratory. The inpatient ward consists of maternity, internal surgery, pediatrics and labor room. The intensive care ward consists of ICU, CCU, etc. the surgery ward consists of operating room, outpatient operating room, emergency, labor room, etc. this mentioned hospital is considered as a system, in which optimization of resource utilization and service rate is of crucial importance. Consequently, by taking advantage of optimization, vital goals could be achieved, such as increase in patient satisfaction rate, productivity enhancement and increases in quality of offered health services. In this case, a discrete event simulation model based on RSM technique is implemented at this hospital to discover the optimum possible scenarios and utilize the available hospital resources as well as possible.
In this regard, the important model parameters should be defined. Model parameters in this research which should be calculated are entrance rate of patients to hospital, percentage of patients refereeing to emergency reception, first specialty reception, second specialty reception, intensive care ward reception, ophthalmology reception and maternity reception. Furthermore, determining service rate in emergency reception, first specialty reception, second specialty reception, intensive care ward reception, ophthalmology reception, maternity reception, neurosurgery, coronary surgery, orthopedics, ENT, internal, laboratory, general practitioner, pharmacy, labor room, radiology, sonography, morgue, physiotherapy and inpatient ward is required.
she is confined to bed where after a while the patient is discharged. Furthermore, after being visited by general practitioner, he/she is referred to the pharmacy with the probability of 25% and then he/she leaves the hospital. In the specialty ward, the patient after reception, is referred to neurosurgery with the probability of 50% or referred to cardiologist with the probability of 50%. Then, he leaves the hospital with the probability of 10% or refers to the intensive care ward with the probability of 20% (in this ward, he/she refers to ICU or CCU or internal ward with probabilities of 30%, 30% and 40%, respectively) or refers to the pharmacy with the probability of 70% and then leaves the hospital. In the eye ward, after reception, he/she refers to optometrist and then refers to ophthalmologist and
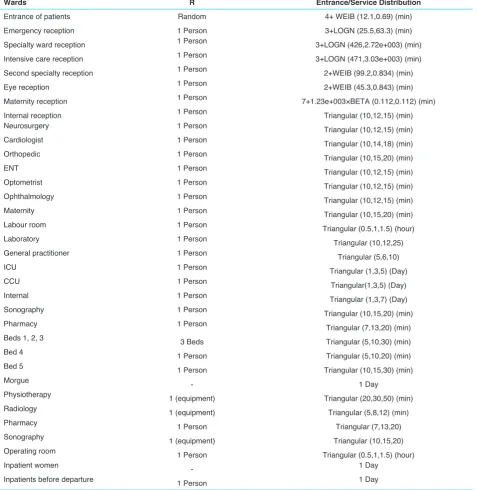
then refers to the pharmacy with the probability of 50% or leaves the hospital with the probability of 50%. In the maternity ward, after reception, she refers to obstetrician/ gynecologist with the probability of 50% or refers to the labor room with to probability of 50%. After going into labor in the labor room, she is confined to bed and then leaves the hospital. After referring to obstetrician/gynecologist, she refers to the sonography and then refers back to obstetrician/gynecologist, or she leaves the hospital. After sampling and examining via Arena (version 14) by Input Analyzer, the distribution function associated with each ward is gathered in Table 1. Furthermore, the simulation model of the under investigation hospital is illustrated in Figure 2.
Table 1. Distribution Function of Input Variables
Wards R Entrance/Service Distribution
Entrance of patients Random 4+ WEIB (12.1,0.69) (min) Emergency reception 1 Person 3+LOGN (25.5,63.3) (min) Specialty ward reception 1 Person 3+LOGN (426,2.72e+003) (min) Intensive care reception 1 Person 3+LOGN (471,3.03e+003) (min) Second specialty reception 1 Person 2+WEIB (99.2,0.834) (min)
Eye reception 1 Person 2+WEIB (45.3,0.843) (min)
Maternity reception 1 Person 7+1.23e+003×BETA (0.112,0.112) (min) Internal reception 1 Person Triangular (10,12,15) (min)
Neurosurgery 1 Person Triangular (10,12,15) (min)
Cardiologist 1 Person Triangular (10,14,18) (min)
Orthopedic 1 Person Triangular (10,15,20) (min)
ENT 1 Person Triangular (10,12,15) (min)
Optometrist 1 Person Triangular (10,12,15) (min)
Ophthalmology 1 Person Triangular (10,12,15) (min)
Maternity 1 Person Triangular (10,15,20) (min)
Labour room 1 Person Triangular (0.5,1,1.5) (hour)
Laboratory 1 Person Triangular (10,12,25)
General practitioner 1 Person Triangular (5,6,10)
ICU 1 Person Triangular (1,3,5) (Day)
CCU 1 Person Triangular(1,3,5) (Day)
Internal 1 Person Triangular (1,3,7) (Day)
Sonography 1 Person Triangular (10,15,20) (min)
Pharmacy 1 Person Triangular (7,13,20) (min)
Beds 1, 2, 3 3 Beds Triangular (5,10,30) (min)
Bed 4 1 Person Triangular (5,10,20) (min)
Bed 5 1 Person Triangular (10,15,30) (min)
Morgue - 1 Day
Physiotherapy 1 (equipment) Triangular (20,30,50) (min)
Radiology 1 (equipment) Triangular (5,8,12) (min)
Pharmacy 1 Person Triangular (7,13,20)
Sonography 1 (equipment) Triangular (10,15,20)
Operating room 1 Person Triangular (0.5,1,1.5) (hour)
Inpatient women - 1 Day
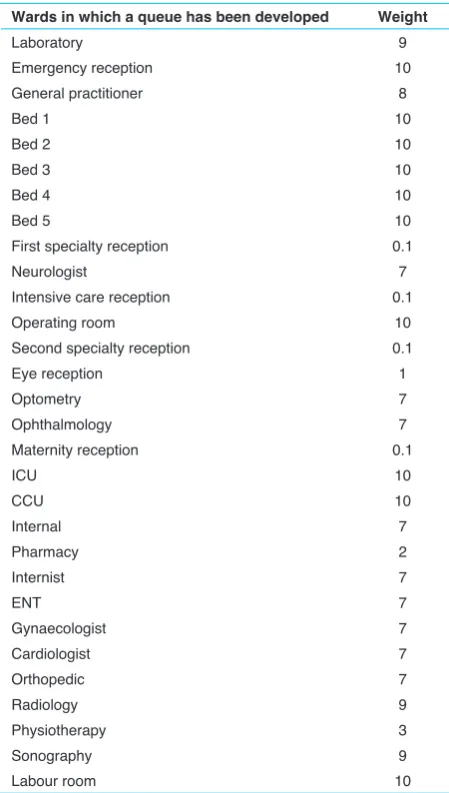
According to the importance of this hospital besides the essential need for health services being provided there, round-the-clock medical care is offered by the hospital staff. Furthermore, due to different significance of different hospital wards, distinct weights are assigned to various wards based on the management decisions, to provide reasonable results as well as possible. Distinct assigned Figure 1. Research Conceptual Model.
Figure 2. Simulation Model of Under Investigation Hospital.
weights for various hospital wards are gathered in Table 2.
Results and Discussion
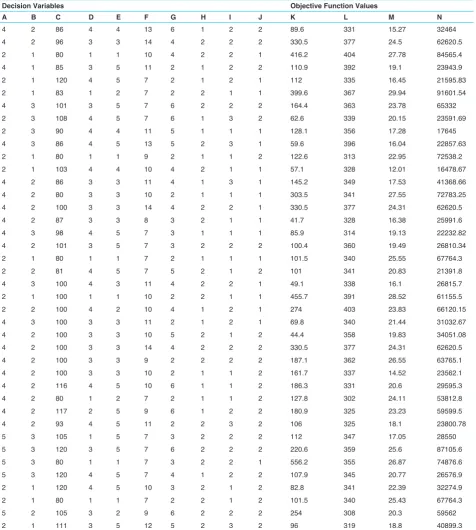
taking advantage of Process Analyzer via ARENA, 40 distinct scenarios are created and the obtained results are gathered in Table 4.
Then, in order to calculate feasible optimum solutions according to input variables RSM is applied. The Table 2. Importance Weight of Different Hospital Wards
Wards in which a queue has been developed Weight
Laboratory 9
Emergency reception 10
General practitioner 8
Bed 1 10
Bed 2 10
Bed 3 10
Bed 4 10
Bed 5 10
First specialty reception 0.1
Neurologist 7
Intensive care reception 0.1
Operating room 10
Second specialty reception 0.1
Eye reception 1
Optometry 7
Ophthalmology 7
Maternity reception 0.1
ICU 10
CCU 10
Internal 7
Pharmacy 2
Internist 7
ENT 7
Gynaecologist 7
Cardiologist 7
Orthopedic 7
Radiology 9
Physiotherapy 3
Sonography 9
Labour room 10
appropriate and efficient level of resources determined by decision maker is gathered in Table 3.
In the second phase of this research, and according to Table 3, for each scenario a desirability value has been calculated, by RSM via Expert Design. Afterwards, scenarios with desirability values above 0.65 were screened. The mentioned results are gathered in Table 5.
According to Table 5, it could be understood that scenarios 1 to 7 are the best and the values of input factors are at the optimum level, having a desirability value of 0.7. To clarify, these results are achieved by simultaneously optimizing four above mentioned objective functions and results are sorted according to their assigned desirability value, by applying RSM. By precisely investigating the obtained results it could be understood that ICU and CCU factors have been assigned values of 4 and 5, respectively. In other words, these two input factors are sensitive even to slight variations and by changing their assigned values their pertaining desirability decreases. Furthermore, the internal factor is sensitive and subject to change whenever high or low values are assigned to it. In addition, according to Table 5, 2 factors of operating room and labor room reveal an identical behavior and have been assigned relatively constant values, indicating sensitivity of these two input factors. Additionally, constant values have been assigned to two response variables of resource productivity and departure rate (21 and 348, respectively), indicating the fact that these two mentioned response variables are affected by two other response variables, namely queue length and waiting time in queue. In other words, it could be inferred that input factors of the designed experiment mainly affect response variables of queue length and waiting time in queue.
In this regard, Figure 3 illustrates a contour plot for desirability where X1 is the operating room and X2 is the Specialist. Contours are curves of constant response drawn
Table 3. Efficient Level of Input Factors (Variables) for Design of Experiments
Code Experiment Factors Levels of Factors (Variables) Response Variables
A Operating room L1=2,L2=3,L3=4
R1= Queue length
R2=Departure rate
R3=Resource productivity
R4=Waiting time in queue
B Labour room L1=1,L2=2,L3=3
C Internal [80,106]
D CCU L1=2,L2=3,L3=4
E ICU L1=4,L2=5
F Specialist L1=7,L2=8,L3=9, L4=11, L5=10, L6=13, L7=14 G General practitioner L1=2,L2=3,L3=4, L4=5
H Physiotherapy L1=1,L2=2
J Pharmacy L1=1,L2=2,L3=3
K Radiology L1=1,L2=2
Table 4. Distinct Scenarios Created via ARENA as an Input for Design of Experiments
Decision Variables Objective Function Values
A B C D E F G H I J K L M N
4 2 86 4 4 13 6 1 2 2 89.6 331 15.27 32464
4 2 96 3 3 14 4 2 2 2 330.5 377 24.5 62620.5
2 1 80 1 1 10 4 2 2 1 416.2 404 27.78 84565.4
4 1 85 3 5 11 2 1 2 2 110.9 392 19.1 23943.9
2 1 120 4 5 7 2 1 2 1 112 335 16.45 21595.83
2 1 83 1 2 7 2 2 1 1 399.6 367 29.94 91601.54
4 3 101 3 5 7 6 2 2 2 164.4 363 23.78 65332
2 3 108 4 5 7 6 1 3 2 62.6 339 20.15 23591.69
2 3 90 4 4 11 5 1 1 1 128.1 356 17.28 17645
4 3 86 4 5 13 5 2 3 1 59.6 396 16.04 22857.63
2 1 80 1 1 9 2 1 1 2 122.6 313 22.95 72538.2
2 1 103 4 4 10 4 2 1 1 57.1 328 12.01 16478.67
4 2 86 3 3 11 4 1 3 1 145.2 349 17.53 41368.66
4 2 80 3 3 10 2 1 1 1 303.5 341 27.55 72783.25
4 2 100 3 3 14 4 2 2 1 330.5 377 24.31 62620.5
4 2 87 3 3 8 3 2 1 1 41.7 328 16.38 25991.6
4 3 98 4 5 7 3 1 1 1 85.9 314 19.13 22232.82
4 2 101 3 5 7 3 2 2 2 100.4 360 19.49 26810.34
2 1 80 1 1 7 2 1 1 1 101.5 340 25.55 67764.3
2 2 81 4 5 7 5 2 1 2 101 341 20.83 21391.8
4 3 100 4 3 11 4 2 2 1 49.1 338 16.1 26815.7
2 1 100 1 1 10 2 2 1 1 455.7 391 28.52 61155.5
2 2 100 4 2 10 4 1 2 1 274 403 23.83 66120.15
4 3 100 3 3 11 2 1 2 1 69.8 340 21.44 31032.67
4 2 100 3 3 10 5 2 1 2 44.4 358 19.83 34051.08
4 2 100 3 3 14 4 2 2 2 330.5 377 24.31 62620.5
4 2 100 3 3 9 2 2 2 2 187.1 362 26.55 63765.1
4 2 100 3 3 10 2 1 1 2 161.7 337 14.52 23562.1
4 2 116 4 5 10 6 1 1 2 186.3 331 20.6 29595.3
4 2 80 1 2 7 2 1 1 2 127.8 302 24.11 53812.8
4 2 117 2 5 9 6 1 2 2 180.9 325 23.23 59599.5
4 2 93 4 5 11 2 2 3 2 106 325 18.1 23800.78
5 3 105 1 5 7 3 2 2 2 112 347 17.05 28550
5 3 120 3 5 7 6 2 2 2 220.6 359 25.6 87105.6
5 3 80 1 1 7 3 2 2 1 556.2 355 26.87 74876.6
5 3 120 4 5 7 4 1 2 2 107.9 345 20.77 26576.9
2 1 120 4 5 10 3 2 1 2 82.8 341 22.39 32274.9
2 1 80 1 1 7 2 2 1 2 101.5 340 25.43 67764.3
5 2 105 3 2 9 6 2 2 2 254 308 20.3 59562
2 1 111 3 5 12 5 2 3 2 96 319 18.8 40899.3
A, Operating room; B, Labour room; C, Internal; D, CCU; E, ICU; F, Specialist; G, General practitioner; H, Physiotherapy; I, Pharmacy; J, Sonography; K, Que length; L, Number of departures; M, Resource productivity; N, Waiting time in queue.
in the Xi, Xj plane keeping all other variables fixed. Each contour corresponds to a particular height of the response surface, as shown in Figure 3. According to Figure 3 it is evident that by simultaneously decreasing the value of operating room and labor room desirability increases and in its best status reaches to 0.7. Furthermore, by having a precise look at the contour plot lines and their pertaining slope it could be understood that although both factors have a reverse impact on increasing desirability but the
desirability increases and in its best status reaches to 0.7. Furthermore, by having a precise look at the contour plot lines and their pertaining slope it could be understood that although both factors have a reverse impact on increasing desirability but the factor of operating room has a higher impact on desirability.
Figure 5 illustrates a contour plot for desirability where X1 is the operating room and X2 is the ICU. Contours are curves of constant response drawn in the Xi, Xj plane keeping all other variables fixed. Each contour corresponds to a particular height of the response surface, as shown in Figure 5. According to Figure 5 it is evident that by decreasing the value of operating room and increasing the
value of ICU desirability of the scenario increases and in its best status reaches to 0.7. Furthermore, by having a precise look at the contour plot lines and their pertaining slope it could be understood that although the factor of operating room has a reverse impact on increasing desirability and the ICU factor has a straight relation with desirability, but the factor of operating room has a higher impact on desirability.
Figure 6 illustrates a contour plot for desirability where X1 is the internal ward and X2 is the Specialist. Contours are curves of constant response drawn in the Xi, Xj plane keeping all other variables fixed. Each contour corresponds to a particular height of the response surface,
Table 5. Running Scenarios and Calculation of Response Variables
Efficient Factors in Experiment Response Variables
Desirability
A B C D E F G H I J K L M N
2 2 91 4 5 12 2 2 2 2 14 348 21 16308 0.7
2 2 84 4 5 8 2 2 1 1 15 348 21 14102 0.7
3 3 82 4 5 13 4 1 2 2 15 348 21 12684 0.7
2 2 82 4 5 7 2 2 2 1 11 348 21 16432 0.7
3 3 91 4 5 9 3 2 1 2 11 348 21 14036 0.7
2 2 92 4 5 7 2 1 1 1 15 348 21 13987 0.7
2 2 96 4 5 9 2 1 2 2 5 348 21 15075 0.7
2 3 106 4 5 8 4 1 1 2 17 348 21 16478 0.699
2 2 80 4 5 11 2 1 2 1 22 348 21 11049 0.698
2 1 84 4 5 7 2 2 2 1 8 348 21 17887 0.696
2 2 101 4 5 8 2 2 2 2 28 348 21 16480 0.696
2 2 94 4 5 9 2 2 3 1 28 348 21 16214 0.696
2 3 87 4 5 7 3 2 2 1 33 348 21 16832 0.693
2 2 80 3 5 8 3 1 1 1 16 348 21 19368 0.693
2 3 88 4 5 14 5 1 1 2 52 348 21 16945 0.686
2 1 80 4 4 13 2 1 1 1 58 348 21 13512 0.686
4 3 93 4 5 12 2 2 3 2 59 348 21 17675 0.682
4 3 80 2 5 13 2 1 1 2 66 348 21 20938 0.672
3 1 80 4 5 13 5 2 3 2 45 348 21 28736 0.66
A, Operating room; B, Labour room; C, Internal; D, CCU; E, ICU; F, Specialist; G, General practitioner; H, Physiotherapy; I, Pharmacy; J, Sonography; K, Que length; L, Number of departures; M, Resource productivity; N, Waiting time in queue.
as shown in Figure 6. According to Figure 6 it is evident that by simultaneously decreasing the value of internal ward and specialist desirability increases and in its best status reaches to 0.7. Furthermore, by having a precise look at the contour plot lines and their pertaining slope it could be understood that although both factors have a reverse impact on increasing desirability, but the factor of specialist has a higher impact on desirability.
Conclusions
The purpose of this study is integrating a computer simulation model with RSM (as a design of experiments technique) to examine and optimize hospital processes, thereby increasing the satisfaction rate of patients and
decreasing hospital costs. In fact, in this study discrete event simulation is utilized and simulation outputs are considered as RSM inputs, providing the possibility to consider all hospital wards simultaneously despite previous researches which examined hospital wards individually. The presented approach has the advantage of pausing the system or even changing the system layout. According to this study, ten main wards are defined as input factors for RSM, namely operating room, labor room, ICU, CCU, specialist, general practitioner, physiotherapy, pharmacy, radiology and sonography. In this regard, desirability is considered as the response surface for RSM. After running the model by Expert Design results indicated that the best possible desirability was 0.7 associated with 7 Figure 4. Contour plot for desirability where X1 is the operating room and X2 is the internal ward.
Figure 5. Contour plot for desirability where X1 is the operating room and X2 is the ICU.
different scenarios. Although, this research is aiming at determining optimum levels of input factors in a real system, but some data related to some unpredictable events (such as human errors while gathering data) were eliminated. In conclusion, future works may encompass other industrial cases besides applying more precise and developed DOE techniques, to mitigate the risks and limitations encountered in this study.
Competing interests
The authors have no conflict of interest about this research.
Ethical approval
This article does not contain any studies with human participants or animals performed by any of the authors.
References
1. Wijewickrama AKA, Takakuwa S. Simulation analysis of an outpatient department of internal medicine in a university hospital. In: Proceedings of the 2006 Winter Simulation Conference. IEEE; 2006;425-432. doi:10.1109/ WSC.2006.323111
2. Blasak RE, Starks DW, Armel WS, Hayduk MC. Healthcare process analysis: the use of simulation to evaluate hospital operations between the emergency department and a medical telemetry unit. In: Proceedings of the 35th conference on Winter simulation: driving innovation. Winter Simulation Conference; 2003;1887-1893. doi:10.1145/1030818.1031079
3. Yeh JY, Lin WS. Using simulation technique and genetic algorithm to improve the quality care of a hospital emergency department. Expert Syst Appl. 2007;32(4):1073-1083. doi:10.1016/j.eswa.2006.02.017
4. Hongqiao Y, Xihua L, Fei W, Weizi L. Multi-agent based modeling and simulation of complex system in hospital. In: 16th International Conference on Industrial Engineering and Engineering Management, 2009. IE&EM’09. IEEE; 2009;1759-1763. doi:10.1109/ICIEEM.2009.5344312 5. Brenner S, Zeng Z, Liu Y, Wang J, Li J, Howard PK. Modeling
and analysis of the emergency department at University of Kentucky Chandler Hospital using simulations. J Emerg Nurs. 2010;36(4):303-310. doi:10.1016/j.jen.2009.07.018 6. Steins K, Persson F, Holmer M. Increasing utilization in a hospital
operating department using simulation modeling. Simulation. 2010;86(8-9):463-480. doi:10.1177/0037549709359355 7. Gunal MM, Pidd M. Discrete event simulation for performance
modelling in health care: a review of the literature. J Simul. 2010;4(1):42-51. doi:10.1057/jos.2009.25
8. Reynolds M, Vasilakis C, McLeod M, et al. Using discrete event simulation to design a more efficient hospital pharmacy for outpatients. Health Care Manag Sci.
2011;14(3):223-236. doi:10.1007/s10729-011-9151-1
9. Gunal MM, Pidd M. DGHPSIM: Generic simulation of hospital performance. ACM Trans Model Comput Simul. 2011;21(4):1-22. doi:10.1145/2000494.2000496
10. Gunal MM. A guide for building hospital simulation models. Health Syst. 2012;1(1):17-25. doi:10.1057/hs.2012.8 11. Zeng Z, Ma X, Hu Y, Li J, Bryant D. A simulation study to
improve quality of care in the emergency department of a community hospital. J Emerg Nurs. 2012;38(4):322-328. doi:10.1016/j.jen.2011.03.005
12. Chetouane F, Barker K, Viacaba Oropeza AS. Sensitivity analysis for simulation-based decision making: Application to a hospital emergency service design. Simulation Modelling Practice and Theory. 2012;20(1):99-111. doi:https://doi. org/10.1016/j.simpat.2011.09.003
13. Holm LB, Luras H, Dahl FA. Improving hospital bed utilisation through simulation and optimisation: with application to a 40% increase in patient volume in a Norwegian General Hospital. Int J Med Inform. 2013;82(2):80-89. doi:10.1016/j. ijmedinf.2012.05.006
14. Van Buuren M, Kommer GJ, van der Mei R, Bhulai S. A simulation model for emergency medical services call centers. In:2015 Winter Simulation Conference (WSC) (pp. 844-855.).IEEE; 2015. doi:10.1109/WSC.2015.7408221 15. Shukla N, Keast JE, Ceglarek D. Role activity
diagram-based discrete event simulation model for healthcare service delivery processes. Int J Syst Sci: Operations & Logistics. 2017;4(1):68-83. doi:10.1080/23302674.2015.1088098 16. Raja S. Time series driven simulation and data mining to
monitor hospital patient flow. Binghamton: State University Of New York; 2015.
17. Gateri JM. Predicting Number of Patients in the Queue using Monte Carlo Simulation [dissertation]. Nairobi, Kenya: Jomo Kenyatta University of Agriculture and Technology; 2015. 18. Brahma PK. Using Queueing Theory and Simulation Model
to Optimize Hospital Central Laboratory Sample Collection Room. ZENITH International Journal of Multidisciplinary Research. 2015;5(9):29-41.
19. Devapriya P, Stromblad CT, Bailey MD, et al. StratBAM: A Discrete-Event Simulation Model to Support Strategic Hospital Bed Capacity Decisions. J Med Syst. 2015;39(10):130. doi:10.1007/s10916-015-0325-0
20. Wang Y, Lee LH, Chew EP, et al. Multi-objective optimization for a hospital inpatient flow process via discrete event simulation. In: 2015 Winter Simulation Conference (WSC) (pp. 3622-3631). IEEE; 2015. doi:10.1109/ WSC.2015.7408521
21. Mathews KS. Simulation modeling to improve patient flow and bed utilization in the Intensive Care Unit. Icahn School of Medicine At Mount Sinai; 2016.
of a university hospital blood laboratory via discrete event simulation. Simulation. 2016;92(5):473-484. doi:10.1177/0037549716643167
23. Silva SB, Caulliraux HM, Spiegel T. Simulation model to assist the planning and management of Health Services.Sist Gest. 2016;10(4):608-616. doi:10.20985/1980-5160.2015. v10n4.616
24. DeRienzo CM, Shaw RJ, Meanor P, Lada E, Ferranti J, Tanaka D. A discrete event simulation tool to support and predict hospital and clinic staffing. Health Informatics J. 2017;23(2):124-133. doi:10.1177/1460458216628314 25. Demir E, Gunal MM, Southern D. Demand and capacity
modelling for acute services using discrete event simulation. Health Syst. 2017;6(1):33-40. doi:10.1057/hs.2016.1 26. Banks J, Carson JS, Nelson BL, Nicol D. Discrete-Event
System Simulation. New Jersey: Prentice Hall; 2004. 27. Jun JB, Jacobson SH, Swisher JR. Application of
discrete-event simulation in health care clinics: A survey. J Oper Res Soc. 1999;50(2):109-123. doi:10.1057/palgrave. jors.2600669
28. Myers RH, Montgomery DC, Anderson-Cook CM. Response surface methodology: process and product optimization using designed experiments. New York: John Wiley & Sons; 2016.
29. Khuri AI. Response surface methodology and related topics. University of Florida, USA: World Scientific; 2006.
30. Koksoy O, Doganaksoy N. Joint Optimization of Mean and Standard Deviation Using Response Surface Methods. J Qual Technol. 2003;35(3):239-252. doi:10.1080/00224065. 2003.11980218
31. Box GEP, Hunter WG, Hunter JS. Statistics for experimenters: an introduction to design, data analysis, and model building. New York: John Wiley & Sons; 1978:319.
Please cite this article as:
Baghery M, Pasha Abgarmi H, Yousefi S, Alizadeh A,