ISSN: 2008-6822 (electronic)
http://dx.doi.org/10.22075/ijnaa.2018.13447.1695
A nonlinear multiobjective model for the product
portfolio optimization: An integer programming
Nahid Dorostkar-Ahmadi, Mohsen Shafie-Nikabadi∗
Department of Industrial Management, Semnan University, Semnan, Iran
(Communicated by M. Eshaghi)
Abstract
Optimization of the product portfolio has been recognized as a critical problem in industry, manage-ment, economy and so on. It aims at the selection of an optimal mix of the products to offer in the target market. As a probability function, reliability is an essential objective of the problem which linear models often fail to evaluate it. Here, we develop a multiobjective integer nonlinear constraint model for the problem. Our model provides opportunities to consider the knowledge transferring cost and the environmental effects, as nowadays important concerns of the world, in addition to the classical factors operational cost and reliability. Also, the model is designed in a way to simultane-ously optimize the input materials and the products. Although being to some extent complicated, the model can be efficiently solved by the metaheuristic algorithms. Finally, we make some numerical experiments on a simulated test problem.
Keywords: Product portfolio optimization, Nonlinear programming, Multiobjective optimization, Reliability, Metaheuristic algorithm.
2010 MSC: Primary 90C30; Secondary 65K05.
1. Introduction
Rising competition in different market segments, rapidly changing the technologies and shortened product lifecycles made the companies and industries to offer a set of optimized products in order to meet changing the customer needs [16]. So, as an important scenario for investing, allocating resources and ensuring strategic fit on the products, portfolio management has attracted especial
∗Corresponding author
Email addresses: [email protected] (Nahid Dorostkar-Ahmadi),[email protected]
(Mohsen Shafie-Nikabadi)
attentions [16]. Companies can benefit from considering several products families, instead of opti-mizing each product separately, and offer a portfolio with product variety in order to achieve the competitive differentiation and responding increasingly requests of the customers [21]. Nevertheless, too wide products range may confuse the customers and lead to complexity which has negative effects on the profitability, costs, new products development time and customers satisfaction [21]. Hence, the suggested product portfolio should be planned carefully to address customers requirements of the target market [9].
Because of the manufacturers concerns about the high failure rates and associated losses of the product portfolios [19], product portfolio optimization has been traditionally dealt with maximization of the profit or minimization of the cost. As example, Jiao et al. [9] suggested a model with the objective of maximizing the expected value of the shared surplus of the product portfolio in the sense of simultaneously accounting the customers benefit of purchasing a product in a less price and the producers benefit of selling a product in a higher price [14]. Jiao and Zhang [10] considered customer preference and choice probabilistically to maximize value of the shared surplus. Muller [13] dealt with a value–based portfolio optimization in order to maximize profit of the generated revenue and operational cost. Seifert et al. [20] used a linear programming model to maximize the total profit of the product portfolio. Azari–Takamiet al. [2] proposed a profit maximization model for the problem by simultaneously considering both of the production and supply rates. Sadeghiet al. [18] suggested a multiobjective model in order to maximize the market share and to minimize the operational cost of the product portfolio as well. In another effort, Mangun and Thurston [12] proposed a nonlinear model to maximize the total portfolio utility with respect to the cost and reliability of the products. Also, Relich [17] developed a constraint satisfaction problem by taking into account the reliability in selecting products in the portfolio. All of the reviewed models have been efficiently solved using the metaheuristic algorithms.
As seen in the recent studies on the product portfolio optimization reviewed above, environmental effects has been ignored in the suggested models. Nowadays, considering product effects on the environment during its lifecycle is an important issue. In addition, due to the fact that knowledge is a powerful tool for the organizations to achieve competitive advantages [11], decreasing the knowledge transferring cost in the product portfolio planning should be taken care of. As another important engineering characteristic, reliability has been often disregard in recent product portfolio models. Although being a costly factor, generally reliability is a crucial element which can decrease the warranty cost and increase the customers satisfaction [5, 22]. Motivated by these, here we deal with a product portfolio optimization model in order to simultaneously consider all the four important objectives operational cost, knowledge transferring cost, environmental effects and reliability. In addition, it is worth noting that our model can be efficiently solved by metaheuristic algorithms.
The remainder of this work is organized as follows. In Section 2, after a detailed discussion on the problem specifications, we suggest a multiobjective nonlinear model for the product portfolio optimization. Using a metaheuristic algorithm, we made some numerical experiments on a simulated test problem in Section 3. Finally, concluding remarks are provided in Section 4.
2. A multiobjective nonlinear binary model for the product portfolio optimization
Here, we describe specifications, objectives and constraints of our model in details. To proceed, at first consider a manufacturing company which produces p different products P1,. . . ,Pp where each
product is a combination ofm different materialsM1,. . . ,Mm. The materialMi(i= 1, . . . , m) can be
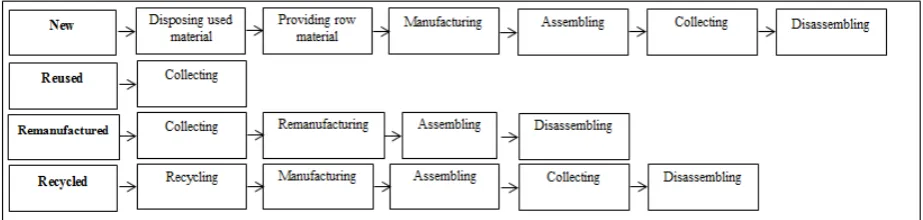
type consists of at most eight stages ‘providing the raw material’, ‘manufacturing’, ‘assembling’, ‘collecting’, ‘disassembling’, ‘remanufacturing’, ‘recycling’, and ‘disposing’, respectively indexed by
n = 1, . . . ,8. For example, if the material is of the type new, then its preparation process begins with disposing the used material, replacing as a raw material, enduring the manufacturing process and assembling, respectively; then, it should be disassembled at the end of its life. Figure 1 shows the detailed preparation process of all the four material types.
Figure 1: Preparation process of different material types
The company needs to decide which products should be included in the portfolio to achieve reasonable levels of the operational cost, knowledge transferring cost, environmental effects and reliability. So, a multiobjective approach can be employed to model the problem. Note that using the reliability function makes the model to be nonlinear. Here, we apply the Weibull distribution to determine the reliability as well [15].
To present our model, we need to consider the following two preliminary assumptions: (i) the company can meet all the market demands, and (ii) the costs of the product return is linearly added to all the materials. In what follows, we list the parameters of our multiobjective nonlinear product portfolio optimization model:
– θi : the characteristic life of the i–th material;
– h: the average time of diary usage of thej–th product; – d: the average time of annual usage of the j–th product; – bi : the slope of the Weibull distribution of the i–th material;
– K : the portfolio capacity;
– Tj : the return time of thej–th product, bounded by a positive constantT;
– B : a large positive number;
– Cni : the operational cost of the i–th material at the n–th preparation step, bounded by a positive constantCmax;
– Enni : the environmental effects of thei–th material at then–th preparation step, bounded by a positive constantEnmax;
– Re : the reliability function which is determined based on the Weibull distribution, bounded by a positive constantRemax.
In addition, we consider the following binary decision variables for our model:
ykij =
(
1, if the i–th material of thej–th product is of the typek, 0, otherwise;
yj =
(
1, if the portfolio contains the j–th product, 0, otherwise;
and define the normalized decision elements by
z1 = C Cmax
, z2 = En Enmax
, z3 = Kc Kcmax
, z4 = Re Remax
,
where, based on Figure 1, we have
C = p X j=1 m X i=1
(y1ij(C8i+ 5
X
n=1
Cni) +y2ijC4i+y3ij 6
X
n=3
Cni+y4ij(C7i+ 5
X
n=2
Cni)), (2.1)
En = p X j=1 m X i=1
(y1ij(En8i+ 5
X
n=1
Enni) +y2ijEn4i+
y3ij 6
X
n=3
Enni+y4ij(En7i+ 5
X
n=2
Enni)), (2.2)
Kc = p X j=1 m X i=1
(y1ij(Kc8i+ 5
X
n=1
Kcni) +y2ijKc4i+y3ij 6
X
n=3
Kcni+y4ij(Kc7i+ 5
X
n=2
Kcni)), (2.3)
Re = p Y j=1 m Y i=1
((y1ij+y4ij){exp−(
h×d×Tj θi
)b}+ (y2ij+y3ij){exp−(
h×d×Tj θi
)}). (2.4)
bathtub curve, the slope of the Weibull distribution is considered as 1 for reused and remanufactured materials, because they are in the useful stage and undergo minimal repair or refurbishment, while it is considered less than 1 for the new and recycled materials. Also, θi is the mean time to failure
of the i–th material.
Now, with these preliminaries we are in a position to state our product portfolio optimization model as follows:
min z = (z1, z2, z3,−z4),
s.t. m
X
i=1 4
X
k=1
ykij ≤yjB, j = 1, . . . , p, (2.5)
y1+· · ·+yp ≤K, (2.6)
y1ij+y2ij+y3ij+y4ij =yj, i= 1, . . . , m, j = 1, . . . , p, (2.7) ykij, yj,∈ {0,1}, ∀k ∀i ∀j.
Constraint (2.5) ensures that if the j–th product is not placed in the portfolio, then the cor-responding materials will not used. Also, constraint (2.6) is a capacity condition and controls the maximum number of the products that could be placed in the portfolio. In addition, constraint (2.7) limits the i–th material of the j–th product to be only one of the new, reused, remanufactured or recycled material. As a final note, we can simply choose B in the interval [4m,+∞).
Although the model seem to be to some extent complicated in the sense of illustrating an NP– hard problem, there are many studies reporting promising results of the metaheuristic algorithms for solving such problems (see [3] and the references therein). The interest in these strategies remains particularly vivid for several motivations: the high flexibility that makes it possible to reuse the soft-wares, and the good performances that allow to efficiently address some large–scale and complicated problems. Here, we employe the metaheuristic algorithm suggested in [9] to solve the problem.
3. Numerical experiments
Here, we simulate a numerical product portfolio optimization model. In this context, consider a manufacturing company which produces fifteen different products P1,. . . ,P15 where each product is
a combination of eight different materials M1,. . . ,M8. Suppose that the company determined the
practical upper bounds of the operational cost, knowledge transferring cost, environmental effects, reliability, the portfolio capacity, the return time of the products, and other necessary information, as given in Appendix 1.
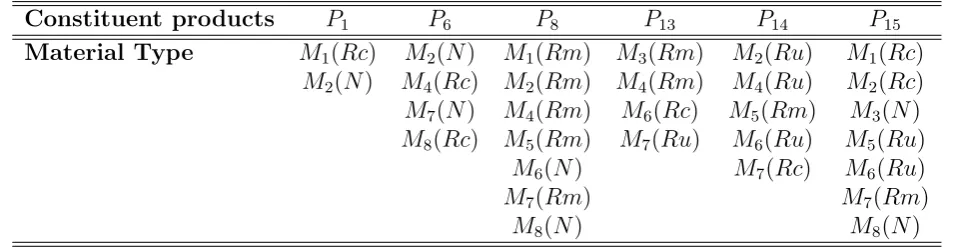
As mentioned before, the problem was solved by the metaheuristic algorithm of [9] with weighted sum scalarization of the objective function elements [4]. The generated solution has been illustrated in Table 1. As seen, six products P1, P6, P8, P13, P14 and P15 as well as their material types were
determined as the optimal products to be placed in the portfolio. More exactly, it can be observed that product P1 is made of the two materials a1 and a2 which a1 is of the type recycled and a2 is of
the type new. Similar detailed results can be stated for the other five products.
4. Conclusions and future works
Table 1: The generated solution
Constituent products P1 P6 P8 P13 P14 P15
Material Type M1(Rc) M2(N) M1(Rm) M3(Rm) M2(Ru) M1(Rc)
M2(N) M4(Rc) M2(Rm) M4(Rm) M4(Ru) M2(Rc) M7(N) M4(Rm) M6(Rc) M5(Rm) M3(N) M8(Rc) M5(Rm) M7(Ru) M6(Ru) M5(Ru)
M6(N) M7(Rc) M6(Ru)
M7(Rm) M7(Rm)
M8(N) M8(N)
sense that we have embedded the environmental effects and the knowledge transferring cost in our model, in addition to the classical factors operational cost and reliability. The model can be efficiently solved by the metaheuristic algorithms. A numerical simulation study has been also carried out.
The model can help the companies which intend to produce green products, i.e. products with the least environmental effects. Obviously, when a company only uses the new materials in the production process, extensive costs are imposed on the system. However, by entering reused, remanufactured or recycled materials in the product cycle and considering a closed–loop supply chain, company can benefit while reducing the environmental effects.
As future studies, it would be interesting to consider customer groups to suggest the portfolio of products according to their needs. Allowing uncertainty in the costs, considering the aspects of product design such as scheduling and logistics, and evaluating performance of different metaheuristic algorithms on the model are relevant issues that can be investigated as well.
Acknowledgement
The authors thank the Research Council of Semnan University for its support. They also thank the anonymous reviewer for his/her valuable comments helped to improve the quality of this work.
References
[1] K. Aoyama, T. Ugai and J. Arima,Design and evaluation a knowledge management system by using mathematical model of knowledge transfer, International Conference on Knowledge–Based and Intelligent Information and Engineering Systems. Springer, Berlin, Heidelberg, 2007.
[2] M. Azari–Takami, R. Sheikh and S. Shib–Sankar, Product portfolio optimization using teaching–learning–based optimisation algorithm: a new approach in supply chain management, Int. J. Syst. Sci.: Oper. & Logist. 3 (2016) 236–246.
[3] S. Babaie–Kafaki, R. Ghanbari and N. Mahdavi–Amiri, Hybridizations of genetic algorithms and neighborhood search metaheuristics for fuzzy bus terminal location problems. Appl. Soft Comput. 46 (2016) 220–229.
[4] M. Ehrgott, Multicriteria Optimization, Vol. 491. Springer Science & Business Media, 2005.
[5] M. Feizabadi and A.E. Jahromi, A new model for reliability optimization of series–parallel systems with non– homogeneous components, Reliab. Eng. Syst. Saf. 157 (2017) 101–112.
[6] A.M. Gillespie, Reliability & maintainability applications in logistics & supply chain, Reliability and Maintain-ability Symposium (RAMS), 2015 Annual. IEEE, 2015.
[7] D.S. Gonz´alez–Gonz´alez, R.J. Praga–Alejo and M. Cant´u–Sifuentes,Characterizations of inner product spaces by strongly convex functions, Appl. Math. Model. 40 (2016) 1387–1401.
[8] S. Jez, D. Spinelli, A. Fierro, A. Dibenedetto, M. Aresta, E. Busi and R. Basosi,Comparative life cycle assessment study on environmental impact of oil production from micro algae and terrestrial oilseed crops, Bioresource Tech. 239 (2017) 266–275.
[10] J.R. Jiao and Y. Zhang, Product portfolio planning with customer–engineering interaction, IIE Transactions 37 (2005) 801–814.
[11] C.T. Kuah, K.Y. Wong and M.K. Tiwari, Knowledge sharing assessment: an ant colony system based data envelopment analysis approach, Expert Syst. Appl., 40 (2013) 3137–3144.
[12] D. Mangun and D.L. Thurston,Incorporating component reuse, remanufacture, and recycle into product portfolio design, IEEE Transactions on Engineering Management 49 (2002) 479–490.
[13] J. Muller, Value–based portfolio optimization for software product lines, Software Product Line Conference (SPLC), 2011 15-th International. IEEE, 2011.
[14] S. M¨uller and K. Haase,On the product portfolio planning problem with customer-engineering interaction, Oper. Res. Lett. 44 (2016) 390–393.
[15] P. O’connor and A. Kleyner,Practical Reliability Engineering, John Wiley & Sons, 2012.
[16] A. Parviainen, Product Portfolio Management Requirement for Product Data Management. M.Sc. Thesis, De-partment of Industrial Engineering and Management, University of Oulu, Oulu, 2012.
[17] M. Relich, Portfolio selection of new product projects: a product reliability perspective, Eksploatacja i Nieza-wodno´s´c 18 (2016) 613–620.
[18] A. Sadeghi, A. Alem-Tabriz and M. Zandieh, Product portfolio planning: a metaheuristic–based simulated an-nealing algorithm, Int. J. Prod. Res. 49 (2011) 2327–2350.
[19] A. Sadeghi and M. Zandieh,A game theory-based model for product portfolio management in a competitive market, Expert Syst. Appl. 38 (2011) 7919–7923.
[20] R.W. Seifert, J.S. Tancrez and I. Bi¸cer, Dynamic product portfolio management with life cycle considerations, Int. J. Prod. Econom. 171 (2016) 71–83.
[21] A. Tolonen, M. Shahmarichatghieh, J. Harkonen and H. Haapasalo, Product portfolio management–targets and key performance indicators for product portfolio renewal over life cycle, Int. J. Prod. Econom. 170 (2015) 468–477. [22] Y. Wang, Y. Liu, Z. Liu and X. Li, On reliability improvement program for second-hand products sold with a
two–dimensional warranty, Reliab. Eng. Syst. Saf. 167 (2017) 452–463.
[23] Sh. J. Wu and J. Shao,Reliability analysis using the least squares method in nonlinear mixed–effect degradation models, Statist. Sinica 3 (1999) 855–877.
Appendix 1: Test Problem specifications
Table 2: Test problem data
Item Acceptable upper bounds
Operational cost (Cmax) 700 $
Environmental effects (Enmax) 800 mPt
Knowledge transferring cost (Kcmax) 150 $
Reliability (Remax) 1
Portfolio capacity (K) 7
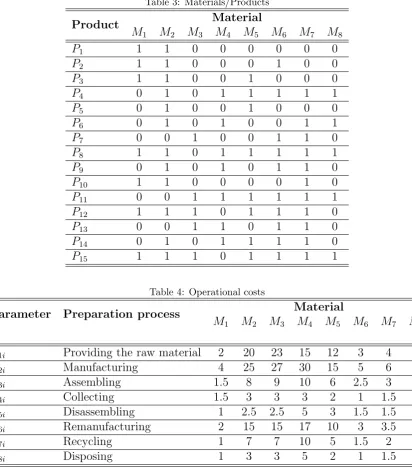
Table 3: Materials/Products
Product Material
M1 M2 M3 M4 M5 M6 M7 M8
P1 1 1 0 0 0 0 0 0
P2 1 1 0 0 0 1 0 0
P3 1 1 0 0 1 0 0 0
P4 0 1 0 1 1 1 1 1
P5 0 1 0 0 1 0 0 0
P6 0 1 0 1 0 0 1 1
P7 0 0 1 0 0 1 1 0
P8 1 1 0 1 1 1 1 1
P9 0 1 0 1 0 1 1 0
P10 1 1 0 0 0 0 1 0
P11 0 0 1 1 1 1 1 1
P12 1 1 1 0 1 1 1 0
P13 0 0 1 1 0 1 1 0
P14 0 1 0 1 1 1 1 0
P15 1 1 1 0 1 1 1 1
Table 4: Operational costs
Parameter Preparation process Material
M1 M2 M3 M4 M5 M6 M7 M8
C1i Providing the raw material 2 20 23 15 12 3 4 8
C2i Manufacturing 4 25 27 30 15 5 6 12
C3i Assembling 1.5 8 9 10 6 2.5 3 5
C4i Collecting 1.5 3 3 3 2 1 1.5 2
C5i Disassembling 1 2.5 2.5 5 3 1.5 1.5 3
C6i Remanufacturing 2 15 15 17 10 3 3.5 8
C7i Recycling 1 7 7 10 5 1.5 2 4
C8i Disposing 1 3 3 5 2 1 1.5 2
Table 5: Environmental effects
Parameter Preparation process Material
M1 M2 M3 M4 M5 M6 M7 M8
En1i Providing the raw material 8 10 10 9 10 9 9 8
En2i Manufacturing 9 18 18 17 13 10 11 13
En3i Assembling 10 12 13 10 15 13 12 15
En4i Collecting 10 12 10 15 10 12 10 12
En5i Disassembling 8 10 10 12 10 10 12 12
En6i Remanufacturing 12 13 14 18 15 16 15 18
En7i Recycling 8 10 10 12 10 12 10 12
Table 6: Knowledge transferring costs
Parameter Preparation process Material
M1 M2 M3 M4 M5 M6 M7 M8
Kc1i Providing the raw material 0.5 2 2 2 1 1 1 1
Kc2i Manufacturing 1.5 3 3.5 5 2.5 3 3 2.5
Kc3i Assembling 1 2.5 2.5 4 1.5 1.5 2 1.5
Kc4i Collecting 1 1 1 1 1 1 1 1
Kc5i Disassembling 0.25 1.5 1.5 2 1 0.5 0.5 0.5
Kc6i Remanufacturing 0.75 1.5 2 3 1 1 1.5 1
Kc7i Recycling 0.25 0.5 0.5 1 0.5 0.5 0.5 0.5
Kc8i Disposing 0.25 0.5 0.5 1 0.5 0.5 0.5 1
Table 7: Characteristic life of the materials
Material M1 M2 M3 M4 M5 M6 M7 M8
θi 20000 40000 40000 30000 16000 9000 8760 17520
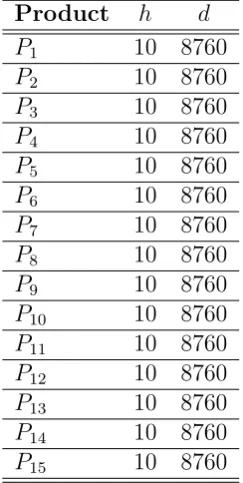
Table 8: Reliability parameters
Product h d
P1 10 8760
P2 10 8760
P3 10 8760
P4 10 8760
P5 10 8760
P6 10 8760
P7 10 8760
P8 10 8760
P9 10 8760
P10 10 8760
P11 10 8760
P12 10 8760
P13 10 8760
P14 10 8760