R E S E A R C H A R T I C L E
Open Access
Bias of health estimates obtained from
chronic disease and risk factor surveillance
systems using telephone population
surveys in Australia: results from a
representative face-to-face survey in
Australia from 2010 to 2013
Eleonora Dal Grande
1*, Catherine R. Chittleborough
2, Stefano Campostrini
3and Anne W. Taylor
1Abstract
Background:Emerging communication technologies have had an impact on population-based telephone surveys worldwide. Our objective was to examine the potential biases of health estimates in South Australia, a state of Australia, obtained via current landline telephone survey methodologies and to report on the impact of mobile-only household on household surveys.
Methods:Data from an annual multi-stage, systematic, clustered area, face-to-face population survey, Health Omnibus Survey (approximately 3000 interviews annually), included questions about telephone ownership to assess the population that were non-contactable by current telephone sampling methods (2006 to 2013). Univariable analyses (2010 to 2013) and trend analyses were conducted for sociodemographic and health indicator variables in relation to telephone status. Relative coverage biases (RCB) of two hypothetical telephone samples was undertaken by examining the prevalence estimates of health status and health risk behaviours (2010 to 2013): directory-listed numbers, consisting mainly of landline telephone numbers and a small proportion of mobile telephone numbers; and a random digit dialling (RDD) sample of landline telephone numbers which excludes mobile-only households.
Results:Telephone (landline and mobile) coverage in South Australia is very high (97 %). Mobile telephone ownership increased slightly (7.4 %), rising from 89.7 % in 2006 to 96.3 % in 2013; mobile-only households increased by 431 % over the eight year period from 5.2 % in 2006 to 27.6 % in 2013. Only half of the households have either a mobile or landline number listed in the telephone directory. There were small differences in the prevalence estimates for current asthma, arthritis, diabetes and obesity between the hypothetical telephone samples and the overall sample. However,
prevalence estimate for diabetes was slightly underestimated (RCB value of−0.077) in 2013. Mixed RCB results were
found for having a mental health condition for both telephone samples. Current smoking prevalence was lower for
both hypothetical telephone samples in absolute differences and RCB values:−0.136 to−0.191 for RDD landline
samples and−0.129 to−0.313 for directory-listed samples. (Continued on next page)
* Correspondence:eleonora.dalgrande@adelaide.edu.au
1Population Research and Outcome Studies, Discipline of Medicine, The University of Adelaide, SAHMRI, Level 7, North Terrace, Adelaide, SA 5005, Australia
Full list of author information is available at the end of the article
© 2016 Dal Grande et al.Open AccessThis article is distributed under the terms of the Creative Commons Attribution 4.0 International License (http://creativecommons.org/licenses/by/4.0/), which permits unrestricted use, distribution, and reproduction in any medium, provided you give appropriate credit to the original author(s) and the source, provide a link to the Creative Commons license, and indicate if changes were made. The Creative Commons Public Domain Dedication waiver (http://creativecommons.org/publicdomain/zero/1.0/) applies to the data made available in this article, unless otherwise stated.
Dal Grandeet al. BMC Medical Research Methodology (2016) 16:44
(Continued from previous page)
Conclusion:These findings suggest landline-based sampling frames used in Australia, when appropriately weighted, produce reliable representative estimates for some health indicators but not for all. Researchers need to be aware of their limitations and potential biased estimates.
Keywords:Bias, Telephone sampling methodology, Sampling frame, Public health surveillance, Health surveys, Chronic conditions, Risk factors
Background
Many established population-based, continuous chronic disease and behavioural risk factor surveillance systems worldwide utilise Computer Assisted Telephone
Inter-viewing (CATI) [1–9]. Since the 1990s, CATI surveys
have been seen as an ideal tool since they are effective,
relatively inexpensive, flexible and timely [6, 8–12].
However, over the past 15 years vast changes have occurred in the telecommunication industry (mobile telephone and
internet) and society’s acceptance of, and engagement with,
these new technologies [13, 14]. The new communication technologies have had an impact on population-based tele-phone surveys, specifically, the diminishing coverage of traditional sampling frames and declining response rates [11, 15] resulting in increased costs [16, 17] and potential bias in survey estimates [18, 19].
In the early 1990s, 95–97 % of Australian households
had a landline telephone connected [20] and response
rates of around 70–80 % were the norm [20–24]. For
population health surveys in Australia, two sampling methodologies were used: directory-listed telephone numbers, referred to as Electronic White Pages (EWP) and random digit dialling (RDD) of landline telephone numbers [3, 20, 22]; both methods having the ability to target geographical areas (state, suburbs or postcodes) which has contributed to the utility and efficiency of telephone surveys [25, 26]. EWP consists mainly of listed landline telephone numbers with name and address de-tails for a household or business which the sampling frame can be easily stratified by state, suburb or post-code. EWP has mobile and Voice over Internet Protocol (VOIP) telephone numbers but only as a small propor-tion of the total sample. One drawback of EWP is that it does not include unlisted (silent) telephone number; that is, households which have opted, at a cost, to exclude their landline telephone number from the EWP. RDD methods have been developed to include silent landline telephone numbers based on the prefixes of the landline telephone numbers. Some of these methods use the EWP, known as list-assisted RDD (LA-RDD), to make the sampling frame more efficient by removing blocks of numbers that have a high chance of not being connected or are assigned to large businesses [3, 27]. These RDD methods do not include mobile or VoIP telephone num-bers. Since the turn of this century, there has been a
trend of households moving away from traditional land-line telephones with the emergence of mobile-only households [11, 13, 15, 28]. This is due to increasing portability, flexibility, affordability and broadening inter-net capability of mobile telephones including smart-phones and other telecommunications, such as VoIP
[11, 15, 26, 29–32].
As a result of the increasing use of mobile telephones, conducting telephone surveys has become increasingly problematic in Australia and other countries [15, 33]. This is because of the difficulty in obtaining a representa-tive sampling frame of mobile telephones numbers since are they are rarely listed (7.3 % of mobile telephone owners in South Australia are listed [26]). Unlike the structure of landline telephone numbers, the Australian mobile numbers do not provide details of geographical lo-cation and the common methods used to generate a RDD sample of landline telephone numbers geographically are not applicable to mobile telephone numbers [34, 35]. In
2011–12, approximately 20 % of households in Australia
were mobile-only [14, 29], 34 % of USA households in 2012 were mobile-only [30] with countries in Europe
reporting 50–70 % [32]. More notably, studies have found
that mobile-only households are demographically different to traditional landline households: they are generally younger people, unrelated, never married, and socioeco-nomically disadvantaged [26, 30]. These issues suggest that by excluding mobile-only households biased estimates may be produced from chronic disease and behavioural risk factor surveillance systems.
This study presents the most up-to-date estimates available on the current status and possible sample biases of the current telephone survey methodology in South Australia, a state of Australia. Data from an annual representative face-to-face (non-telephone) population survey that included questions about telephone ownership were used to assess the population that were non-contactable by current telephone sampling methods. This included both household landline and mobile telephone ownership and listings in the telephone directory. This study will 1) explore trends of landline and mobile tele-phone ownership between 2006 and 2013; 2) describe the socio-demographic characteristics of respondents living in mobile-only households between 2010 and 2013; and 3) investigate the coverage bias of the two telephone samples
(directory-listed numbers (EWP), consisting mainly of landline telephone numbers and a small proportion of mobile and VoIP telephone numbers; and a RDD sample of landline telephone numbers which excludes mobile-only households) by examining the prevalence estimates of health status and health risk behaviours between 2010 and 2013. This is one of the few studies to assess the po-tential bias of health estimates due to coverage bias from telephone sampling frames in terms of health indicators and socio-demographics, using a unique data source with telecommunication information on people who would be excluded from the hypothetical telephone samples [26, 30]. This study uses relatively current data, which is important since telecommunications technologies have rapidly changed and evolved over the last 10 years, with increased uptake and saturation of mobile telephones and associated changes in the way people communicate [36]. Methodological studies therefore need to continually assess sample coverage and potential bias in health-related estimates [26].
Methods
Survey design and sample selection
The Health Omnibus Survey (HOS) [37, 38] is a multi-stage, systematic, clustered area sample of South Australian households where face-to-face interviews are conducted an-nually. The HOS sample includes households randomly se-lected from Australian Bureau of Statistics (ABS) collector districts (CDs) (2006 to 2012) and Statistical Areas Level 1 (SA1) (2013), from the metropolitan Adelaide area and country towns with a population of 1,000 people or more. Within each CD or SA1, a random starting point was se-lected and from this point 10 households were sese-lected in a given direction with a fixed skip interval. Hotels, motels, hospitals, hostels and other institutions were excluded from the sample. An approach letter and a brochure introducing the survey were sent to the selected household and the per-son aged 15 years or over, with the last birthday, was chosen for interview. The interviews were conducted in
people’s homes by trained interviewers. Up to six call back
visits were made to chosen households to interview the selected person. There was no replacement for non-respondents and no incentive of any kind was offered. Ap-proximately 3000 people participate annually, achieving a median response rate of 59.3 % (range: 52 to 60 %). The data are weighted by five year age groups, sex, and area (metropolitan Adelaide and rural/remote South Australia) to the most recent Census or Estimated Residential Popula-tion for South Australia and probability of selecPopula-tion within the household size to provide population estimates.
Household telecommunications ownership
Questions regarding telecommunications services in the household, specifically, landline telephone and mobile
connections, were included in the 2006 to 2013 HOS. Mobile-only households were defined if the respondent had a mobile telephone with no working landline con-nection to the household. Landline concon-nections did not include using VoIP connection or Skype for telephone calls. In addition, questions were asked regarding landlines and mobile telephones currently listed in the Australian White Pages. From these questions, household landline and mobile telecommunication status were determined by classifying the respondents as living in mobile-only house-holds; landline-only househouse-holds; landline and mobile tele-phone households; or having no landline or mobile in the household.
Socio-demographics
Demographic variables included age, sex, area of resi-dence, country of birth, household size, household struc-ture, educational attainment, marital status, gross annual household income, employment status, dwelling owner-ship or renting status (2013 only) and area-level socio-economic status. The Socio-Economic Indexes for Areas (SEIFA) Index of Relative Socio-Economic Disadvantage (IRSD) is a composite score of relative disadvantage developed by the ABS [39] for particular geographical areas, such as postcodes. It is based on selected 2011 Census socio-demographic variables. The SEIFA IRSD scores were grouped into quintiles for analysis where the highest quintile comprised postcodes with the highest SEIFA IRSD scores (most advantaged areas).
Comorbid conditions and health behaviours
Chronic conditions included self-reported medically confirmed diabetes (2010, 2011 and 2013 only), current asthma (2010 and 2011 only), arthritis and a current mental health condition. Self-reported health risk factor data included smoking status and obesity as determined by body mass index (BMI) which was derived from self-reported weight and height and recoded into four categories (underweight, normal weight, overweight and obese) [40].
Statistical analyses
Data analysis was conducted using Stata Version 12.0.
All estimates and analyses were conducted using svy
commands in Stata to incorporate the sampling design. Univariable analyses using chi-square tests compared the proportion of mobile-only households across socio-demographic variables for 2010, 2011, 2012 and 2013. Households that had no telecommunications, refused or where the status could not be determined were excluded
from the analyses (n= 39). The univariable analyses were
limited to data from 2010, since data has been previously published for earlier years [26]. Additional univariable analyses using chi-square tests were undertaken to
describe the proportion of households with a landline telephone connected; the proportion of households with mobile telephones; and the proportion of households with a directory-listed telephone number (EWP). These results can be found in Additional file 1.
To explore the possibility of coverage bias of telephone surveys, two hypothetical telephone sampling frames (subsamples) were created from HOS: 1) RDD landline, that is, households that had a landline connection (mo-bile-only households excluded); and 2) directory-listed numbers, that is, households with either a landline or mobile telephone number listed in the White Pages. Prevalence estimates of health conditions and behav-ioural risk factors were presented for the overall popula-tion, and the two hypothetical telephone samples. The hypothetical telephone samples were subsamples of the total sample (landline RDD sample is 72–78 % of the total sample and directory-listed landline sample is 50–60 % of the total sample) which means that these subsamples would have a different demographic profile to each other and the overall sample. Therefore the data for the hypothetical telephone samples were re-weighted to produce health estimates that are reflective of the South Australian population. Re-weighting is calculated by in-corporating the original relative sample weights, and by age, sex and area of residence to the most recent Census or Estimated Residential Population for South Australia.
To determine the amount of bias of the prevalence es-timates derived from the two hypothetical sampling frames, the relative coverage bias (RCB) was calculated by the following formula: NncN ⋅ðpc−pncÞ
P [41]. This formula
incorporates the proportion of the population that is not
included in the hypothetical samples (Nnc/N), that is, 1)
mobile-only households, and 2) households that do not have either a mobile or landline telephone number listed
in the telephone directory (Nnc denotes the number in
the sample that is not covered in the total sample,N). It
also includes the differences in prevalence estimate
ob-tained from the hypothetical samples, pc, and from the
sample not in the hypothetical samples, pnc, divided by
the prevalence estimate for the total population,P.
Results
Figure 1 shows the household landline and mobile tele-phone status from 2006 to 2013. Mobile teletele-phone owner-ship was consistently around 90 % during the last eight
years, rising from 89.7 % (95 % CI 88.5–90.9) in 2006 to
96.3 % (95 % CI 95.5–97.0) in 2013 (7.4 % increase). The
proportion of households that are mobile-only has in-creased by 431 % over the eight year period from 5.2 %
(95 % CI 4.4–6.0) in 2006 to 27.6 % (95 % CI 24.7–30.7) in
2013. In contrast, the proportion of landline ownership (households with landline telephone only, and households with both landline and mobile telephones) has decreased
by 24.1 % from 94.4 % (95 % CI 93.2–95.) in 2006, 87.3 %
(95 % CI 85.7–88.8) in 2009 to 71.7 % (95 % CI 68.6–74.6)
in 2013. Descriptive statistics for the participants for 2010 to 2013 are provided in Additional file 1: Table S1.
Table 1 shows the proportion of respondents living in mobile-only households by socio-demographic variables across the four years. Generally, respondents living in mobile-only household were more likely to be male, younger, of Aboriginal or Torres Strait Islander descent, born in Asia or countries other than Australia, UK,
Fig. 1Household landline and mobile telephone status, South Australia, 2006 to 2013
Table 1Proportion of respondents living in mobile only households by socio-demographic variables, 15 years and over
2010 2011 2012 2013
n % (95 % CI) p value n % (95 % CI) p value n % (95 % CI) p value n % (95 % CI) p value
Sex
Male 300 20.1 (17.5–22.9) <0.001 339 22.8 (20.4–25.4) 0.158 391 26.2 (23.4–29.2) 0.005 409 28.8 (24.6–33.3) 0.288
Female 221 14.2 (12.3–16.3) 318 20.6 (18.1–23.3) 338 21.6 (19.5–23.9) 394 26.5 (23.6–29.6)
Age (years)
15 to 24 120 23.7 (18.9–29.3) <0.001 145 28.7 (23.2–34.8) <0.001 168 34.4 (28.4–41.0) <0.001 171 36.9 (30.5–43.8) <0.001
25 to 34 189 39.8 (34.7–45.1) 226 47.9 (42.4–53.4) 225 47.6 (41.8–53.6) 254 56.6 (49.2–63.7)
35 to 44 96 18.8 (15.0–23.2) 149 29.1 (24.8–33.9) 146 28.9 (24.9–33.3) 168 35.0 (29.4–41.1)
45 to 54 66 12.5 (9.7–15.9) 69 13.3 (10.2–17.0) 95 18.0 (14.5–22.2) 110 22.1 (17.5–27.6)
55 to 64 31 7.0 (4.8–9.9) 36 8.0 (5.3–12.0) 69 14.9 (11.6–19.0) 61 13.7 (11.1–16.7)
65 to 74 10 3.2 (1.9–5.3) 25 7.6 (5.4–10.6) 20 5.5 (3.8–7.7) 29 8.3 (6.1–11.2)
75+ 7 2.9 (1.5–5.5) 6 2.6 (1.3–5.1) 7 2.8 (1.4–5.4) 10 4.3 (2.5–7.2)
Area of residence
Metropolitan 369 16.4 (14.7–18.3) 0.315 461 20.6 (18.7–22.7) 0.122 503 22.2 (20.3–24.3) 0.005 549 25.4 (22.4–28.6) 0.016
Regional 151 18.9 (14.7–23.9) 196 24.6 (20.0–29.9) 226 28.5 (24.6–32.7) 254 34.1 (27.7–41.0)
Number of people in household
1 95 23.6 (20.6–26.8) 0.001 125 29.7 (26.4–33.3) 0.001 117 28.6 (23.4–34.4) 0.064 135 36.0 (31.2–41.0) <0.001
2 267 16.7 (14.5–19.2) 352 22.5 (20.4–24.8) 397 24.9 (22.6–27.3) 433 28.6 (25.3–32.2)
3 110 19.0 (15.2–23.3) 84 16.7 (12.7–21.7) 110 20.3 (16.3–25.1) 140 27.2 (21.6–33.6)
4 or more 47 10.2 (6.6–15.6) 96 17.5 (12.8–23.4) 106 20.7 (15.9–26.5) 95 18.8 (14.9–23.4)
Country of birth
Australia 396 17.4 (15.5–19.5) <0.001 488 22.0 (19.7–24.4) <0.001 537 23.7 (21.6–26.0) <0.001 595 27.9 (24.8–31.1) 0.002
UK or Ireland 25 9.3 (6.2–13.7) 39 13.7 (10.2–18.3) 61 17.9 (14.3–22.3) 60 20.3 (14.3–28.0)
Europe 13 8.9 (5.3–14.6) 17 10.6 (6.6–16.7) 9 7.4 (3.9–13.8) 21 14.5 (10.8–19.1)
Asia 47 29.8 (21.3–39.9) 78 32.9 (25.8–40.7) 81 41.0 (31.7–50.9) 74 35.8 (24.2–49.4)
Other 39 19.9 (13.4–28.5) 34 26.4 (18.2–36.7) 41 31.7 (22.7–42.3) 53 42.4 (30.2–55.6)
Aboriginal/Torres Strait Islander
No 502 16.8 (15.0–18.7) 0.029 627 21.1 (19.2–23.1) <0.001 686 23.1 (21.3–25.0) <0.001 764 27.1 (24.3–30.0) <0.001
Yes 18 35.2 (21.9–51.2) 29 53.2 (38.6–67.3) 39 51.5 (36.1–66.5) 36 53.9 (38.4–68.8)
Household structure
Couple family children 135 12.6 (10.3–15.5) <0.001 209 18.1 (15.4–21.2) <0.001 232 21.2 (18.1–24.6) <0.001 227 21.6 (18.0–25.6) <0.001
One parent family, other 79 22.9 (18.2–28.3) 92 31.2 (25.4–37.7) 88 29.7 (24.7–35.1) 136 40.7 (35.0–46.7)
Dal
Grande
et
al.
BMC
Medical
Research
Methodology
(2016) 16:44
Page
5
of
Table 1Proportion of respondents living in mobile only households by socio-demographic variables, 15 years and over(Continued)
Lone adult person 77 21.5 (18.3–25.1) 99 26.8 (23.3–30.7) 95 26.5 (21.7–31.9) 99 31.2 (26.6–36.3)
Couple with no children 89 11.3 (9.0–14.1) 126 15.7 (13.2–18.6) 145 16.9 (14.3–19.9) 138 19.5 (16.7–22.6)
Other 139 28.8 (23.7–34.5) 131 31.6 (26.1–37.6) 169 37.7 (31.5–44.4) 203 40.7 (34.5–47.2)
Marital status
Married/defacto 253 13.3 (11.5–15.3) <0.001 335 17.9 (15.8–20.2) <0.001 390 20.5 (18.2–22.9) <0.001 417 23.3 (20.1–26.8) <0.001
Separated/Divorced 46 21.4 (17.2–26.3) 75 30.5 (25.5–36.0) 88 33.6 (28.4–39.2) 91 34.4 (30.0–39.1)
Widowed 9 5.1 (2.9–8.7) 12 7.6 (4.8–12.0) 14 8.1 (5.3–12.1) 16 11.7 (8.3–16.4)
Never married 207 28.1 (24.1–32.5) 233 31.0 (26.8–35.7) 237 33.4 (28.9–38.3) 279 38.9 (33.9–44.1)
Educational attainment
Secondary schooling 212 15.3 (13.0–17.9) 0.128 268 21.5 (18.4–25.0) 0.819 292 23.3 (20.3–26.7) 0.702 329 27.7 (23.3–32.6) 0.745
Trade, certificate, diploma 192 18.7 (16.2–21.5) 246 21.2 (18.7–23.8) 272 24.3 (21.6–27.3) 293 27.6 (24.2–31.2)
Bachelor degree or higher 115 18.3 (15.3–21.8) 141 22.9 (19.4–26.8) 165 24.2 (20.7–28.1) 181 27.7 (23.4–32.5)
Gross annual household income
Up to $20,000 45 16.0 (11.4–22.0) 0.073 47 17.3 (13.3–22.2) 0.042 58 24.4 (19.7–29.7) 0.25 53 30.3 (23.9–37.4) 0.005
$20,001–$40,000 71 17.3 (13.7–21.5) 80 20.0 (16.0–24.7) 87 25.2 (20.7–30.4) 80 21.6 (16.6–27.6)
$40,001–$80,000 114 18.8 (15.4–22.7) 157 26.5 (22.8–30.7) 161 27.6 (23.8–31.8) 189 33.6 (28.9–38.5)
$80,001–$120,000 106 21.0 (17.2–25.5) 117 24.3 (20.1–29.1) 99 24.0 (19.6–29.0) 126 28.8 (23.9–34.3)
$120,001 or more 57 13.1 (9.8–17.1) 86 19.1 (15.1–23.8) 115 21.7 (17.8–26.1) 151 25.9 (21.6–30.7)
Not stated 128 15.8 (12.9–19.1) 169 20.3 (16.2–25.2) 210 22.1 (18.7–25.8) 203 26.1 (22.2–30.5)
Employment status
Fulltime employed 248 21.9 (19.1–25.1) <0.001 315 26.9 (24.0–30.1) <0.001 309 27.7 (24.7–31.0) <0.001 371 36.2 (30.9–41.9) <0.001
Parttime employed 108 18.4 (14.6–22.9) 128 22.0 (18.2–26.2) 135 24.5 (20.5–28.9) 157 26.5 (22.2–31.3)
Home Duties 46 22.8 (17.5–29.3) 55 32.7 (25.4–40.9) 58 27.6 (21.8–34.3) 55 34.4 (27.1–42.6)
Unemployed 23 35.8 (23.7–50.2) 32 35.2 (24.1–48.1) 51 57.7 (45.4–69.2) 40 42.0 (28.4–56.8)
Retired 20 3.2 (2.1–4.9) 35 5.7 (4.1–7.9) 36 5.9 (4.4–7.7) 44 7.5 (5.5–10.2)
Student 43 14.7 (10.2–20.7) 51 21.1 (14.3–29.9) 98 29.7 (23.0–37.3) 81 29.2 (23.3–36.0)
Other/not working due to health 32 20.0 (13.0–29.5) 38 23.4 (18.1–29.7) 41 28.8 (21.6–37.2) 53 32.6 (25.1–41.2)
SEIFA IRSD quintile
Lowest (most disadvantaged) 160 22.3 (18.1–27.1) 0.003 197 27.3 (23.4–31.5) <0.001 227 30.3 (26.6–34.3) <0.001 229 34.6 (28.1–41.7) 0.004
Low 86 17.8 (14.9–21.1) 179 29.3 (24.5–34.6) 137 26.8 (22.2–32.0) 186 31.0 (25.8–36.8)
Middle 106 17.0 (13.5–21.3) 110 20.6 (16.8–25.0) 139 25.2 (21.2–29.6) 142 28.0 (21.8–35.1)
High 84 15.1 (11.8–19.1) 81 15.7 (12.7–19.3) 110 19.8 (16.2–24.0) 120 22.2 (16.8–28.7)
Dal
Grande
et
al.
BMC
Medical
Research
Methodology
(2016) 16:44
Page
6
of
Table 1Proportion of respondents living in mobile only households by socio-demographic variables, 15 years and over(Continued)
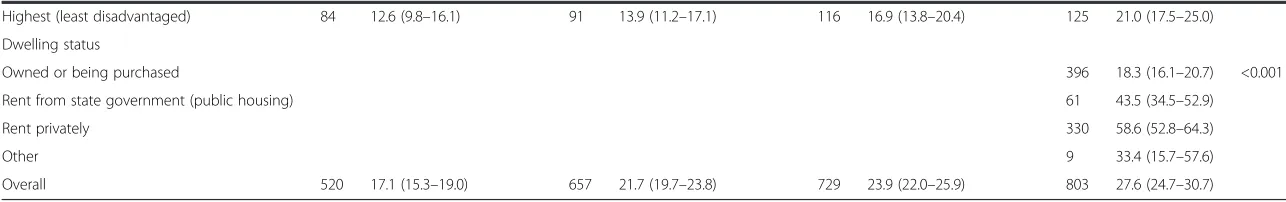
Highest (least disadvantaged) 84 12.6 (9.8–16.1) 91 13.9 (11.2–17.1) 116 16.9 (13.8–20.4) 125 21.0 (17.5–25.0)
Dwelling status
Owned or being purchased 396 18.3 (16.1–20.7) <0.001
Rent from state government (public housing) 61 43.5 (34.5–52.9)
Rent privately 330 58.6 (52.8–64.3)
Other 9 33.4 (15.7–57.6)
Overall 520 17.1 (15.3–19.0) 657 21.7 (19.7–23.8) 729 23.9 (22.0–25.9) 803 27.6 (24.7–30.7)
Dal
Grande
et
al.
BMC
Medical
Research
Methodology
(2016) 16:44
Page
7
of
Ireland or Europe, never married, or separated or di-vorced, unemployed, fulltime employed, or home duties, renting privately or from the government, and to reside in the most disadvantaged areas. Largest percentage in-creases over the four years occurred amongst females (86.6 %), people in the older age groups (86.2–159.4 %), people living in rural areas of South Australia (80.4 %), people born in the United Kingdom or Ireland (118.3 %), people living in single parent households or shared-care parenting households (77.7 %), or couples with no children (72.6 %), widowed (131.4 %), married or in a defacto relationship (75.2 %), people with at least secondary schooling (81.0 %), people living in house-holds on low income levels (89.4 %) or very high income levels (97.7 %), and people who are retired (134.4 %) or who are currently students (98.6 %).
Additional file 1: Tables S2 and S3 show the propor-tion of respondents living in a household with a landline connection and the proportion of respondents living a household with at least one mobile telephone by socio-demographic variables for 2010 to 2013. The proportion of respondents living in households with directory-listed mobile or landline telephone (EWP) has been steadily decreasing from 73.8 % (95 % CI 72.2–75.4) in 2006, to 60.4 % (95 % CI 58.1–62.7) in 2010 and 49.6 % (95 % CI
46.2–53.0) in 2013. This proportion by
socio-demographic characteristics for 2010 to 2013 is listed in Additional file 1: Table S4. In 2013, 4.6 % (95 % CI 3.8– 5.5) of mobile numbers were listed in the telephone dir-ectory compared to 62.7 % (95 % CI 59.2–66.1) of landlines.
The prevalence estimates of various health conditions and behavioural risk factors for all households, for people who live in households with a landline connec-tion (hypothetical landline RDD sample) and for people who live in a household with a directory-listed landline or mobile telephone number (hypothetical directory-listed sample) are shown in Table 2. The RCB for the prevalence estimates derived from the two hypothetical samples are also in Table 2. There were small absolute differences in the prevalence estimates for current asthma, arthritis and obesity between the hypothetical telephone samples and the overall sample. The preva-lence estimates for diabetes by the two hypothetical samples did not differ in 2010 and 2011, however, the prevalence estimate was slightly underestimated (RCB
value of −0.077) in 2013 for the directory-listed
sam-ple. Even though the prevalence estimates for arthritis were similar for both hypothetical samples, the preva-lence estimate for arthritis in 2010 was underesti-mated for the directory-listed sample (RCB value of
−0.083) compared to the overall sample (prevalence
of 20.7 vs. 21.4 %). The prevalence of having a mental health condition showed mixed results for both
hypothetical samples and over time: the prevalence of having a mental health condition was underestimated for both samples with estimates from the
directory-listed sample having larger RCB (ranging from −0.102
to −0.242) with the exception of 2011, which had the
opposite result of overestimating mental health condi-tions (RCB value of 0.056). Current smoking preva-lence was lower for both hypothetical telephone samples with absolute differences ranging from 2.9 to 3.4 percentage points for RDD landline samples and 3.3 to 5.3 percentage points for directory-listed
sam-ples, and associated large RCB values: −0.136 to
−0.191 for RDD landline samples and −0.129 to
−0.313 for directory-listed samples.
Discussion
This paper presents estimates and trends of telephone coverage in Australia from 2006 to 2013. Continual as-sessment of methodological issues around conducting population health telephone surveys is essential due to the rapid technological changes in telecommunications
and the different‘user culture’associated in use of these
new and old telecommunication technologies. Even though telephone (landline and mobile) coverage in South Australia is very high (97 %), nearly a third of households are mobile-only (27.8 %) and only half of the households (49.0 %) have either a mobile or landline number listed in the White Pages telephone directory. Our results show that mobile-only respondents are dif-ferent across a range of socio-demographic indicators, which is similar to international studies [13, 15, 30]. Using hypothetical sampling frames (RDD landline and EWP directory listing) that were weighted to the age and sex structure of the South Australian population pro-duced contradictory results for health prevalence esti-mates when compared to all households in the face-to-face survey. Prevalence estimates of diabetes, current asthma, arthritis and obesity had very minor differences and biases, but the prevalence estimates for mental health condition and current smoking indicates biases using either RDD landline or EWP directory listing sam-pling frame. Even though our results show that mobile-only respondents are demographically different across a range of socio-demographic indicators, appropriately weighted data can produce reliable prevalence estimates for some health indicators, but not for others. These findings suggest landline-based sampling frames used in Australia are potentially biased for some health indica-tors, such as current smokers and having a mental health condition, particularly where conditions or risk factors are higher amongst those living in mobile-only households. Researchers using either RDD or directory-listing landline sampling frames need to be aware of their limitations and know of the potential biased
Table 2Prevalence of health conditions and risk factors for all households, and for landline Random Digit Dialling (RDD) and Directory-listed (EWP) telephone samples, 15 years and over
2010 2011 2012 2013
n % (95 % CI) RCB n % (95 % CI) RCB n % (95 % CI) RCB n % (95 % CI) RCB
Health conditions
Diabetes All households 229 7.5 (6.6–8.5) 246 8.1 (7.1–9.2) 247 8.5 (7.6–9.5)
Landline (RDD) sample 181 7.2 (6.2–8.3) –0.009 195 8.3 (7.1–9.6) 0.003 173 8.3 (7.4–9.4) −0.033
Directory-listed sample 133 7.1 (6.0–8.5) −0.021 148 8.6 (7.1–10.3) 0.030 117 7.9 (6.7–9.4) −0.077
Current asthma All households 416 13.6 (12.2–15.3) 384 12.7 (11.4–14.0)
Landline (RDD) sample 335 13.3 (11.7–15.2) −0.015 297 12.6 (11.1–14.2) −0.002
Directory-listed sample 246 13.1 (11.3–15.2) −0.061 220 12.8 (10.9–15.0) −0.014
Arthritis All households 653 21.4 (19.9–23.1) 727 24.0 (22.3–25.7) 656 21.5 (19.7–23.3) 640 22.0 (20.3–23.8)
Landline (RDD) sample 529 21.1 (19.5–22.8) −0.025 554 23.5 (21.6–25.4) −0.031 495 21.2 (19.3–23.2) 0.009 464 22.3 (20.4–24.4) 0.019
Directory-listed sample 387 20.7 (18.9–22.6) −0.083 407 23.7 (21.4–26.1) −0.018 346 20.7 (18.5–23.2) −0.046 324 22.0 (19.7–24.4) −0.016
Mental health condition All households 330 10.8 (9.6–12.2) 359 11.8 (10.7–13.1) 297 9.7 (8.7–10.8) 384 13.2 (11.8–14.7)
Landline (RDD) sample 250 10.0 (8.6–11.5) −0.100 275 11.6 (10.3–13.1) −0.046 222 9.5 (8.2–10.9) −0.025 256 12.3 (10.7–14.1) −0.091
Directory-listed sample 167 8.9 (7.4–10.7) −0.242 221 12.9 (11.0–15.0) 0.056 150 9.0 (7.6–10.6) −0.102 172 11.6 (9.4–14.3) −0.141
Health - related risk factors
Current smoker All households 614 20.2 (18.3–22.1) 529 17.4 (15.8–19.2) 501 16.4 (14.8–18.2) 552 19.0 (16.6–21.6)
Landline (RDD) sample 429 17.1 (15.2–19.2) −0.136 343 14.5 (12.8–16.5) −0.191 304 13.0 (11.4–14.9) −0.174 330 15.9 (13.6–18.6) −0.138
Directory-listed sample 316 16.9 (14.7–19.3) −0.129 223 13.0 (10.9–15.4) −0.313 210 12.6 (10.8–14.7) −0.181 202 13.7 (11.6–16.1) −0.244
Obese All households 611 22.1 (20.4–24.0) 612 22.7 (20.9–24.6) 621 23.4 (21.5–25.4) 603 23.1 (20.7–25.8)
Landline (RDD) sample 511 22.6 (20.7–24.6) 0.036 491 23.3 (21.2–25.5) 0.013 474 23.5 (21.4–25.8) −0.020 454 24.3 (21.8–27.0) 0.078
Directory-listed sample 379 22.5 (20.3–25.0) −0.002 359 23.8 (21.2–26.6) 0.059 329 22.7 (20.1–25.5) −0.050 329 24.6 (21.6–27.9) 0.079
Note:RCBrelative coverage bias,Landline (RDD) samplehouseholds that had a landline connection (mobile-only households excluded);Directory-listed samplehouseholds with either a landline or mobile telephone
number listed in the White Pages
Dal
Grande
et
al.
BMC
Medical
Research
Methodology
(2016) 16:44
Page
9
of
estimates because of the groups that are excluded from the sampling frames.
This study is important because it quantifies the po-tential biases from the various landline-based telephone sampling frames used in Australia and the groups that are potentially excluded. Even though the data are limited to South Australia, the conclusions may be generalizable to the Australian population. This study is unique since the same questions have been asked annually for eight years and, using the face-to-face methodology in which all types of households are included (mobile-only, landline-only or both), it had the ability to examine, over time, the prevalence estimates of various health indicators by tele-phone status. Very few studies like this are known to exist nationally [14] and internationally [15, 30] and even fewer examine the assessment on health indicators [30].
The trends and demographic differences found in this study are similar to national and international studies [11, 14, 15, 30, 42, 43] and support findings from our previous research [26]. Our estimate of mobile-only households in 2012 (23.9 %) was higher than the esti-mate reported by the Australian Communication and Media Authority (19 %) [14]; the proportion of house-holds with a landline telephone in 2010 was 82.5 % which was slightly higher than the 80.3 % estimate from the 2010–11 Australian Health Survey (AHS); and our estimate of 68.7 % of landline telephone numbers listed in the telephone directory was slightly lower than the 70.1 % from the AHS 2010–11 survey [44]. Between 2006 and 2008 the trend of mobile-only households remained low, however since 2009, the trend has steadily increased, following international patterns [30]. Similarly for landline ownership, up to 2011 the proportion was over 80 %, however, this has steadily decreased to 71.9 % in 2013. These changes are mainly due to the increasing popularity of greater flexibility and affordability offered by mobile technology. People are using landlines less fre-quently because they are able to have a single device with multiple communication and media services, which is less expensive than having a landline connection [13].
In our previous study [26], nearly 10 % of the popula-tion in 2008 lived in mobile-only households, and we showed that with appropriate weighting, the sampling methodology used for telephone surveys produced reli-able health estimates with the exception of smoking prevalence in South Australia being underestimated. In contrast, with more recent data and up-to-date analyses, this study has estimated that close to 30 % of the Australian population now live in mobile-only households and these analyses have demonstrated the impact of the vast changes in the telecommunication over the eight year study period on the coverage of the sampling frames. Excluding a distinct subpopulation from the landline sampling frames, namely mobile-only households, resulted in under- or
over-estimation in some health estimates, although with appropriate weighting most health estimates (except smok-ing and mental health) were very similar to the overall population. Even though the results in the health estimates (absolute differences and RCB values) between the overall population and the two hypothetical landline sample groups showed no clear pattern over time, the results do highlight that for specific health indicators, such as current smokers and mental health, the direction of the bias was consistently under-estimated for both RDD and directory-listed landline hypothetical samples. The other conditions (diabetes, current asthma, arthritis and obesity) had little absolute differences in health estimates and an inconsistent pattern, but relatively low, RCB values over time, which may suggest that the differences could be due to the random nature of the sample or other sampling errors. Our findings for current smokers, asthma and obesity are similar to other USA studies [30] using similar methodology, and are consistent with studies using dual-frame telephone surveys for mental health [45], current smoking [30, 46, 47], asthma [47], and obesity [30]. This suggests that perhaps an alternative sam-pling, surveying or statistical methodological approach may need to be considered to include groups of the population to remove the coverage biases in landline-based sampling frames.
Many studies have explored various methods to in-clude the mobile-only group into chronic disease and risk factor surveillance systems [12, 48]. The favoured method is an over-lapping dual-frame design which in-volves two independent samples: a sample of mobile telephones and a landline-based sample [34, 35, 46, 49]. These studies showed an improvement in the represen-tativeness, in particular for men, the younger and middle age groups, and people who were never married. How-ever, obtaining a sample of mobile telephone numbers does have drawbacks, including low response rates and two to four times the costs of landline-based samples [34]. More importantly, the mobile sample that is cur-rently available and used in Australia is of randomly gen-erated mobile telephone numbers with no geographical marker. From a South Australian perspective, only 8 % of all mobile telephone numbers in Australia were estimated to be owned by South Australians [34, 35, 46, 49], which
is almost the same proportion of the state’s population
(7.4 %). This means a much larger initial sample is re-quired for screening, and with the additional problem of low response rate, the feasibility of including mobile num-bers using these methods in a chronic disease and behav-ioural risk factor surveillance system in South Australia would be costly. Even though 98 % of South Australians have a mobile telephone and it is perceived that people can be reached anytime, it does not mean that they are willing or able to use it to complete a survey. Receiving
mobile telephone calls can happen at unpredictable mo-ments when it is not suitable for the owner to respond, such as driving (safety issue), travelling overseas (which can incur a large cost to the researcher or participant), or during a meeting or in a restaurant (privacy issue); all have an impact on response rates [43].
Mixed-mode methods have also been suggested as a way to complement the traditional landline telephone survey by combining face-to-face, mail, and internet sur-veys [50]. These alternative modes introduce other meth-odological issues and the design of each mode need to be taken into consideration. The questionnaire design for CATI surveys, for example, complicated skips patterns or data range checks, needs to be careful considered in other modes such as mail survey [51]. Face-to-face, mail and internet survey can have the option of longer worded questions, explanations, and visual or prompt cards which is not recommended or possible with CATI surveys. Therefore, the wording of the questions in telephone sur-veys needs to be clear, concise and short [52]. Operational differences can have an impact on how the questions are answered. Telephone surveys are mainly interviewer administered whereas mail or internet surveys are self-administered which can lead to different responses [50, 51]. In telephone surveys, the interviewer has control over who is the selected respondent within the household whereby in the mail or internet surveys any member of the household determines who is the selected [12]. The level of privacy can vary by survey modes which is high with mail or internet surveys compared to moderate level of privacy with telephone (others listening in, or answer-ing sensitive questions) [53]. Mail surveys require a longer data collection period compared to the allocated time period for telephone surveys. In an attempt to include respondents from mobile-only households, a study exam-ined the possibly of using two modes, telephone and mail, with a single database that consisted of residential ad-dresses. However, they found that the groups that were represented in telephone surveys were also under-represented in the mail surveys [48]. Another consider-ation for surveillance systems that used the telephone to collect data, is the challenge of how to incorporate alter-native modes but still maintain the timeliness, flexibility, low non-response and low cost of the system [12]. Other methodological studies have used statistical approaches such as alternative weighting strategies, such as raked weights, which incorporate a wider range of socio-demographic variables, can improve the health estimates
and are more in line with face-to-face surveys [54–56].
The study design used in this research is robust due to the large representative state-wide samples used and is unique in that the data were collected over eight years using the same or similar questions, and by one organ-isation, thus minimising interviewer biases. These data
are also very recent and it is one of the few face-to-face studies conducted in Australia and worldwide that in-cluded questions on landline and mobile telephone status that also had questions on health status and behavioural risk factors [30] so the biases in health estimates can be assessed. However the results could be biased due to the moderately acceptable response rates (median = 59.3 %) which is following the trends observed interstate and overseas. This study only analysed a few health-related variables and additional questions such as health service usage, quality-of-life or alcohol consumption would have provided a more comprehensive description of telephone sampling biases.
Conclusion
Telephone surveys have become a standard and ac-cepted method of collecting health information in Australia and are widely used to monitor chronic disease and behavioural risk factors. Such surveillance systems provide evidence to inform interventions and service planning with the aim of reducing the impact of chronic diseases and their associated costs to the health system. Analyses like those presented here are important to demonstrate that the health estimates obtained are not biased due to sampling methodology. This study has shown that the proportion of mobile-only households is increasing and this does not appear to have reached a plateau. This corresponds with the decrease in landline telephone coverage. Even with appropriately weighted data, using landline-based sampling frames in Australia are potentially biased for some health indicators. This implies that the landline sampling frames that are cur-rently used in most Australian chronic disease and risk factor surveillance systems (RDD landline or directory-listed telephone numbers) are not sufficient on their own because of the exclusion of the mobile-only house-holds. Other methodologies need to be considered for small states like South Australia that are timely, cost-effective and efficient.
Availability of data and materials
The Health Omnibus Survey (HOS) is a user-pay survey in which various organisations pay for their questions to be included in the surveys. Because of this, the authors of this study do not own all of the HOS data and per-mission had to be sought from each owner, therefore data are not publicly available.
Ethical statement
Ethical approvals were obtained from the Research Eth-ics Committees of The University of Adelaide and the South Australian Department of Health. Participation in the study is voluntary. Verbal informed consent was ob-tained from participants at the start of the interview.
Prior to contact by the interviewers, a primary approach letter was sent to the household informing the house-hold of the purpose of the survey including a pamphlet listing the organisations involved in the survey, confi-dentiality and privacy assurance, that participation is voluntary, and a contact number for queries. Upon initial contact, the interviewers repeat the purpose of the survey as well as the expected length of time to complete the interview.
Consent for publication
Not applicable.
Additional file
Additional file 1: Table S1.Sample socio-demographic profile by sur-vey year, 15 years and over.Table S2.Proportion of respondents living in households with a landline connection (RDD) by socio-demographic vari-ables, 15 years and over.Table S3.Proportion of respondents living in households with at least one mobile telephone by socio-demographic variables, 15 years and over.Table S4.Proportion of respondents living in households with a directory-listed telephone number (EWP) by socio-demographic variables, 15 years and over. (DOCX 107 kb)
Abbreviations
ABS:Australian Bureau of Statistics; BMI: body mass index; CATI: computer assisted telephone interviewing; CD: collector districts; EWP: electronic white pages; HOS: Health Omnibus Survey; IRSD: index of relative social
disadvantage; RCB: relative coverage bias; RDD: random digit dialling; SA1: Statistical Areas Level 1; SEIFA: Socio-Economic Indexes for Areas; SPSS: Statistical Package for Social Sciences; VoIP: Voice over Internet Protocol.
Competing interests
The authors declare that they have no competing interests.
Authors’contributions
EDG Participated in the design and co-ordination of the study, performed statistical analyses, and drafted and revised the manuscript. CRC, AWT, SC Participated in the design and co-ordination of the study, advised on ana-lyses, and were involved in the drafting and revising of the manuscript. All authors read and approved the final manuscript.
Acknowledgments
With thanks to Julie Black, CEO, Arthritis SA, for the arthritis data; Prof Anne Taylor, The University of Adelaide, for the diabetes and obesity data, Professor Richard Ruffin and Professor Robert Adams, The Queen Elizabeth Hospital and The University of Adelaide for the asthma data, and Tobacco Control Research and Evaluation Program, South Australian Health and Medical Research Institute for the smoking and mental health data.
Funding
Not applicable.
Author details
1
Population Research and Outcome Studies, Discipline of Medicine, The University of Adelaide, SAHMRI, Level 7, North Terrace, Adelaide, SA 5005, Australia.2School of Public Health, The University of Adelaide, Adelaide, Australia.3University Ca’Foscari, Venice, Italy.
Received: 9 December 2015 Accepted: 8 April 2016
References
1. McQueen DV, Puska P. Global behavioral risk factor surveillance. Berlin: Springer; 2003.
2. Taylor AW, Dal Grande E. Chronic disease and risk factor surveillance using the SA Monitoring and Surveillance System (SAMSS)–history, results and future challenges. Public Health Bulletin. 2008;5(3):17–21.
3. NSW Population Health Survey Methods - 2012 update [http://www.health. nsw.gov.au/surveys/other/Documents/population-health-surveys-methods-2012.pdf] Accessed 24 Aug 2014.
4. The WA Health and Wellbeing Surveillance System (WAHWSS), Design and Methodology, Technical Paper No 1 Version 2 [http://ww2.health.wa.gov. au/~/media/Files/Corporate/Reports%20and%20publications/
Population%20surveys/2003-Technical-paperno1-Design-and-Methodology. ashx] 15 Apr 2016.
5. Behavioral Risk Factor Surveillance System. 2010 Summary Data Quality Report. In: BRFSS 2010 Survey Data and Documentation. Atlanta: Centers for Disease of Control and Prevention; 2011.
6. Bingle CL, Holowaty PH, Koren IE, Picard L, Steward PJ, Feltis SL. An evaluation of the Ontario Rapid Risk Factor Surveillance System. Can J Public Health. 2005;96(2):145–50.
7. Baldissera S, Campostrini S, Binkin N, Minardi V, Minelli G, Ferrante G, Salmaso S. Features and initial assessment of the Italian Behavioral Risk Factor Surveillance System (PASSI), 2007–2008. Prev Chronic Dis. 2011; 8(1):A24.
8. Campostrini S, McQueen D, Taylor A, Daly A. World Alliance for Risk Factor Surveillance White Paper on Surveillance and Health Promotion. AIMS Public Health. 2015;2(1):10–26.
9. Choi BCK, Pak AWP, Ottoson JM. Understanding the basic concepts of public health surveillance [Speaker's Corner]. J Epidemiol Community Health. 2002;56(6):402.
10. Taylor AW, Campostrini S, Gill TK, Carter P, Dal Grande E, Herriot M. The use of chronic disease risk factor surveillance systems for evidence-based decision-making: physical activity and nutrition as examples. Int J Public Health. 2010;55(4):243–9.
11. Lepkowski JM, Tucker C, Brick JM, Leeuw EDD, Japec L, Lavrakas PJ, Link MW, Sangster RL. Advances in Telephone Survey Methodology. Hoboken: Wiley; 2008.
12. Mokdad AH. The Behavioral Risk Factors Surveillance System: Past, Present, and Future. Annu Rev Public Health. 2009;30(1):43–54.
13. Australian Communications and Media Authority. Communications Report 2009–10 Series. Report 2 - Take-up and use of voice services by Australian consumers. In: Corporate Publications. Melbourne: Commonwealth of Australia; 2010.
14. Australian Communications and Media Authority. Communications report 2011– 12. In: Corporate Publications. Melbourne: Commonwealth of Australia; 2013. 15. Häder M, Häder S, Kühne M. Telephone Surveys in Europe. Research and
Practice. Heidelberg: Springer; 2012.
16. Brick JM. The Future of Survey Sampling. Public Opin Q. 2011;75(5):872–88. 17. Kempf AM, Remington PL. New Challenges for Telephone Survey Research
in the Twenty-First Century. Annu Rev Public Health. 2007;28(1):113–26. 18. Groves RM. Nonresponse rates and nonresponse bias in household surveys.
Public Opin Q. 2006;70(5):646–75.
19. Peytchev A. Consequences of Survey Nonresponse. ANNALS Am Acad Pol Soc Sci. 2013;645(1):88–111.
20. Dal Grande E, Taylor AW, Wilson DH. Is there a difference in health estimates between people with listed and unlisted telephone numbers? Aust N Z J Public Health. 2005;29(5):448–56.
21. Taylor AW, Wilson DH, Wakefield M. Differences in health estimates using telephone and door-to-door survey methods–a hypothetical exercise. Aust N Z J Public Health. 1998;22(2):223–6.
22. Wilson DH, Starr GJ, Taylor AW, Dal Grande E. Random digit dialling and Electronic White Pages samples compared: demographic profiles and health estimates. Aust N Z J Public Health. 1999;23(6):627–33.
23. Australian Bureau of Statistics. Household Telephone Connections, Australia, August 1991. In: Catalogue of Publications, vol. 4110.0. Canberra: Commonwealth of Australia; 1991.
24. Steel D, Vella J, Harrington P. Quality issues in telephone surveys: coverage, non-response and quota sampling. Aust J Stat. 1996;38(1):15–34. 25. Guterbock TM, Diop A, Ellis JM, Holmes JL, Le KT. Who needs RDD?
Combining directory listings with cell phone exchanges for an alternative telephone sampling frame. Soc Sci Res. 2011;40(3):860–72.
26. Dal Grande E, Taylor AW. Sampling and coverage issues of telephone surveys used for collecting health information in Australia: results from a face-to-face survey from 1999 to 2008. BMC Med Res Methodol. 2010;10:77.
27. Liu B, Brotherton J, Shellard D, Donovan B, Saville M, Kaldor J. Mobile phones are a viable option for surveying young Australian women: a comparison of two telephone survey methods. BMC Med Res Methodol. 2011;11(1):159.
28. Blumberg SJ, Luke JV. Coverage Bias in Traditional Telephone Surveys of Low-Income and Young Adults. Public Opin Q. 2007;71(5):734–49. 29. Dal Grande E, Taylor AW, Fullerton SP, Chittleborough CR, Campostrini S.
Can telephone surveys be used for collecting health information in Australia? Adelaide: Population Health Congress; 2012.
30. Blumberg SJ, Luke JV. Wireless substitution: early release of estimates from the National Health Interview Survey, January-June 2012. In: The National Health Interview Survey Early Release Program. Atlanta: National Center for Health Statistics; 2012. p. 2012.
31. Tucker C, Brick JM, Meekins B. Household Telephone Service and Usage Patterns in the United states in 2004: Implications for Telephone Samples. Public Opin Q. 2007;71(1):3–22.
32. Mohorko A, de Leeuw E, Hox J. Coverage bias in European telephone surveys: developments of landline and mobile phone coverage across countries and over time. In: Survey Methods: Insights from the Field. 2013. 33. Kuusela V, Simpanen M. Spotlights on selected European countries, Finland.
In: Häder M, Häder S, Kühne M, editors. Telephone Surveys in Europe: Research and Practice. Heidelberg: Springer; 2012. p. 37–45. 34. Barr ML, van Ritten J, Steel D, Thackway S. Inclusion of mobile phone
numbers into an ongoing population health survey in New South Wales, Australia: design, methods, call outcomes, costs and sample
representativeness. BMC Med Res Methodol. 2012;12(1):177. 35. Hu SS, Balluz L, Battaglia MP, Frankel MR. Improving Public Health
Surveillance Using a Dual-Frame Survey of Landline and Cell Phone Numbers. Am J Epidemiol. 2011;173(6):703–11.
36. Australian Communications and Media Authority. Six emeriging trends in media and communications. Occasional paper. In: Corporate Publication. Commonwealth of Australia: Melbourne; 2014.
37. Taylor AW, Dal Grande E, Wilson DH. The South Australian Health Omnibus Survey 15 years on: has public health benefited? Public Health Bulletin. 2006;3(1):30–2.
38. Wilson DH, Wakefield M, Taylor AW. The South Australian Health Omnibus Survey. Health Promot J Austr. 1992;2:47–9.
39. Australian Bureau of Statistics. Socio-Economic Indexes for Areas (SEIFA), 2011. In: Technical Paper. Canberra: Commonwealth of Australia; 2013. 40. World Health Organization (WHO). Obesity: Preventing and managing the
global epidemic. Geneva: WHO; 2000.
41. Fuchs M, Busse B. The coverage bias of mobile web surveys across European countries. Int J Internet Sci. 2009;4(1):21–33.
42. Keeter S, Kennedy C, Clark A, Tompson T, Mokrzycki M. What's Missing from National Landline RDD Surveys?: The Impact of the Growing Cell-Only Population. Public Opin Q. 2007;71(5):772–92.
43. Kuusela V, Callegaro M, Vehovar V. The influence of mobile telephones on telephone surveys. In: Lepkowski JM, Tucker C, Brick JM, de Leeuw ED, Japec L, Lavrakas PJ, Link MW, Sangster RL, editors. Advances in Telephone Survey Methodology. Hoboken: Wiley; 2008. p. 87–112.
44. Australian Bureau of Statistics. 2011, Census, TableBuilder Pro. Canberra: Commonwealth of Australia; 2011.
45. Holborn AT, Reavley NJ, Jorm AF. Differences between landline and mobile-only respondents in a dual-frame mental health literacy survey. Aust N Z J Public Health. 2012;36(2):192–3.
46. Livingston M, Dietze P, Ferris J, Pennay D, Hayes L, Lenton S. Surveying alcohol and other drug use through telephone sampling: a comparison of landline and mobile phone samples. BMC Med Res Methodol. 2013;13(1):41. 47. Barr ML, Ferguson RA, Steel DG. Inclusion of mobile telephone numbers
into an ongoing population health survey in New South Wales, Australia, using an overlapping dual-frame design: impact on the time series. BMC Res Notes. 2014;7:517.
48. Link MW, Battaglia MP, Frankel MR, Osborn L, Mokdad AH. A Comparison of Address-Based Sampling (ABS) Versus Random-Digit Dialing (RDD) for General Population Surveys. Public Opin Q. 2008;72(1):6–27.
49. Pennay D, Vickers N. Dual-frame Omnibus Survey. Technical and methodological summary report. Melbourne: The Social Research Centre; 2012.
50. Dillman DA, Tarnai J. Administrative issues in mixed mode surveys. In: Groves RM, Biemer PP, Lyberg LE, Massey JT, Nicholls WL, Waksberg J, editors. Telephone Survey Methodology. Hoboken: Wiley; 1988. p. 509–28.
51. Brick JM, Lepkowski JM. Multiple mode and frame telephone surveys. In: Lepkowski JM, Tucker C, Brick JM, de Leeuw ED, Japec L, Lavrakas PJ, Link MW, Sangster RL, editors. Advances in Telephone Survey Methodology. Hoboken: Wiley; 2007. p. 149–69.
52. Dillman DA. Mail and telephone surveys: the total design method. New York: Wiley; 1978.
53. Couper MP. The Future of Modes of Data Collection. Public Opin Q. 2011; 75(5):889–908.
54. Pierannunzi C, Town M, Garvin W, Shaw FE, Balluz L. Methodologic Changes in the Behavioral Risk Factor Surveillance System in 2011 and Potential Effects on Prevalence Estimates. MMWR Morb Mortal Wkly Rep. 2012; 61(22):410–3.
55. Battaglia MP, Frankel MR, Link MW. Improving standard poststratification techniques for random-digit-dialing telephone surveys. Survey Res Methods. 2008;2(1):11–9.
56. Frankel MR, Srinath KP, Hoaglin DC, Battaglia MP, Smith PJ, Wright RA, Khare M. Adjustments for non-telephone bias in random-digit-dialling surveys. Stat Med. 2003;22(9):1611–26.
• We accept pre-submission inquiries
• Our selector tool helps you to find the most relevant journal
• We provide round the clock customer support
• Convenient online submission
• Thorough peer review
• Inclusion in PubMed and all major indexing services
• Maximum visibility for your research
Submit your manuscript at www.biomedcentral.com/submit