R E S E A R C H
Open Access
Quantitative evaluation of yeast
’
s requirement for
glycerol formation in very high ethanol
performance fed-batch process
Julien Pagliardini
1, Georg Hubmann
2,3, Carine Bideaux
1, Sandrine Alfenore
1, Elke Nevoigt
2,3,4,
Stéphane E Guillouet
1*Abstract
Background:Glycerol is the major by-product accounting for up to 5% of the carbon inSaccharomyces cerevisiae ethanolic fermentation. Decreasing glycerol formation may redirect part of the carbon toward ethanol production. However, abolishment of glycerol formation strongly affects yeast’s robustness towards different types of stress occurring in an industrial process. In order to assess whether glycerol production can be reduced to a certain extent without jeopardising growth and stress tolerance, the yeast’s capacity to synthesize glycerol was adjusted by fine-tuning the activity of the rate-controlling enzyme glycerol 3-phosphate dehydrogenase (GPDH). Two
engineered strains whose specific GPDH activity was significantly reduced by two different degrees were
comprehensively characterized in a previously developed Very High Ethanol Performance (VHEP) fed-batch process.
Results:The prototrophic strain CEN.PK113-7D was chosen for decreasing glycerol formation capacity. The fine-tuned reduction of specific GPDH activity was achieved by replacing the nativeGPD1promoter in the yeast genome by previously generated well-characterizedTEF promoter mutant versions in agpd2Δbackground. Two TEFpromoter mutant versions were selected for this study, resulting in a residual GPDH activity of 55 and 6%, respectively. The corresponding strains were referred to here asTEFmut7andTEFmut2. The genetic modifications were accompanied to a strong reduction in glycerol yield on glucose; the level of reduction compared to the wild-type was 61% inTEFmut7and 88% inTEFmut2. The overall ethanol production yield on glucose was improved from 0.43 g g-1in the wild type to 0.44 g g-1measured inTEFmut7and 0.45 g g-1inTEFmut2. Although maximal growth rate in the engineered strains was reduced by 20 and 30%, forTEFmut7andTEFmut2respectively, strains’ ethanol stress robustness was hardly affected; i.e. values for final ethanol concentration (117 ± 4 g L-1), growth-inhibiting ethanol concentration (87 ± 3 g L-1) and volumetric ethanol productivity (2.1 ± 0.15 g l-1h-1) measured in wild-type remained virtually unchanged in the engineered strains.
Conclusions:This work demonstrates the power of fine-tuned pathway engineering, particularly when a
compromise has to be found between high product yield on one hand and acceptable growth, productivity and stress resistance on the other hand. Under the conditions used in this study (VHEP fed-batch), the two strains with “fine-tuned” GPD1expression in agpd2Δbackground showed slightly better ethanol yield improvement than previously achieved with the single deletion strainsgpd1Δor gpd2Δ. Although glycerol reduction is known to be even higher in agpd1Δgpd2Δdouble deletion strain, our strains could much better cope with process stress as reflected by better growth and viability.
* Correspondence: [email protected]
1Université de Toulouse, INSA, UPS, INP, LISBP, 135 Av de Rangueil, F-31077
Toulouse France INRA, UMR792 Ingénierie des Systèmes Biologiques et des Procédés, F-31400 Toulouse, France CNRS, UMR5504, F-31400 Toulouse, France
Background
Ideally, a micro-organism engineered for industrial bio-technology shows high product yield, final product con-centration and productivity and can cope with process constraints. Achieving all these goals is a major chal-lenge, particularly when it comes to modifications of the central carbon metabolism which is inherently coupled
to energy and redox issues. Moreover, the cell’s ability
to cope with environmental stress can be severely affected. One prominent example for such a challenge is
the reduction of glycerol formation inSaccharomyces
cerevisiae (S. cerevisiae) in order to improve yield in ethanol production. Glycerol is produced from the gly-colytic intermediate dihydroxyacetone phosphate (DHAP) which is reduced to glycerol-3-phosphate (G3P) by the two homologous isoenzymes of glycerol 3-phos-phate dehydrogenase (GPDH), Gpd1 and Gpd2 [1,2]. G3P is then dephosphorylated into glycerol by the cerol 3-phosphatases Gpp1 and Gpp2 [2,3]. In fact, gly-cerol is the main by-product beside carbon dioxide and biomass, accounting for up to 5% of the carbon [4].
A strain showing a reduced glycerol yield to the benefit of ethanol yield would result in substantial profit for the bioethanol industry. The challenge in reducing glycerol is that this compound and its formation fulfil major
physio-logical functions inS. cerevisiae. Glycerol formation
indeed participates in maintaining cytosolic redox bal-ance [5-8] and in providing the intermediate G3P, essen-tial for the biosynthesis of glycerophospholipids and triacylglycerols [9]. Glycerol is known to also contribute to stress management such as osmotic stress[10-12], heat, freezing/thawing or oxidative stress [10,13].
Although glycerol formation by wild-typeS. cerevisiae
is, to a certain extent, strain dependent, it predomi-nantly depends on the environmental conditions. The most important environmental factors are oxygen avail-ability, type of nitrogen source, osmotic pressure, heat and pH. For example, the presence of amino acids in the growth medium reduces the requirement of produ-cing their carbon backbones. This results in a signifi-cantly lower generation of excess NADH, i.e. lower glycerol formation when compared to minimal medium without any amino acids [5].
The first studies which aimed at redirecting the car-bon flux toward ethanol by reducing glycerol synthesis focused on GPDH (see above). Mutants deleted in one or both isogenes encoding for GPDH were constructed in different strain backgrounds and tested for ethanolic fermentation [1,3,7,14-17]. Nissen et al [16] reported
that single deletion mutants gpd1Δand gpd2Δshowed
respectively a 2.8% and a 4.7% ethanol yield improve-ment under anaerobic conditions and a 2.2% and 3.3% under aerobic conditions. The double deletion mutant
was not able to grow under anaerobic conditions and showed a 12.7% yield improvement, but also a 29% reduction in biomass yield in aerobic conditions. Other metabolic engineering strategies have targeted redox metabolism with the goal to produce less net excess NADH during the biomass synthesis and organic acid formation [18]. Bro et al. [19] obtained a 3% increase in the ethanol yield without any reduction in growth rate
by by-passing the NAD+-dependent glycolytic
conver-sion of glyceraldehyde to glycerate through the
heterolo-gous expression of a NADP+-dependent
glyceraldehyde-3-phosphate dehydrogenase. Nevertheless, these studies were made on low glucose concentration and did not imply industrially relevant process stresses such as high glucose and ethanol concentration. It was indeed shown
that agpd1Δgpd2Δdouble deletion mutant was severely
affected in ethanol production (35% decrease in final
titre) and ethanol tolerance (25% reduction in the P
criti-cal/μ value (ethanol concentration at which growth
stopped)) when placed under intensive ethanol produc-tion process[20].
Recent studies have combined single deletion ofGPD1
orGPD2, engineering of redox metabolism and/or
mod-ification of yeast glycerol export [21-25] The best results, a 39.7% reduction in glycerol yield accompanied by a 12.3% ethanol yield improvement [25], were
obtained with a strain deleted forGPD1,FPS1and
engi-neered for ammonium assimilation. Though, these results were obtained in a rich medium containing amino acids which is irrelevant in regards of most industrial processes. In addition, the use of rich medium compromises a correct conclusion about the redirection of carbon flow within these strains as long as catabolism of amino acids (in addition to glucose) is not taken into account.
our process. However, it was clear from published data, that completely abolishing glycerol formation was accompanied by a drastic loss of process robustness [16,20]. We therefore envisaged an approach where gly-cerol formation capacity was strongly reduced but
higher than in thegpd1Δgpd2Δdouble deletion strain.
In this context, recent advances in yeast promoter engi-neering [28,29] have opened new possibilities for fine-tuning of metabolic fluxes. Based on the knowledge about Gpd1 and Gpd2 activities in yeast and available promoters for fine-tuning gene expression, an appropri-ate engineering strappropri-ategy was defined supported by meta-bolic flux calculations (see results). To engineer the
according strains,GPD2 was deleted andGPD1
expres-sion was reduced by replacing its native promoter by
two previously constructedTEF1promoter versions [29]
with strongly reduced but different activities. We pre-sent here the kinetic analysis of the two genetically modified strains by characterizing (i) the effect of the genetic modification on product formation and growth (rates, yields and titers) and (ii) the robustness of the strains in our VHEP fed-batch process.
Methods
Strains, media and growth conditions
The Escherichia coli strain DH5a™(Invitrogen Corp., Carlsbad) was used for amplification of plasmids. The strain was grown in Luria-Bertani (LB) medium (0.5%
yeast extract, 1% peptone, 1% NaCl, pH 7) at 37°C. E.
colitransformation and isolation of plasmid DNA were
carried out using standard techniques [30]. All
Sacchar-omyces cerevisiae strains used in this study are listed in Table 1 and were derived from the prototrophic haploid wild-type strain CEN.PK 113-7D. For initial
pre-cultiva-tions, yeast strains were grown on YPD plates (2 g L-1
glucose, 1 g L-1 yeast extract, 1 g L-1 bacto peptone,
0.9 g L-1 NaCl, 1.5 g L-1 agar) and stored in 30%
gly-cerol at -80°C. All yeast strains used in this study are prototrophic allowing the use of minimum mineral media without any amino acid supplementation. All subsequent pre-cultures and fermentation experiments were carried out in synthetic mineral medium prepared as follows (all concentrations in g L-1): KH2PO4, 3.0; (NH4)2SO4, 3.0; Na2HPO4 12H2O, 3.0; sodium
gluta-mate, 1.0; MgSO4 7H2O, 0.5; ZnSO4 7H2O, 0.04;
MnSO4 H2O, 0.0038; CoCl2 6H2O, 0.0005; CuSO4
5H2O, 0.0009; Na2MoSO4 2H2O, 0.00006; CaCl2 2H2O,
0.023; (NH4)2Fe(SO4)66H2O, 0.023; H3BO3, 0.003; pan-tothenate, 0.005; nicotinic acid, 0.005; meso-inositol, 0.125; thiamine, 0.005; pyridoxine, 0.005; para-amino-benzoic acid: 0.001, and biotin, 0.000012[31]. Three steps of propagation with increasing culture volumes (5 mL, 30 mL, 300 mL) were carried out before inoculating the reactor for the VHEP fed-batch fermentations. Each pre-culture was grown for 12 hours and used as the inoculum for the next step at a 10% v/v ratio.
Engineered yeast strain construction
Genetic modifications ofS. cerevisiaeCEN.PK 113-7D
carried out within this study comprise both the deletion
ofGPD2and the replacement of nativeGPD1promoter
by two low-activity promoters (TEF1 promoters’
ver-sions see below). Gene deletion and promoter replace-ments based on homologous recombination in yeast were carried out according to the method described by
Güldener et al.[32]. Transformation ofS. cerevisiaewas
carried out according to Gietz et al. [33] using
treat-ment with lithium acetate and polyethylene glycol. In order to allow expression of the antibiotic resistance genes cells directly after transformation were first incu-bated for at least 4 h at 30°C in YD containing 1% yeast extract and 1% glucose. Afterwards, cells were spread on
YD agar plates supplemented with 7.5 μg/ml
phleomy-cin (for GPD2 deletion) or 100 μg/ml geneticin G418
(forGPD1 deletion and integration of GPD1promoter
replacement cassettes).
GPD1andGPD2coding regions show strong
similari-ties. In order to assure gene-specific homologous
recom-bination of theGPD2 disruption cassette we used the
GPD2 upstream region, which is different from the
region upstream of GPD1. Primers used for
amplifica-tion of theGPD2disruption cassette and verification of
correct gene disruption, listed in Table 2, were synthe-sized by Metabion International AG (Martinsried, Ger-many). Primers and PCR conditions used for the amplification of promoter replacement cassettes from
our TEF1promoter mutant collection were the same as
previously described [29]. The thermostablePfu DNA
polymerase with proofreading activity was obtained from BIONEER (Korea) and used for amplification of both gene-disruption and promoter-replacement cas-settes. Top DNA polymerase (BIONEER, Korea) was
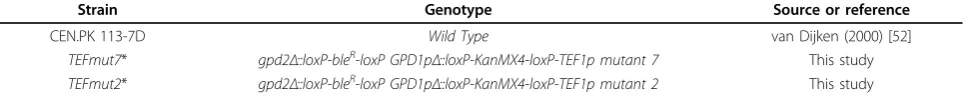
Table 1Saccharomyces cerevisiaestrains used in this study
Strain Genotype Source or reference
CEN.PK 113-7D Wild Type van Dijken (2000) [52]
TEFmut7* gpd2Δ::loxP-bleR-loxP GPD1pΔ::loxP-KanMX4-loxP-TEF1p mutant 7 This study
used in all diagnostic PCRs. PCR reaction mixtures were
prepared according to the manufacturer’s guidelines.
TheGPD2 gene was deleted using theloxP-bleR-loxP
cassette located on the plasmid pUG66 [32]. The gene
bleRconfers resistance to phleomycin. The primers used
for the amplification of the disruption cassette were P60
and P61 (Table 2). The GPD2disruption cassette used
here replaced 305 bp upstream of the GPD2 coding
region and 360 bp of theGPD2 coding sequence. The
correct integration of the loxP-bleR-loxP cassette was
verified by diagnostic PCR using the primer pair P62/ P63 (Table 2) and the following PCR conditions: 94°C for 1 min, 50°C for 1 min, and 72°C for 2 min. The PCR was performed in 30 cycles. If wild-type genomic DNA was used as a template, this diagnostic PCR resulted in a product of 855 bp in size, whereas the product
obtained from positivegpd2Δtransformants had a size
of 1.5 kbp.
In order to replace the nativeGPD1promoter by
pro-moters of much lower activities, the TEF1 promoter
mutant versions 2 and 7 of our previously published promoter collection for fine-tuning gene expression in yeast [29] were used. The promoters were located on
the described CEN/ARS plasmids
p416-loxP-KmR-TEF-mut2-yECitrineandp416-loxP-KmR-TEFmut7-yECitrine
bearing the loxP-KanMX-loxPcassette upstream of the
TEF1promoter mutant 2 and 7, respectively.
Integra-tions of the low-strength promoters were confirmed by PCR diagnosis using primers and PCR conditions as described earlier [29] except the temperature for primer annealing was set to 57°C instead of 60°C. The PCR
product obtained from nativeGPD1 promoter was 1.6
kbp, while a positive integration of theTEF1 promoter
mutant 2 or 7 cassette yielded a product size of 2.6 kbp.
Measurement of specific GPDH activity
In order to determine the specific activity of glycerol 3-phosphate dehydrogenase (GPDH), yeast strains were aerobically grown in shake flask cultures using the syn-thetic minimal medium as described above supplemen-ted with 2% [w/v] glucose. The GPDH activity was
measured in logarithmically growing cells (i.e. when
OD600 reached about 1) according to a previously
described method [2,34].
VHEP fed-batch protocol
VHEP fed-batch fermentations were carried on in 5 L bioreactors B DCU B.BRAUN (SARTORIUS) with a starting volume of 3 L. Temperature was set at 30°C
and pH regulated at 4 by adding 14% (vol/vol) NH3
solution. The reactor was flushed continuously with air;
dissolved O2 was maintained above 20% of saturation by
adapting the air flow and stirring rate in order to main-tain fully aerated conditions. A sequential vitamin feed-ing strategy based on the growth profile [31] was applied. The fermentations were started with an initial
glucose concentration of 100 g L-1. Whenever the
resi-dual glucose concentration was lower than 20 g L-1,
glu-cose feeding was carried out with a 700 g L-1glucose
solution to restore a glucose concentration of 100 g L-1.
At the later phase of fermentation, i.e.when the ethanol
concentration was above 90 g L-1, the glucose feeding
adjusted the concentration to 50 g L-1.
Gas analysis
Outlet and inlet gas analysis was performed using a
mass spectrometer Proline Dycor2a (Ametek Process
Instrument). Gas analysis was performed on the outlet flow of the reactor every 5 minutes and on the inlet air
every hour. The volumetric O2 consumption rate and
the CO2 production rate were calculated from the
differ-ences between the inlet and outlet gas compositions, taking into account the evolution of the liquid volume in the reactor, the inlet airflow rate (regulated by a mass flowmeter), the temperature and the pressure.
Analytical methods
Yeast growth was evaluated by spectrophotometric mea-surements at 620 nm in a spectrophotometer Libra S4 (Biochrom) and calibrated against cell dry weight mea-surements. Cells were harvested by filtration on
0.45-μm-pore-size polyamide membranes (Sartorius Biolab
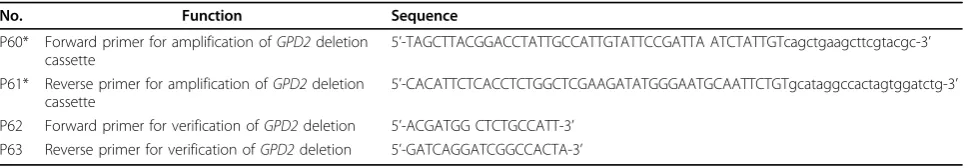
Table 2 Primers used for amplification theGPD2disruption cassette and verification of its correct genomic integration
No. Function Sequence
P60* Forward primer for amplification ofGPD2deletion cassette
5’-TAGCTTACGGACCTATTGCCATTGTATTCCGATTA ATCTATTGTcagctgaagcttcgtacgc-3’
P61* Reverse primer for amplification ofGPD2deletion cassette
5’-CACATTCTCACCTCTGGCTCGAAGATATGGGAATGCAATTCTGTgcataggccactagtggatctg-3’
P62 Forward primer for verification ofGPD2deletion 5’-ACGATGG CTCTGCCATT-3’ P63 Reverse primer for verification ofGPD2deletion 5’-GATCAGGATCGGCCACTA-3’
Product) and dried to a constant weight at 60°C under a partial vacuum (200 mm Hg ~ 26.7 kPa) for 24 hours. Rapid determination of glucose and ethanol concentra-tions from broth supernatants during fermentation was performed with an YSI analyser (YSI model 27 A; Yel-low Springs Instruments).
Determination of ethanol, organic acids and glucose from supernatants was performed by HPLC using an Aminex HPX-87H+ column (300 mm × 7.8 mm) and dual detection (refractometer and UV at 210 nm) at 50°
C with 5 mM H2SO4 as an eluant (flow rate of 0.5 mL
min-1). Three independent metabolite quantifications
(taking into account sampling, separation and HPLC quantification) showed that the measurement was repro-ducible; typically standard deviation was lower than 1% of mean value for ethanol and glucose and lower than 5% for glycerol and acetate.
Chemicals
All chemicals were of the highest analytical grade available.
Determination of the cells’viability
To determine cells’viability, the methylene blue
techni-que was used as previously described [31].
Assessment of ethanol evaporation
When balancing aerobic ethanolic fermentation experi-ments, there is commonly a lack in carbon due to eva-poration of ethanol. In fact, this may account for more than 20% of the total carbon [16,35]. To assess the part of evaporated ethanol, evaporation experiments were carried out under the same cultivation conditions as performed in this study but without yeast. The bioreac-tor was filled with 3 liters of the synthetic mineral med-ium used in this study and ethanol was added up to a
concentration of 150 g L-1. Decrease in the ethanol
con-centration was recorded over time by taking regular liquid samples and HPLC quantification. The rate of evaporation was found to be dependent on ethanol con-centration, aeration rate and liquid volume. No signifi-cant impact of stirring on evaporation was observed which is in accordance to a previous study [35]. Eva-poration was investigated for the 2 aeration rates used
during the fermentations 1 L.mn-1 and 0.5 L.mn-1.
Based on these data, an evaporation rate was attributed to each ethanol liquid concentration. Integration of this evaporation rate over time and liquid volume allowed calculating the evaporated ethanol in our yeast fermen-tations. The fact that the measured ethanol evaporation during the period of fermentation when cells had stopped producing ethanol exactly matched the calcu-lated ethanol evaporation validated the method.
Metabolic Flux Calculation
Metabolic fluxes were calculated using a MFA based model extrapolated from a previously described Meta-bolic Descriptor [27,36] The metaMeta-bolic network was modified by adding mitochondrial compartmentation. Repartition of the reactions between cytosol and mito-chondria was made according literature and previously described models [37-42]. Glycolysis, pentose phosphate pathway, synthesis of amino-acid precursors and nitro-gen bases as well as formation of ethanol and glycerol were attributed to the cytosol. TCA cycle and respira-tory chain were attributed to the mitochondria. Acetate and acetyl-coA synthesis were assumed to be localized in both cytosol and mitochondria. Segregation of amino acids synthesis between cytosol and mitochondria was inserted into the model according to the literature cited above. All transport reactions between the cytosol and the mitochondria were assumed to be simple transport reactions except for redox equivalent translocation via the glycerol shuttle. Our final metabolic network con-sists in 142 reactions, including 14 exchange reactions between the cell and external medium, 88 cytosolic reactions, 24 transport reactions between mitochondria and cytosol, and 16 mitochondrial reactions (cf. Addi-tional file 1). Validity of the model was assessed using
published data based on 13C labelling experiments
[43,44].
The Yatp,x values and NADH balance were calculated from the results of metabolic flux calculation as follows:
Y
iATPOP
i qi
Gly
iATP qiOP i
ATP X, =
∑ × +∑ ×
NADHpro iNADH q q q
i
i Gly
iNADH i
iTCA iNADH i
iAna
=
∑
× +∑
× +∑
×NADHcon Etoh q q q
NADH
Etoh Glyce NADH
Glyce i NADH
i OP
i
= × + × +
∑
×ix: Stoichiometric coefficient of metabolite x in reac-tion i
qiy: Rate of reaction i belonging to metabolic pathway
y
Ana:Anabolism
Gly: Glycolysis
OP: Oxidative Phosphorylation
TCA: Tricarboxylic acid cycle
Glyce: Glycerol
Etoh: Ethanol
NADHcon: NADH consumed
The uncertainties of the TCA cycle fluxes values were estimated to impact the Yatp,x and NADH balance by less than 3%.
Results
Design and construction of theGPDengineered strains supported byin silicoflux calculations
The central question of this study was to evaluate
whether and to what extent glycerol formation inS.
cer-evisiaecan be reduced without severely affecting yeast’s robustness, particularly ethanol tolerance under Very High Ethanol Performance fed-batch process conditions. Apart from the knowledge about the remarkably
reduced ethanol tolerance of the gpd1Δgpd2Δ double
deletion strain, no quantitative data was available about the impact of reduced glycerol formation capacity on
yeast’s performance in our VHEP fed-batch process. A
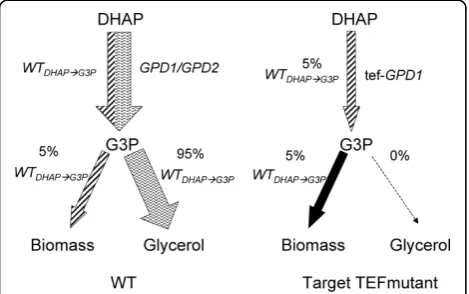
data set of specific substrate consumption and metabo-lite production rates measured during VHEP fed-batch cultivation with the CEN.PK 113-7D wild-type strain allowed us to calculate intracellular carbon fluxes including the one from DHAP to G3P necessary to fulfil biomass building block requirements. Flux calculations revealed that the ratio between the specific DHAP-to-G3P conversion rate and the specific growth rate were constant over a long period of the growth. Based on our metabolic model, 5% of the total DHAP-to-G3P flux observed in the wild-type strain was required for ana-bolic reactions while 95% of this flux was diverted toward glycerol production (Figure 1). This 5% flux should represent the minimum of carbon flux needed for anabolic requirements. Thus, one obligation for strain construction was to provide them with this mini-mal glycerol formation capacity.
In order to engineer S. cerevisiae strains with a
strongly reduced but not completely abolished glycerol
formation capacity, we envisaged to delete one isogene of GPDH and fine-tune the expression of the other one by replacing its native promoter by another one with
much lower activity. We decided to delete GPD2 and
fine-tuneGPD1 expression since the latter is known to
be responsible for the major part of GPDH activity and
GPD2deletion has been demonstrated to have no major
impact on yeast physiology except when synthetic mini-mal medium was used under strictly anaerobic
condi-tions [45]. In order to replace the native GPD1
promoter in CEN.PK 113-7D gpd2Δbackground, two
previously characterized mutated versions of theS.
cere-visiae TEF1were used (see Material and Methods). We chose the two weakest promoters available for this
study, i.e. TEF1p mutant 2 (normalized promoter
strength 7%) and TEF1p mutant 7 (promoter strength
16% normalized to the nativeTEFpromoter) [29].
Spe-cific GPDH activity of the wild type was 0.041 U/mg
protein. The down-regulation of GPD1gene expression
by GPD1 promoter replacement in the gpd2Δ
back-ground resulted in significantly reduced GPDH
activ-ities. The use of TEF1p mutant 7 upstream of GPD1
reduced GPDH activity to 55% (0.023 U/mg protein)
whereas the use of TEF1p mutant 2 reduced GPDH
activity to 6% (0.006 U/mg protein) compared to wild-type activity.
Impact of reduced GPDH activity on fermentations parameters
The two engineered strains TEFmut7 and TEFmut2
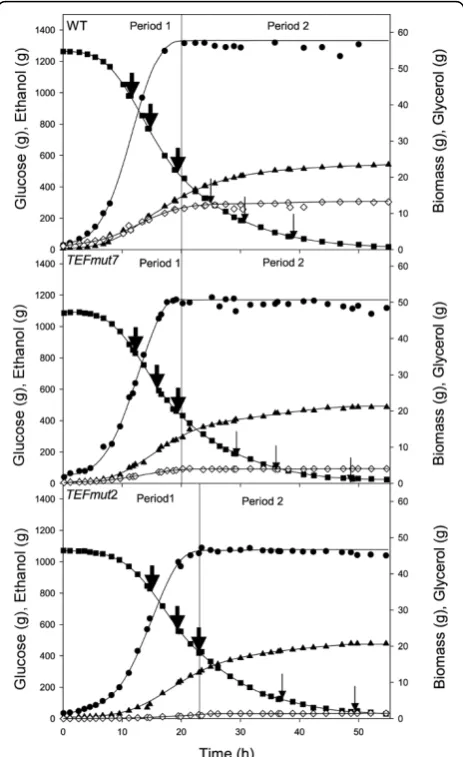
and the wild type were studied in VHEP fed-batch cul-tivation under comparable operating conditions in a synthetic mineral medium in order to precisely quan-tify the effect of the modulation of glycerol synthesis on ethanol production and growth capacities. Time courses of glucose consumption, biomass, ethanol and glycerol production are shown in Figure 2. All three fermentations showed two characteristic phases: a first
“growth phase” where biomass was produced
concomi-tant with ethanol, and a second “production phase”,
where growth had stopped due to ethanol inhibition but cells kept on producing ethanol. Growth of both
the wild-type strain and the TEFmut7 strain ended
after about 20 hours while growth ofTEFmut2 ended
after 23 hours.
Calculated growth rate, biomass yield, glycerol yield as well as ethanol yield, final titer and productivity are summarized in Table 3. Carbon balances were closed to
89% for the wild type, to 94% forTEFmut7 and to 94%
for TEFmut2; the degree of reduction balances closed to 83%, 90% and 90%, respectively. Evaluation of evapo-rated ethanol resulted in carbon and degree of reduction balances above 94% for all three fermentations. Acetal-dehyde was not measured due to its volatility and could
likely explain part of the deficit in carbon and degree of reduction balances.
The final biomass concentration obtained for the
wild-type strain was 15.7 g L-1while both modified strains
showed a final biomass concentration of 14.5 g L-1.
Final glycerol concentration was 3.1 g L-1for the
wild-type strain compared to 1 g L-1forTEFmut7 and 0.4 g
L-1 for TEFmut2. The final ethanol concentration
reached was 117 g L-1 for the wild-type and slightly
reduced to 112 g L-1 for TEFmut7 and 114 g L-1 for
TEFmut2. At the end of fermentation, acetate
concentration reached 5.5 g L-1 in the wild type and
5.1 g L-1in the two mutants.
Impact of reduced GPDH activity on fermentation kinetic parameters
The reduction of GPDH activity in the engineered strains led to a decrease in the maximum specific
gly-cerol production rate from 0.083 g gDCWh-1 in the wild
type to 0.023 g gDCWh-1and 0.004 g gDCWh-1in
TEF-mut7andTEFmut2, respectively. This corresponds to 28
and 5% residual rates in TEFmut7and TEFmut2
com-pared to the wild type, respectively. However, the maxi-mum specific growth rate and the maximaxi-mum specific ethanol production rates were also reduced in the
strains engineered for lower GPDH activity. The μmax
was 0.35 h-1for the wild type, 0.28 h-1 forTEFmut7and
0.24 h-1 for TEFmut2. The maximum specific ethanol
production rates were 1.31 gethanol gDCW-1 h-1 in the
wild type, 1.10 gethanolgDCW-1h-1inTEFmut7and 0.98
gethanol gDCW-1 h-1 in TEFmut2corresponding to 16%
and 25% reduction in the strains TEFmut7 and
TEF-mut2, respectively. Nevertheless, the overall volumetric
ethanol productivity was hardly affected inTEFmut7
and TEFmut2, i.e. 2.2 ± 0.1 and 2.3 ± 0.1 g L-1h-1, respectively compared to 2.1 ± 0.15 g L-1h-1for the wild type.
Impact of reduced GPDH activity on yields
Glycerol yield based on consumed glucose was 0.0051 g
g-1 and 0.0016 g g-1 for TEFmut7and TEFmut2,
respec-tively, corresponding to 39% in TEFmut7 and 12% in
TEFmut2compared to the wild type strain (0.013 g g-1). The glycerol yields per g of biomass during the growth
phase were also much lower forTEFmut7 andTEFmut2
(i.e. 0.06 and 0.02 g g-1DCW) respectively, compared to
0.14 g g-1DCWfor the wild type.
The biomass yields on glucose inTEFmut7 and
TEF-mut2were slightly lower in the strains with the reduced
GPDH activity, i.e. 0.091 gDCW gglucose-1for TEFmut7
and 0.087 gDCW gglucose-1TEFmut2 compared to 0.093
gDCWgglucose-1 for the wild type. The overall acetate yields based on consumed glucose were similar for all three strains and reached 0.017 g g-1.
As a result, the overall ethanol production yield on glucose was increased in the two engineered strains.
While the wild-type strain produced 0.43 g g-1,
TEF-mut7formed 0.44 g g-1andTEFmut20.45 g g-1. As
visi-ble from Tavisi-ble 3, the strain differences in the overall ethanol yields were solely due to the differences observed during the growth phase. In this phase, ethanol yields reached 0.41 g g-1 for the wild type, 0.42 g g-1for
TEFmut7and 0.44 g g-1forTEFmut2. During the“
pro-duction phase”, no significant variation of ethanol yield
Figure 2Substrate and products masses evolutions during the wild type and the mutants fermentations. Mass of glucose (black square), ethanol (black triangle), biomass (black circle) and glycerol (white diamond). Period 1 corresponds to the“growth/production phase”and period 2 to the“production phase”. Thick arrows indicate the time points when glucose feeding was carried out in order to adjust glucose concentration in the fermenter up to 100 g L-1, thin arrows correspond to glucose feeding up to a
could be observed between the wild type and the two engineered strains (0.47 g g-1).
We also calculated oxygen to biomass yield for all three strains. The average oxygen to biomass yield
dur-ing the growth phase of the wild type was 6 mmolO2
gDCW-1. While there was no significant difference
com-pared toTEFmut7(7 mmolO2gDCW-1), the strain
TEF-mut2showed a significantly higher yield of 10 mmolO2
gDCW-1.
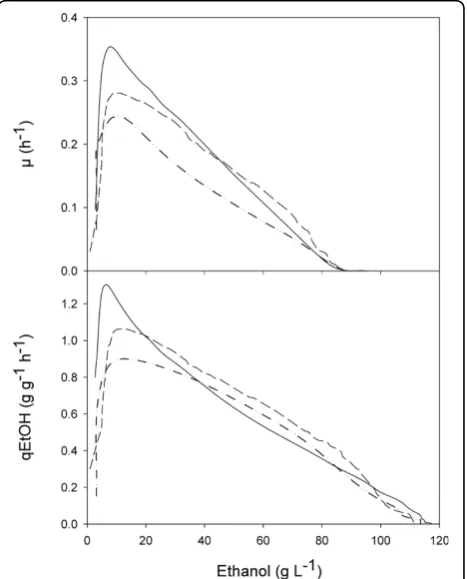
Impact of reduced GPDH activity on ethanol tolerance
Figure 3 shows the evolution of both the specific growth and ethanol production rates as a function of the actual ethanol concentration in the bioreactor for each strain. The ethanol concentration at which uncoupling between growth and ethanol production occurs is usually
referred to as Pcritical/μ. This parameter characterizes
the strain-dependent growth inhibition by ethanol.
Pcri-tical/μ was about 87 g L-1 for the wild type, 85 g L-1
and 86 g L-1for TEFmut7 and TEFmut2, respectively.
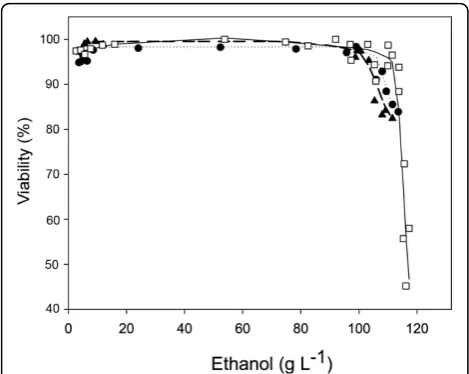
Evaluation of cell viability by the methylene blue
method indicated that ethanol tolerance of the GPD
-engineered strains was only slightly reduced compared to the wild type (Figure 4).
Comparative flux analysis of the strains
In order to better understand the metabolic reorganiza-tion upon the modulareorganiza-tion of the glycerol synthesis path-way at the cell level, metabolic flux calculations were carried out for each strain. However in order to take
into account the differences inμmax between the strains,
the experimentally obtained specific consumption and
production rates were chosen atμmaxand normalized to
a biomass production rate of 1 g g-1h-1. The results of
this calculation are reported in Figure 5. It shows that
the DHAP-to-G3P flux at μmax was only 39% and 11%
inTEFmut7and TEFmut2, respectively compared to the level observed in the wild type. Moreover flux calcula-tion also indicated that the modulacalcula-tion of the glycerol pathway led to a global metabolic reorganization pointed
Table 3 Fermentation characteristics forS. cerevisiaewild-type strain CEN.PK 113-7D and the two mutants
WT TEFmut7 TEFmut2
Fermentation Time (h) 55 49 49
Growth Time (h) 20 20 23
Final Volume (L) 3.10 2.89 2.92
μmax(h-1) 0.35 ± 0.02 0.28 ± 0.02 0.24 ± 0.02
DCWmax (g L-1) 15.7 ± 0.5 14.5 ± 0.5 14.5 ± 0.5
YDCW/glucose g g-1 0.093 ± 0.006[5-15 h] 0.091 ± 0.007[5-15 h] 0.087 ± 0.005[5-17 h]
Yethanol/glucose g g-1(growth) 0.41 ± 0.006[0-20 h] 0.42 ± 0.01[0-20 h] 0.44 ± 0.005[0-23 h]
Yethanol/glucose g g-1(overall) 0.43 ± 0.005[0-55 h] 0.44 ± 0.008[0-49 h] 0.45 ± 0.003[0-49 h]
Y glycerol/glucose mg g-1 13 ± 0.01[0-20 h] 5.1 ± 0.2[0-20 h] 1.6 ± 0.1[0-23 h]
[ethanol] final (g L-1) 117 ±4 112 ± 4 114 ± 4
[glycerol] final (g L-1) 3.1 ± 0.1 1 ± 0.1 0.4 ± 0.1
Ethanol Productivity (g L-1h-1) 2.13 ± 0.15 2.2 ± 0.15 2.3 ± 0.15
Pcritical/μ(g L-1) 87 ± 3 85 ± 3 86 ± 3
μmax: maximum specific growth rate; DCWmax: maximum cell concentration; Yi/glucose: production yield of the constituent i on glucose; Pcritical/μ: ethanol
concentration at which growth stopped;“growth phase": fermentation phase of yeast growth;“production phase": fermentation phase after yeast growth stopped but ethanol production continued.
Figure 3 Specific growth rates (μ) and specific ethanol production rate (qEtOH) as functions of ethanol concentration. Strains: wild type CEN.PK 113-7D (___),TEFmut7(- - -),
out by the increased normalized rates of ethanol pro-duction, glycolysis, NADH mitochondrial shuttles and respiration.
Discussion
Aiming at determining to what extent glycerol forma-tion may be reduced without affecting drastically the strain robustness in a VHEP fed-batch process, the
modulation of glycerol synthesis capacity ofS. cerevisiae
was obtained by replacing the native promoter ofGPD1
with promoters of significantly lower activities in a
CEN.PK113-7D gpd2Δ background resulting in the
strainsTEFmut7andTEFmut2.
Fine-tuning of the glycerol synthesis pathway led to improved ethanol yield
The two engineered strains led to a reduction of
gly-cerol yield on glucose by 61% forTEFmut7 and 88% in
TEFmut2compared to the wild type strain. The meta-bolic flux calculation from the experimental data set of
TEFmut7and TEFmut2, respectively, showed that the DHAP-to-G3P flux was evaluated at 39 and 11% of the one calculated in the wild type (Figure 5). The reduction of the glycerol production in the two engineered strains was accompanied by a slightly increased ethanol yield
on glucose (2.3% forTEFmut7and 4.6% forTEFmut2).
For comparison, in aerobic conditions, simple deletion
mutants gpd1Δ and gpd2Δ of TN1 strain showed
respectively a 2.2% and 3.3% yield improvement,
whereas double deletion gpd1Δgpd2Δstrain showed a
12% improvement (0.39 g g-1) [16]. A 10% ethanol yield
improvement was also obtained in a double deletion
gpd1Δgpd2Δstrain of W303-1A but was accompanied
by a drastic loss of robustness towards ethanol stress [20].
In terms of carbon balance (Figure 6), the reduction of the glycerol production could not completely explain the gain in the ethanol yield. Obviously, a decrease in bio-mass production also contributed to this improvement. Metabolic flux calculations pointed out a decrease in the ATP-to-biomass yield (Yx,ATP) concomitantly with the decrease in the biomass production yield. The Yx,
ATP value was 9.7, 9.1 and 7.8 gDCW molATP-1, in the
wt , the TEFmut7 and the TEFmut2, respectively. A
decrease in the ATP yield related to the decrease in gly-cerol production was already observed in RQ controlled fermentation experiment [27]. This diminution of the biomass and ATP yield could be linked to the deficit of cytosolic NADH oxidation (discussion see below) and to the stress management. The cell stress management may cost more energy to the mutant strains under VHEP conditions due to high glucose and ethanol concentrations and high osmolarity (rise from 0.7 to
2.9 Osm kg-1 during the whole cultivation). For
trans-port systems energetically related to the proton gradient,
the cost in “equivalent” ATP may be higher in the
strains producing less glycerol, known as the main com-patible solute in yeast. For instance, osmoregulatory
mechanisms such as K+ homeostasis, glycerol exporter
(FPS1) and compatible solute synthesis requiring appre-ciable ATP turnover [46] may be more requested in strains impaired in glycerol formation. Metabolic flux calculation showed that the mutant strains generated more energy than the wt to produce a similar amount of biomass (Figure 5) through a higher flux in the cen-tral carbon metabolism. Higher maintenance coefficients and higher TCA cycle flux were already reported in the
literature during osmoregulation inS. cerevisiae[46,47].
Fine-tuning of the glycerol synthesis pathway altered the growth rate but not the ethanol tolerance in VHEP
The reduction of the glycerol formation in the two mutant strains led to a concomitant decrease in the
maximal specific growth rate (μmax), 20% and 31% lower
in the strainsTEFmut7andTEFmut2, respectively,
com-paratively to the wt strain. Nevertheless, based on the metabolic flux calculation, the DHAP-to-G3P rate should have been high enough for both strains to
sus-tain theμmaxof the wild type. Similarly a 55% decrease
in the μmax was reported ingpd1Δgpd2Δstrain under
aerobic conditions, explained by the limited ability to
reoxidize NADH to NAD+in the cytosolic compartment
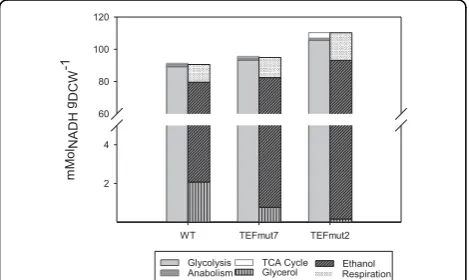
[16]. The deficit of cytosolic NADH oxidation due to the decrease in glycerol formation capacity could be partly compensated by the increase in the oxygen con-sumption through the respiration, observed in the mutant strains. Figure 7 indeed shows the increased
participation of ethanol biosynthesis and respiration to the NADH balance. The metabolic flux calculation revealed also an increased participation of the mito-chondrial shuttles.
The mitochondrial shuttles were represented in the model by the glycerol-3-phosphate shuttle, but either an increased participation of the external NADH
dehydro-genases (NDE1/2) or the glycerol-3-phosphate shuttle
could take over the excess of cytosolic NADH [8,48].
Therefore both systems likely participated to the transfer of cytosolic NADH into the mitochondria to be oxidised
by the respiratory chain leading to the increase in the O2
consumption. However the reduction of the GPDH rate may have reduced the activity of the glycerol-3-phosphate shuttle compared to the NDEs in our engineered strains. As the glycerol-3-phosphate shuttle was reported to have a higher ATP/O ratio compared to the external NDEs, the reduction of the glycerol-3-phosphate shuttle activity
Figure 5Metabolic flux repartition. Metabolic flux repartition within the central carbon metabolism for theS. cerevisiaeCEN.PK 113-7D wild type and the two strains engineered for reduced GPDH activity. Metabolic fluxes were calculated as mmol gDCW
-1
h-1from experimental data obtained atμmaxand then normalized to a biomass production rate of 1 g g
-1
h-1(WT/TEFmut7/TEFmut2). TCA cycle fluxes were found highly
could partly explain the reduction in Yx,ATP in our mutant strains [8].
One alternate explanation for growth rate reduction might be that the reduction in the glycerol phosphate dehydrogenase rate created a competition for the L-G3P between the anabolic requirement in this metabolite and glycerol synthesis within the cell. L-G3P produced by the reduction of DHAP is indeed either dephosphory-lated into glycerol by the glycerol phosphate phospha-tases (GPP) or enters into the phospholipid synthesis pathway via the phosphatidic acid (Figure 1). The rate of dephosphorylation of L-G3P being far higher than the rate of its conversion into phosphatidic acid, this lat-ter reaction might limit the growth rate.
No relevant reduction of the maximum specific
growth rate was observed in single gpdΔ deletion
mutants in previous studies in aerobic conditions [16]. However ethanol production capacities of these strains were studied under experimental conditions where the cells did not face high glucose and high ethanol concen-tration as encountered in VHEP conditions. Glycerol is known to play a role in stress resistance, such as osmo-tic stress [10,49], ethanol and temperature stress [13]. Glycerol is the major compatible solute accumulated in yeast to increase cell turgor pressure to face hyper-osmotic stress. Modifying the glycerol synthesis pathway should alter the ability of the cell to regulate its turgor pressure. However authors have suggested through the surface stress theory that a fine tuned turgor pressure is necessary for yeast growth [50,51]. Thus an impact of
the osmotic stress on the μmaxof our strains under our
conditions cannot be completely excluded.
Despite the impact on the growth rate and in clear
contrast to the gpd1Δgpd2Δdouble deletion strain [20],
ethanol tolerance was not affected by the genetic modi-fications carried out in the current study even though the fermentation conditions were exactly the same.
Finally we concluded that the two mutant strains were able to sustain a similar ethanol concentration than the wild type strain but with a higher energy expense. This higher energy demand increased the relative weight of energy production reactions over biomass synthesis in the metabolism of the mutants leading to an improved ethanol yield.
Conclusions
A prominent feature here is that fine-tuning the glycerol synthesis pathway (within the range 11-39% of the wild-type capacity) allows the strains to keep their initial etha-nol tolerance. Both engineered strains showed indeed a similar behaviour in terms of ethanol inhibition on
growth quantified by a Pcritical/μvalue at 86 ± 1 g L-1
and viability. Therefore we conclude that reducing the glycerol synthesis down to 11% of the wild type capacity did not affect the strain robustness in terms of ethanol tolerance, ethanol titer and productivity.
Additional file 1:S.cerevisiaemetabolic network model. The Excel sheet“reactions”contains all the reactions in the model categorized by their metabolic pathway, the sheet“abbreviated metabolites”enlists the abbreviations of the metabolites, the sheet“symbolic variables”enlists the variables used for the description of macromolecule composition, the sheet“variables’values”shows for each variable the value used for the resolution of the equation system corresponding to the model.
Abbreviations
αix: Stoichiometric coefficient of metabolite x in reaction i;qi y
: Rate of reaction i belonging to metabolic pathway y;Ana:Anabolism;Gly: Glycolysis;
OP: Oxidative Phosphorylation;TCA: Tricarboxylic acid cycle;Glyce: Glycerol;
Etoh: Ethanol;NADHcon: NADH consumed;NADHpro: NADH produced. WT TEFmut7 TEFmut2
0.0 0.1 0.6 0.8 1.0
Cm
o
l Cm
o
l
-1 gl
u
c
ose
Biomass Ethanol Glycerol
Organic Acids CO2
Figure 6Carbon balances for theS. cerevisiaewild-type strain and the two mutants. Carbon balances and are expressed as C-mol ratio between the amount of metabolites produced (based on final masses at the end of fermentation) and glucose consumed.
WT TEFmut7 TEFmut2
mM
o
l NA
DH
gDCW
-1
2 4 60 80 100 120
Glycolysis Anabolism
TCA Cycle
Glycerol EthanolRespiration
Figure 7NADH balances for theS. cerevisiaewild-type and the two mutants (TEFmut7andTEFmut2). NADH balances were calculated for each strain at the time point whenμmaxwas reached,
Acknowledgements
This work was supported by grants from the P2R Program (French Ministry of Foreign Affairs, CNRS and DAAD) and from the ANR program (ANR-05-BIOE-007). J. Pagliardini gratefully acknowledges financial doctoral support by the ADEME and Danisco France.
Author details
1
Université de Toulouse, INSA, UPS, INP, LISBP, 135 Av de Rangueil, F-31077 Toulouse France INRA, UMR792 Ingénierie des Systèmes Biologiques et des Procédés, F-31400 Toulouse, France CNRS, UMR5504, F-31400 Toulouse, France.2Department of Molecular Microbiology, VIB, Kasteelpark Arenberg 31
- bus 2438, B-3001 Heverlee, Flanders, Belgium.3Laboratory of Molecular Cell Biology, Institute of Botany and Microbiology, Katholieke Universiteit Leuven, Kasteelpark Arenberg 31 - bus 2438, B-3001 Heverlee, Flanders, Belgium.
4School of Engineering and Science, Jacobs University gGmbH, Campus Ring
1, 27579 Bremen, Germany.
Authors’contributions
JP, SG and CB contributed to the metabolic model set-up and flux calculation.
GH carried out the genetic work.
GH, JP, SG, and CB contributed to the fermentations experiments. SG, EN, CB, and SA conceived of the study, and participated in its design and coordination and helped to draft the manuscript.
All authors read and approved the final manuscript.
Competing interests
The authors declare that they have no competing interests.
Received: 17 December 2009 Accepted: 21 May 2010 Published: 21 May 2010
References
1. Eriksson P, André L, Ansell R, Blomberg A, Adler L:Cloning and characterization ofGPD2, a second gene encodingsn-glycerol 3-phosphate dehydrogenase (NAD+) inSaccharomyces cerevisiae, and its comparison withGPD1.Molecular Microbiology1995,17(1):95-107. 2. Gancedo C, Gancedo JM, Sols A:Glycerol Metabolism in Yeasts.European
Journal of Biochemistry1968,5(2):165-172.
3. Bjorkqvist S, Ansell R, Adler L, Liden G:Physiological response to anaerobicity of glycerol-3-phosphate dehydrogenase mutants of
Saccharomyces cerevisiae.Applied Environmental Microbiology1997,
63(1):128-132.
4. Oura E:Reaction products of yeast fermentations.Process Biochememistry
1977,12:19-21.
5. Albers E, Larsson C, Liden G, Niklasson C, Gustafsson L:Influence of the nitrogen source onSaccharomyces cerevisiaeanaerobic growth and product formation.Applied Environmental Microbiology1996,
62(9):3187-3195.
6. van Dijken J, Scheffers WA:Redox balances in the metabolism of sugars by yeasts.FEMS Microbiology Letters1986,32:199-224.
7. Ansell R, Granath K, Hohmann S, Thevelein JM, Adlerand L:The two isoenzymes for yeast NAD+-dependent glycerol 3-phosphate
dehydrogenase encoded byGPD1andGPD2have distinct roles in osmoadaptation and redox regulation.The EMBO journal1997,
16:2179-2187.
8. Rigoulet M, Aguilaniu H, Avéret N, Bunoust O, Camougrand N, Grandier-Vazeille X, Larsson C, Pahlman IL, Manon S, Gustafsson L:Organization and regulation of the cytosolic NADH metabolism in the yeastSaccharomyces
cerevisiae.Molecular and Cellular Biochemistry2004,256-257(1):73. 9. Athenstaedt K, Daum G:Phosphatidic acid, a key intermediate in lipid
metabolism.European Journal Biochemistry1999,266(1):1-16. 10. Hohmann S:Osmotic Stress Signaling and Osmoadaptation in Yeasts.
Microbiology and Molecular Biology Review2002,66(2):300-372. 11. Blomberg A, Adler L:Roles of glycerol and glycerol-3-phosphate
dehydrogenase (NAD+) in acquired osmotolerance ofSaccharomyces
cerevisiae.Journal of Bacteriology1989,171(2):1087-1092. 12. Luyten K, Albertyn J, Skibbe WF, Prior BA, Ramos J, Thevelein JM,
Hohmann S:Fps1, a yeast member of the MIP family of channel proteins, is a facilitator for glycerol uptake and efflux and is inactive under osmotic stress.The EMBO Journal1995,14:1360-1371.
13. Aldiguier AS, Alfenore S, Cameleyre X, Goma G, Uribelarrea JL, Guillouet SE, Molina-Jouve C:Synergistic temperature and ethanol effect on
Saccharomyces cerevisiaedynamic behaviour in ethanol bio-fuel production.Bioprocess and Biosystems Engineering2004,26(4):217. 14. Michnick S, Roustan JL, Remize F, Barre P, Dequin S:Modulation of Glycerol
and Ethanol Yields During Alcoholic Fermentation inSaccharomyces
cerevisiaeStrains Overexpressed or Disrupted forGPD1Encoding Glycerol 3-Phosphate Dehydrogenase.Yeast1997,13(9):783-793.
15. Valadi H, Larsson C, Gustafsson L:Improved ethanol production by glycerol-3-phosphate dehydrogenase mutants ofSaccharomyces
cerevisiae.Applied Microbiology and Biotechnology1998,50(4):434. 16. Nissen TL, Hamann CW, Kielland-Brandt MC, Nielsen J, Villadsen J:
Anaerobic and aerobic batch cultivations ofSaccharomyces cerevisiae mutants impaired in glycerol synthesis.Yeast2000,16(5):463-474. 17. Guo Zp, Zhang L, Ding Zy, Wang ZX, Shi GY:Interruption of glycerol
pathway in industrial alcoholic yeasts to improve the ethanol production.Applied Microbiology and Biotechnology2009,82(2):287. 18. Nissen TL, Kielland-Brandt MC, Nielsen J, Villadsen J:Optimization of Ethanol
Production inSaccharomyces cerevisiaeby Metabolic Engineering of the Ammonium Assimilation.Metabolic Engineering2000,2(1):69-77. 19. Bro C, Regenberg B, Förster J, Nielsen J:In silico aided metabolic
engineering of Saccharomyces cerevisiae for improved bioethanol production.Metabolic Engineering2006,8(2):102.
20. Boulahya K:Evaluation des potentialités fermentaires de souches mutées deS. cerevisiaeen vue d’une production nulle de glycérol dans une fermentation éthanolique.Toulouse: Université de Toulouse, INSA 2005. 21. Kong QX, Cao LM, Zhang AL, Chen X:Overexpressing GLT1 in gpd1Δ
mutant to improve the production of ethanol ofSaccharomyces
cerevisiae.Applied Microbiology and Biotechnology2007,73(6):1382. 22. Kong QX, Zhang AL, Cao LM, Chen X:Over-expressing GLT1 in a gpd2Δ
mutant ofSaccharomyces cerevisiaeto improve ethanol production.
Applied Microbiology and Biotechnology2007,75(6):1361. 23. Zhang A, Kong Q, Cao L, Chen X:Effect ofFPS1deletion on the
fermentation properties ofSaccharomyces cerevisiae.Letters in Applied Microbiology2007,44(2):212-217.
24. Kong QX, Gu JG, Cao LM, Zhang AL, Chen X, Zhao XM:Improved production of ethanol by deleting FPS1 and over-expressing GLT1 in
Saccharomyces cerevisiae.Biotechnology Letters2006,28(24):2033. 25. Cao L, Zhang A, Kong Q, Xu X, Josine TL, Chen X:Overexpression of GLT1
in fps1D gpdD mutant for optimum ethanol formation by Saccharomyces cerevisiae.Biomolecular Engineering2007,24(6):638. 26. Alfenore S, Cameleyre X, Benbadis L, Bideaux C, Uribelarrea JL, Goma G,
Molina-Jouve C, Guillouet SE:Aeration strategy: a need for very high ethanol performance inSaccharomyces cerevisiaefed-batch process.
Applied Microbiology and Biotechnology2004,63(5):537.
27. Bideaux C, Alfenore S, Cameleyre X, Molina-Jouve C, Uribelarrea JL, Guillouet SE:Minimization of Glycerol Production during the High-Performance Fed-Batch Ethanolic Fermentation Process in
Saccharomyces cerevisiae, Using a Metabolic Model as a Prediction Tool.
Applied Environmental Microbiology2006,72(3):2134-2140.
28. Alper H, Fischer C, Nevoigt E, Stephanopoulos G:Tuning genetic control through promoter engineering.PNAS2005,102(36):12678-12683. 29. Nevoigt E, Kohnke J, Fischer CR, Alper H, Stahl U, Stephanopoulos G:
Engineering of Promoter Replacement Cassettes for Fine-Tuning of Gene Expression inSaccharomyces cerevisiae.Applied Environmental Microbiology2006,72(8):5266-5273.
30. Sambrook J, Maniatis T, Fritsch EF:Molecular cloning: a laboratory manual.
Cold Spring Harbor, N.Y.: Cold Spring Harbor Laboratory, 2 1989. 31. Alfenore S, Molina-Jouve C, Guillouet S, Uribelarrea JL, Goma G, Benbadis L:
Improving ethanol production and viability ofSaccharomyces cerevisiae by a vitamin feeding strategy during fed-batch process.Applied Microbiology and Biotechnology2002,60(1):67.
32. Gueldener U, Heinisch J, Koehler GJ, Voss D, Hegemann JH:A second set of loxP marker cassettes for Cre-mediated multiple gene knockouts in budding yeast.Nucleic Acids Res2002,30(6):e23.
33. Gietz RD, Schiestl RH:Applications of high efficiency lithium acetate transformation of intact yeast cells using single-stranded nucleic acids as carrier.Yeast1991,7(3):253-263.
34. Nevoigt E, Stahl U:Reduced pyruvate decarboxylase and increased glycerol-3-phosphate dehydrogenase [NAD+] levels enhance glycerol
35. Duboc P, Stockar Uv:Systematic errors in data evaluation due to ethanol stripping and water vaporization.Biotechnology and Bioengineering1998,
58(4):428-439.
36. Bideaux C, Goma G, Uribelarrea JL, Dahhou B, Roux G:Stoichiometric modelling approach for microbial cultures monitoring.International Journal of Modelling, Identification and Control2008,3:413. 37. Ryan ED, Kohlhaw GB:Subcellular Localization of Isoleucine-Valine
Biosynthetic Enzymes in Yeast.Jounal of Bacteriology1974,120(2):631-637. 38. Brandriss MC, Magasanik B:Subcellular compartmentation in control of
converging pathways for proline and arginine metabolism in
Saccharomyces cerevisiae.Journal of Bacteriology1981,145(3):1359-1364. 39. Kispal G, Steiner H, Court DA, Rolinski B, Lill R:Mitochondrial and Cytosolic
Branched-chain Amino Acid Transaminases from Yeast, Homologs of the myc Oncogene-regulated Eca39 Protein.Journal of Biological Chemistry
1996,271(40):24458-24464.
40. Maaheimo H, Fiaux J, Cakar ZP, Bailey JE, Sauer U, Szyperski T:Central carbon metabolism ofSaccharomyces cerevisiaeexplored by biosynthetic fractional 13C labeling of common amino acids.European Journal of Biochemistry2001,268(8):2464-2479.
41. Förster J, Famili I, Fu P, Palsson BÃ, Nielsen J:Genome-Scale Reconstruction of theSaccharomyces cerevisiaeMetabolic Network.
Genome Research2003,13(2):244-253.
42. Duarte NC, Herrgard MJ, Palsson BO:Reconstruction and Validation of
Saccharomyces cerevisiaeiND750, a Fully Compartmentalized Genome-Scale Metabolic Model.Genome Research2004,14:1298-1309. 43. Gombert AK, Moreira dos Santos M, Christensen B, Nielsen J:Network
Identification and Flux Quantification in the Central Metabolism of
Saccharomyces cerevisiaeunder Different Conditions of Glucose Repression.Journaml of Bacteriology2001,183(4):1441-1451. 44. Fiaux J, Cakar ZP, Sonderegger M, Wuthrich K, Szyperski T, Sauer U:
Metabolic-Flux Profiling of the YeastsSaccharomyces cerevisiaeand
Pichia stipitis.Eukaryotic Cell2003,2(1):170-180.
45. Remize F, Cambon B, Barnavon L, Dequin S:Glycerol formation during wine fermentation is mainly linked to Gpd1p and is only partially controlled by the HOG pathway.Yeast2003,20(15):1243-1253. 46. Olz R, Larsson K, Adler L, Gustafsson L:Energy flux and osmoregulation of
Saccharomyces cerevisiaegrown in chemostats under NaCl stress.Journal of Bacteriology1993,175(8):2205-2213.
47. Heyland J, Fu J, Blank LM:Correlation between TCA cycle flux and glucose uptake rate during respiro-fermentative growth of
Saccharomyces cerevisiae.Microbiology2009, mic.0.030213-030210. 48. Pahlman Il, Larsson C, Averet N, Bunoust O, Boubekeur S, Gustafsson L,
Rigoulet M:Kinetic Regulation of the Mitochondrial Glycerol-3-phosphate Dehydrogenase by the External NADH Dehydrogenase inSaccharomyces
cerevisiae.Journal of Biological Chemistry2002,277(31):27991-27995. 49. Nevoigt E, Stahl U:Osmoregulation and glycerol metabolism in the yeast
Saccharomyces cerevisiae.FEMS Microbiology Reviews1997,21(3):231-241. 50. Slaughter B, Li R:Toward a molecular interpretation of the surface stress
theory for yeast morphogenesis.Current Opinion in Cell Biology2006,
18(1):47.
51. Koch A:The surface stress theory of microbial morphogenesis.Advances in Microbial Physiology1983,24:301-366.
52. van Dijken JP, Bauer J, Brambilla L, Duboc P, Francois JM, Gancedo C, Giuseppin MLF, Heijnen JJ, Hoare M, Lange HC,et al:An interlaboratory comparison of physiological and genetic properties of four
Saccharomyces cerevisiaestrains.Enzyme and Microbial Technology2000,
26(9-10):706.
doi:10.1186/1475-2859-9-36
Cite this article as:Pagliardiniet al.:Quantitative evaluation of yeast’s
requirement for glycerol formation in very high ethanol performance fed-batch process.Microbial Cell Factories20109:36.
Submit your next manuscript to BioMed Central and take full advantage of:
• Convenient online submission
• Thorough peer review
• No space constraints or color figure charges
• Immediate publication on acceptance
• Inclusion in PubMed, CAS, Scopus and Google Scholar
• Research which is freely available for redistribution