R E S E A R C H
Open Access
Effect modification by vitamin D receptor genetic
polymorphisms in the association between
cumulative lead exposure and pulse pressure: a
longitudinal study
Min A Jhun
1, Howard Hu
2, Joel Schwartz
3, Marc G Weisskopf
3, Linda H Nie
4, David Sparrow
5,
Pantel S Vokonas
5and Sung Kyun Park
1*Abstract
Background:Although the association between lead and cardiovascular disease is well established, potential mechanisms are still poorly understood. Calcium metabolism plays a role in lead toxicity and thus, vitamin D receptor (VDR) polymorphisms have been suggested to modulate the association between lead and health outcomes. We investigated effect modification byVDRgenetic polymorphisms in the association between cumulative lead exposure and pulse pressure, a marker of arterial stiffness.
Methods:We examined 727 participants (3,100 observations from follow-ups from 1991 to 2011) from the Normative Aging Study (NAS), a longitudinal study of aging. Tibia and patella bone lead levels were measured using K-x-ray fluorescence. Four single nucleotide polymorphisms (SNPs) in theVDRgene,Bsm1,Taq1,Apa1, andFok1, were genotyped. Linear mixed effects models with random intercepts were implemented to take into account repeated measurements.
Results:Adjusting for potential confounders, pulse pressure was 2.5 mmHg (95% CI: 0.4-4.7) and 1.9 mmHg (95% CI: 0.1-3.8) greater per interquartile range (IQR) increase in tibia lead (15μg/g) and patella lead (20μg/g), respectively, in those with at least one minor frequency allele inBsm1compared with those with major frequency allele homozygotes. The observed interaction effect between bone lead and theBsm1genotype persists over time during the follow-up. Similar results were observed in effect modification byTaq1.
Conclusions:This study suggests that subjects with the minor frequency alleles ofVDR Bsm1orTaq1may be more susceptible to cumulative lead exposure-related elevated pulse pressure.
Keywords:Lead, Vitamin D receptor, Gene by environmental interaction, A longitudinal study
Background
Lead (Pb) is known to increase the risk of cardiovascular diseases (CVD). A recent expert review by the National Toxicology Program (NTP) concluded that there is suffi-cient evidence that long-term cumulative exposure, even at low level exposure, which can be assessed by bone lead levels used in our study, is associated with elevated blood pressure [1]. Several studies have identified a positive
association between lead exposure and high blood pres-sure, which is a major risk factor for CVD. Martin et al. [2] found an association between blood lead levels and in-creases in blood pressure, as well as an association be-tween tibia bone lead levels and hypertension in the Baltimore Memory Study. Cheng et al. [3] reported an in-creased risk of incident hypertension with higher levels of lead in tibia and patella bones in the Normative Aging Study (NAS). Another study, which used the NAS data, found an association between high lead levels in bone and blood and hypertension among subjects with low dietary calcium intake [4]. Blood lead levels have also been * Correspondence:[email protected]
1
Department of Epidemiology, University of Michigan School of Public Health, Ann Arbor, MI, USA
Full list of author information is available at the end of the article
associated with increased risk of pregnancy-induced hypertension [5]. The association between lead expos-ure and the risk of hypertension in pregnant women was also demonstrated even in those with blood lead levels less than 2 μg/dL [6]. Lead exposure may also in-duce endothelial injury and atherosclerosis [7-9]. The study by Perlstein et al. [10] suggests that lead accumula-tion may contribute to the increase in pulse pressure, a measure of arterial stiffness, and with clinical cardiovas-cular events. Zhang et al. [11] also reported a deleterious impact of cumulative lead on pulse pressure with effect modification by hemochromatosis genetic polymorphism in the NAS.
Vitamin D receptor (VDR) is involved in lead absorp-tion and accumulaabsorp-tion [12]. Vitamin D plays an import-ant role in calcium metabolism, which is shared by lead [13]. Calcitriol, an active hormonal form of vitamin D, stimulates increased calcium absorption from the gut during calcium deficiency. Calcitriol also stimulates the expression of genes engaged in absorption of calcium in the intestine. The effects of vitamin D and calcitriol are mediated by their interaction with the VDR. The com-plex of calcitriol and VDR acts as a transcription factor regulating the gene expression of calcium-binding recep-tors. Because lead is a divalent cation, lead competes with calcium to bind to calcium-binding receptors [14]. When calcium levels are low, the calcium-binding pro-tein may bind lead instead of calcium, resulting in ele-vated absorption of lead [15]. The VDR genetic variants have been identified as potential genetic factors that can influence the absorption, retention and accumulation of lead in the human body [12]. Schwartz et al. [16] exam-ined former organolead manufacturing workers and found thatBsm1 variant on the VDR gene modifies the association between age and tibia bone lead levels. In this study, the cumulative level of lead in bone and the rate of reabsorption and excretion of lead over time were higher for those with theVDR Bsm1 variant. This study suggests that theVDRgenetic variant may play a role in susceptibility to lead accumulation.
Vitamin D and VDR are involved in arterial stiffness and arterial aging [17,18]. Vitamin D has been demon-strated to regulate endothelial nitric oxide synthase and arterial stiffness in a mouse study [19]. Lower serum vitamin D3 levels are known to be associated with hypertension [20]. VDR is also involved in the renin-angiotensin system, cell proliferation and differentiation, anti-inflammation, and anti-fibrosis [21]. The effect of VDR on immune response and inflammation has been re-lated to atherosclerosis [22].
There have been studies examining effect modification of lead by VDR in relation to several diseases [23,24]. However, effect modification byVDRgenotype in the as-sociation between lead and subclinical CVD measures,
including arterial stiffness in longitudinal settings, has not yet been examined. In this study, we investigate ef-fect modification by theVDRgene in the association be-tween cumulative lead exposure measured by bone lead levels and pulse pressure, a marker of arterial stiffness.
Methods Study population
The NAS is a longitudinal study of the aging process established by the Veterans Administration in 1963 at the VA Outpatient Clinic in Boston, Massachusetts. The participants were 2,280 mostly White men aged 21 to 80 years with no past or present known chronic condi-tions (heart disease, cancer, recurrent asthma, sinusitis, bronchitis, diabetes, gout, peptic ulcer, or hypertension) [25]. The NAS followed up on the participants every 3 to 5 years.
The NAS participants were invited to obtain bone lead measurements between 1991 and 1999 at the Ambula-tory Clinical Research Center of the Brigham and Women’s Hospital in Boston, Massachusetts (N = 866). Of the participants with bone lead measurements, nine participants were excluded due to unreliable bone lead measurements (detailed description in the lead exposure section). Of 857 participants, 727 participants were suc-cessfully genotyped for at least one single nucleotide poly-morphisms (SNP) on the VDR gene including Bsm1 (rs1544410), Taq1 (rs731236), Apa1 (rs7975232), and Fok1 (rs10735810). The present analysis includes pulse pressure measured at the time of bone lead measure-ment (baseline, 1991–1999) and follow-up data through June 22, 2011. A total of 3,100 observations (727 partici-pants) were used in this study. Each participating institute’s institutional review board approved this study and written informed consent was collected from each participant.
Blood pressure
The participants visited the study center in the morning. The participants were asked not to smoke or drink for at least 12 hours before a visit. Seating systolic blood pres-sure (SBP) and fifth-phase diastolic blood prespres-sure (DBP) were measured to the nearest 2 mmHg. Blood pressures were measured in the left arm and then in the right arm with a standard mercury sphygmomanometer with a 14-cm cuff. The mean measurements of the left and right arms were used in this study. Pulse pressure was calcu-lated as the difference between SBP and DBP.
Lead exposure
[26]. Participants with higher than 10 μg/g or 15 μg/g uncertainty of tibia or patella bone lead levels, respect-ively, (reflecting precision of the estimates) were ex-cluded (n = 9). More details were published in a previous study [27].
Genotyping
Multiplex polymerase chain reaction assays were de-signed with Sequenom Spectro DESIGNER software (Sequenon, Inc, San Diego, CA) by inputting sequences containing the SNP site and 100 base pairs of flanking sequence on either side of the SNP. In the VDR gene, four SNP including Bsm1 (rs1544410),Taq1 (rs731236), Apa1 (rs7975232), and Fok1 (rs10735810) were geno-typed. More details on genotyping were provided in a previous study [27].
Statistical analysis
When the data were investigated without assuming any inheritance models for the SNPs, we observed that a dominant inheritance model (in terms of minor fre-quency allele) fits the data best (data not shown). For dominant model, genotype was coded as 0 if a subject had no minor frequency allele (ancestral type), or was coded as 1 if a subject had one or two minor frequency alleles (variant type). The study population was parti-tioned based on the genotypes and compared with re-gard to baseline characteristics. For each of the four SNPs, the Hardy-Weinberg Equilibrium was checked for an evidence of inbreeding, population stratification, and problems in genotyping.
To account for the repeated measurements on pulse pressure and covariates, linear mixed effects models with random intercepts were implemented. We decomposed age at examination into age-at-baseline and time-since-baseline to capture the time-since-baseline age effect as well as the longitudinal aging effect [28]. The main effects of bone lead levels andVDRgenotype, and their interaction term were fitted adjusting for time-since-baseline and an interaction term between time-since-baseline and bone lead levels in addition to the following covariates: age at baseline, race (White or not), body mass index (BMI), smoking (pack-years), alcohol intake (two or more drinks/day; Yes/No), calcium intake from food (calcium (mg)/day), diabetes status (Yes/No), antihypertensive medication status (Yes/No), family history of hyperten-sion (Yes/No), education (less than high school, high school, some college, or four year college or more), and age at baseline by VDR genotype interaction. The inter-action between time-since-baseline and bone lead would capture different trajectories of pulse pressure over time in relation to bone lead levels. A three-way interaction among time-since-baseline, bone lead and VDR genetic polymorphism was initially considered but not included
in our final model because it was almost null, suggesting that the lead byVDRgenotype interaction did not change over time and that the lead by time-since-baseline inter-action did not differ between the VDR genotypes. The mixed model we used is described as follows:
Yijeβ0þβ1⋅leadþβ2⋅SNPþβ3⋅leadSNP
þβ4⋅timeþβ5⋅leadtimeþcovariatesþuiþij;
where Yij is pulse pressure of subjecti at time j,β0is a fixed intercept, β1-β5are fixed coefficients representing the estimated effects of each following term, ui is the random intercept that reflects unexplained subject to subject heterogeneity that induces correlation among observations from the same subject, andϵijis a random error.
To interpret longitudinal associations of pulse pressure with tibia levels, we computed the predicted values of pulse pressure from the model with the continuous tibia lead variable using the tibia bone lead values at the 25th percentile and the 75th percentile of the distribution at the baseline (time = 0) and after 10 years of follow-up (time = 10) for the ancestral type and variant type, with all covariates held constant at the mean (continuous var-iables) or zero (categorical varvar-iables)
Results
All the four SNPs on the VDR gene,Bsm1,Taq1, Apa1, andFok1, are common SNPs with a minor allele frequency range of 0.37 to 0.45 (Additional file 1: Table S1). All SNPs were in Hardy-Weinberg equilibrium. The Bsm1 is in a strong linkage disequilibrium (r2= 0.92) with Taq1 in this study population but not with Apa1 (r2= 0.54) or Fok1 (r2= 0.001). Genotypes missing rates were low (range: 1 - 6%). Among 727 participants, 442 participants (61%) had at least one copy of theBsm1 minor frequency allele (bb or Bb, variant type) and 238 participants (33%) were homozygous for the major fre-quency allele (BB, ancestral type). Forty seven subjects (6%) had a missingBsm1genotype.
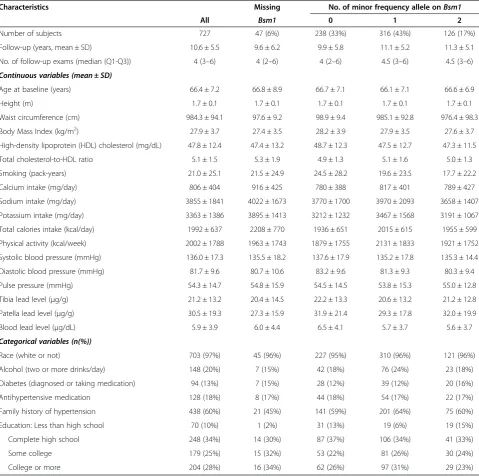
The mean age at baseline of the study population was 66 years (range: 48–93 years). The participants were followed for up to 20 years. The median follow-up period was longer for subjects who had at least one copy of the Bsm1 minor frequency allele than for subjects who did not have the minor frequency allele (12 years vs. 9 years, Table 1). The number of follow-up examina-tions ranged from 1 to 8 with a median of 4. More than half of the participants were examined at least 5 times over 10 years.
medication status (Table 1). Tibia and patella bone lead levels, and the proportion of subjects with a family his-tory of hypertension were slightly lower for those with the missing genotype. In contrast, calcium, sodium, po-tassium, and alcohol intake were slightly higher among subjects with the missing Bsm1 genotype. The baseline characteristics were similar between participants with ancestral type and those with variant type. Participants with ancestral type smoked more, had a higher DBP, and had slightly lower prevalence of whites.
In longitudinal analyses, the two-way interaction be-tween tibia bone lead levels and time-since-baseline was
significant (estimate of the interaction term between tibia bone lead and time-since-baseline in the Bsm1 model: −0.013, 95% CI = (−0.021, −0.005), p = 0.0008; in the Taq1 model: −0.014, 95% CI = (−0.021, −0.006), p = 0.0002), suggesting that the association between bone lead levels and pulse pressure diminished over time. On the other hand, the regression coefficient for the three-way interaction term of VDR genotype, tibia bone lead and time-since-baseline was close to zero (estimate of the three-way interaction term in Bsm1: 0.005, 95% CI = (−0.004, 0.014), p = 0.28; in Taq1: 0.004, 95% CI = (−0.005, 0.013), p = 0.37). This suggests that the difference
Table 1 Characteristics of study population by the number of genetic variants at baseline
Characteristics Missing No. of minor frequency allele onBsm1
All Bsm1 0 1 2
Number of subjects 727 47 (6%) 238 (33%) 316 (43%) 126 (17%)
Follow-up (years, mean ± SD) 10.6 ± 5.5 9.6 ± 6.2 9.9 ± 5.8 11.1 ± 5.2 11.3 ± 5.1
No. of follow-up exams (median (Q1-Q3)) 4 (3–6) 4 (2–6) 4 (2–6) 4.5 (3–6) 4.5 (3–6)
Continuous variables (mean ± SD)
Age at baseline (years) 66.4 ± 7.2 66.8 ± 8.9 66.7 ± 7.1 66.1 ± 7.1 66.6 ± 6.9
Height (m) 1.7 ± 0.1 1.7 ± 0.1 1.7 ± 0.1 1.7 ± 0.1 1.7 ± 0.1
Waist circumference (cm) 984.3 ± 94.1 97.6 ± 9.2 98.9 ± 9.4 985.1 ± 92.8 976.4 ± 98.3
Body Mass Index (kg/m2) 27.9 ± 3.7 27.4 ± 3.5 28.2 ± 3.9 27.9 ± 3.5 27.6 ± 3.7
High-density lipoprotein (HDL) cholesterol (mg/dL) 47.8 ± 12.4 47.4 ± 13.2 48.7 ± 12.3 47.5 ± 12.7 47.3 ± 11.5
Total cholesterol-to-HDL ratio 5.1 ± 1.5 5.3 ± 1.9 4.9 ± 1.3 5.1 ± 1.6 5.0 ± 1.3
Smoking (pack-years) 21.0 ± 25.1 21.5 ± 24.9 24.5 ± 28.2 19.6 ± 23.5 17.7 ± 22.2
Calcium intake (mg/day) 806 ± 404 916 ± 425 780 ± 388 817 ± 401 789 ± 427
Sodium intake (mg/day) 3855 ± 1841 4022 ± 1673 3770 ± 1700 3970 ± 2093 3658 ± 1407
Potassium intake (mg/day) 3363 ± 1386 3895 ± 1413 3212 ± 1232 3467 ± 1568 3191 ± 1067
Total calories intake (kcal/day) 1992 ± 637 2208 ± 770 1936 ± 651 2015 ± 615 1955 ± 599
Physical activity (kcal/week) 2002 ± 1788 1963 ± 1743 1879 ± 1755 2131 ± 1833 1921 ± 1752
Systolic blood pressure (mmHg) 136.0 ± 17.3 135.5 ± 18.2 137.6 ± 17.9 135.2 ± 17.8 135.3 ± 14.4
Diastolic blood pressure (mmHg) 81.7 ± 9.6 80.7 ± 10.6 83.2 ± 9.6 81.3 ± 9.3 80.3 ± 9.4
Pulse pressure (mmHg) 54.3 ± 14.7 54.8 ± 15.9 54.5 ± 14.5 53.8 ± 15.3 55.0 ± 12.8
Tibia lead level (μg/g) 21.2 ± 13.2 20.4 ± 14.5 22.2 ± 13.3 20.6 ± 13.2 21.2 ± 12.8
Patella lead level (μg/g) 30.5 ± 19.3 27.3 ± 15.9 31.9 ± 21.4 29.3 ± 17.8 32.0 ± 19.9
Blood lead level (μg/dL) 5.9 ± 3.9 6.0 ± 4.4 6.5 ± 4.1 5.7 ± 3.7 5.6 ± 3.7
Categorical variables (n(%))
Race (white or not) 703 (97%) 45 (96%) 227 (95%) 310 (96%) 121 (96%)
Alcohol (two or more drinks/day) 148 (20%) 7 (15%) 42 (18%) 76 (24%) 23 (18%)
Diabetes (diagnosed or taking medication) 94 (13%) 7 (15%) 28 (12%) 39 (12%) 20 (16%)
Antihypertensive medication 128 (18%) 8 (17%) 44 (18%) 54 (17%) 22 (17%)
Family history of hypertension 438 (60%) 21 (45%) 141 (59%) 201 (64%) 75 (60%)
Education: Less than high school 70 (10%) 1 (2%) 31 (13%) 19 (6%) 19 (15%)
Complete high school 248 (34%) 14 (30%) 87 (37%) 106 (34%) 41 (33%)
Some college 179 (25%) 15 (32%) 53 (22%) 81 (26%) 30 (24%)
in the association between bone lead and pulse pressure byVDRgenotype was constant during the follow-up.
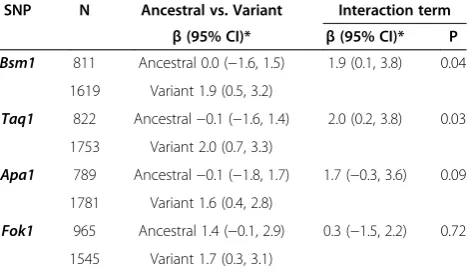
Table 2 shows the estimated regression coefficients and 95% confidence intervals for the association between bone lead and pulse pressure by VDR genotype at base-line (i.e., time is fixed at zero). With an interquartile range (IQR) increase in tibia lead (15 μg/g), pulse pres-sure was 2.5 mmHg (95% CI: 0.4-4.7) greater for the par-ticipants with variant type on Bsm1 compared with the participants with ancestral type (Table 2). With an IQR increase in patella lead (20 μg/g), pulse pressure was 1.9 mmHg (95% CI: 0.1-3.8) greater for the participants with at least one copy of the minor frequency allele in Bsm1compared with the participants without the minor frequency allele (Table 3). Similar results were found for Taq1. The interaction effect was relatively smaller for Apa1andFok1.
In Figure 1, we shows the predicted values of pulse pressure from the model with the continuous tibia lead variable by Bsm1 genotype at baseline (time = 0) and after ten years (time = 10). At baseline, as tibia bone lead level increased from 13μg/g (25thpercentile) to 28μg/g (75thpercentile), pulse pressure increased by 0.07 mmHg (an IQR increase from 50.68 mmHg to 50.75 mmHg) among subjects with Bsm1 ancestral type, while pulse pressure increased by 2.6 mmHg (from 49.68 mmHg to 52.28 mmHg) among subjects with Bsm1 variant type. After ten years, the marginal association (when the two lines were combined ignoring the Bsm1 genotype) be-tween tibia bone lead levels and pulse pressure became weaker. After 10 years of follow-up, as tibia bone lead level increased from 13 μg/g (25thpercentile) to 28 μg/g (75th percentile), pulse pressure decreased by 1.9 mmHg (from 54.09 mmHg to 52.19 mmHg) amongBsm1ancestral type
while pulse pressure increased by 0.63 mmHg (from 53.09 mmHg to 53.72 mmHg) amongBsm1 variant type for the IQR change in tibia lead levels. In spite of the changing association between bone lead levels and pulse pressure over time, the effect modifications byVDR Bsm1 andTaq1genotypes on the association between bone lead levels and pulse pressure persists over time.
We also conducted cross-sectional analyses using base-line data as a sensitivity analysis. The same covariates ex-cept time-since-baseline and its interaction with lead exposure levels were examined. Additional sensitivity ana-lyses were done in order to investigate other possible con-founders. Verifying analytical consistency, the interaction effect of bone lead levels and theVDRgenotype on pulse pressure were examined by (i) adding the square of base-line age, (ii) adding sodium (Na) and potassium (K) intake, (iii) adding heart rate (sitting, beats/min), (iv) adding tri-glyceride level, (v) adding high-density lipoprotein (HDL) and total cholesterol-to-HDL ratio, (vi) adding total calo-ries (kcal/day) and physical activity (expended (fast walk adjusted), kcal/week), (vii) replacing BMI with height and waist circumference, (viii) replacing two alcohol drinks per day with grams per day of alcohol, (ix) replacing smoking in pack-years with current smoker or not, (x) ignoring calcium intake (obtained from a food frequency question-naire), (xi) ignoring observations of subjects who are tak-ing blood pressure control medication, and (xii) separattak-ing the blood pressure control medication variable into two variables: a calcium channel blocker and others.
We found slightly larger beta values in the cross-sectional baseline analyses (Additional file 1: Table S2). The magnitudes of the beta estimates slightly varied by different covariate sets but the conclusions were consist-ent (data not shown).
Table 2 Adjusted changes in pulse pressure (mmHg) with an IQR (15μg/g) increase in tibia lead levels
SNP N Ancestral vs. Variant Interaction term
β(95% CI)* β(95% CI)* P
Bsm1 816 Ancestral 0.1 (−1.8, 1.9) 2.5 (0.4, 4.7) 0.02
1626 Variant 2.6 (1.2, 4.0)
Taq1 827 Ancestral 0.4 (−1.4, 2.2) 2.0 (−0.1, 4.1) 0.06
1760 Variant 2.4 (1.1, 3.8)
Apa1 795 Ancestral 1.5 (−0.4, 3.4) 0.3 (−1.9, 2.4) 0.81
1787 Variant 1.8 (0.4, 3.1)
Fok1 974 Ancestral 2.1 (0.5, 3.7) −0.02 (−2.0, 2.0) 0.99
1548 Variant 2.1 (0.6, 3.6)
SNP: Single Nucleotide Polymorphism; N: Number of observations; IQR: Inter-quartile range; P: p-value of the interaction term; Ancestral: major frequency allele homozygotes; Variant: minor frequency allele homozygotes and heterozygotes.
*To compute effect estimates from longitudinal models, the time term was fixed at zero.
Table 3 Adjusted changes in pulse pressure (mmHg) with an IQR (20μg/g) increase in patella lead levels
SNP N Ancestral vs. Variant Interaction term
β(95% CI)* β(95% CI)* P
Bsm1 811 Ancestral 0.0 (−1.6, 1.5) 1.9 (0.1, 3.8) 0.04
1619 Variant 1.9 (0.5, 3.2)
Taq1 822 Ancestral−0.1 (−1.6, 1.4) 2.0 (0.2, 3.8) 0.03
1753 Variant 2.0 (0.7, 3.3)
Apa1 789 Ancestral−0.1 (−1.8, 1.7) 1.7 (−0.3, 3.6) 0.09
1781 Variant 1.6 (0.4, 2.8)
Fok1 965 Ancestral 1.4 (−0.1, 2.9) 0.3 (−1.5, 2.2) 0.72
1545 Variant 1.7 (0.3, 3.1)
SNP: Single Nucleotide Polymorphism; N: Number of observations; IQR: Inter-quartile range; P: p-value of the interaction term; Ancestral: major frequency allele homozygotes; Variant: minor frequency allele homozygotes
and heterozygotes.
Discussion
Using longitudinal observations, we found a stronger as-sociation between cumulative bone lead levels and pulse pressure in participants with at least one minor fre-quency allele onBsm1orTaq1. The results were consist-ent for tibia and patella bone lead levels. Our results were robust to cardiovascular risk related confounding factors in the sensitivity analyses. To our knowledge, this is the first study showing the interplay of VDR genetic polymorphisms and cumulative lead exposure levels on a CVD subclinical measure in the longitudinal setting.
Pulse pressure is a marker of arterial stiffness, and ele-vated pulse pressure is a risk factor of CVD. Pulse pres-sure has been demonstrated as an independent predictor of long-term cardiovascular mortality. A 10 mmHg in-crease in pulse pressure has been associated with a 10 to 25% increase in risk for CVD related mortality among older adults including coronary heart disease, congestive heart failure, and cerebrovascular disease [29-31]. In the present study, we found that individuals with at least one VDR Bsm1 variant had a 2.5 mmHg greater pulse pressure in relation to every 15μg/g increase in cumula-tive (tibia) lead exposure. We interpret this suggesting that individuals withVDR Bsm1at least one variant may have 2.5% to 6% greater risks for CVD mortality for every 15μg/g increase in cumulative lead exposure.
The two genetic polymorphisms, that we found to interact with the cumulative lead exposure, are common SNPs with minor allele frequency over 0.4 in American Caucasians (Additional file 1: Table S1). Over 65% of European descendants have at least one copy of these genetic polymorphisms, based on HapMap Phase 3 European ancestry samples [32], suggesting that over 65% of European descendants may be susceptible to
cumulative lead exposure related elevation in pulse pres-sure. Thus, the lead by VDR interaction found in this study may explain some portion of CVD events and mortality in the elderly.
Underlying biological mechanisms, by which theVDR genetic polymorphisms may modify the effect of lead on cardiovascular disease, are not well understood. Individ-uals with VDR genetic variants may have higher body burdens of lead, suggesting that the VDR gene may modify the toxicokinetics of lead [12,24,33,34]. In a study of Korean lead workers, blood lead levels and tibia bone lead levels were significantly higher in participants with theVDR Bsm1minor frequency allele [35]. Another study of former organolead manufacturing workers in the eastern United States suggested that theVDR Bsm1 vari-ant influences lead uptake and subsequent release of lead from bone [16]. The interaction between the VDR and lead can be explained by calcium metabolism. The VDR plays a crucial role in calcium absorption and metabolism, which is shared by lead from its divalent cation character-istic. Calcium deficiency was demonstrated to increase lead absorption in the gastrointestinal tract in chicks [36,37]. Ingestion of lead inhibits the effect of vitamin D and its metabolites on intestinal calcium transport in rats [38]. In addition, associations between high bone and blood lead levels and hypertension were also found among subjects with low dietary calcium intake in the NAS [4].
An interaction between the VDR gene and lead was also found to be involved in diverse disease develop-ment processes. In a study of the US general population, adults aged 60 years and older with theVDRrs2239185– rs731236 (Taq1) CC haplotype showed a negative asso-ciation between blood lead and serum homocysteine, a
50.77
50.84 49.77
52.37
49.00 50.00 51.00 52.00 53.00 54.00 55.00
13 28
Pu
lse
p
re
ssur
e
(mmHg)
Tibia lead levels (µg/g)
At baseline
Ancestral Variant
54.18
52.28 53.18
53.81
49.00 50.00 51.00 52.00 53.00 54.00 55.00
13 28
Pu
lse
p
re
ssur
e
(mmHg)
Tibia lead levels (µg/g)
A er 10 years since baseline
Ancestral Variant
Figure 1The predicted values of pulse pressure from the linear mixed model with the continuous tibia lead variable using the tibia bone lead values at the 25thpercentile and the 75thpercentile of the distribution at baseline (left) and after 10 years (right) for the
ancestral type (solid line) and variant (dashed line) ofVDR Bsm1, with all other covariates held constant at the mean (continuous variables: age at baseline (65 yrs), BMI (28 kg/m2), and calcium intake from food (800 mg/day)) or zero (categorical variables: race
risk factor of CVD and neurodegenerative disease, while those with the VDR rs2239185–rs731236 CT or TT showed a positive association [23]. In the same study, adults aged 20 to 59 years of age who had VDR rs2239185–rs731236 CC or TT haplotypes, showed sig-nificant decline in cognitive function with increased blood lead concentration while those CT haplotype did not show significant decline. In a study of lead and cre-atinine among Korean lead workers, the VDR Bsm1 genotype was also found to modify the association be-tween tibia bone lead and renal function as assessed by serum creatinine level and creatinine clearance [24]. The lead workers with at least one minor frequency allele on VDR Bsm1showed worse renal function with higher lead exposure levels. Another study of the Korean lead workers demonstrated an effect modifica-tion of theVDR Bsm1genotype on the association be-tween lead exposure and blood pressure [39]. Among lead workers with theVDR Bsm1variant, SBP were 2.7-3.7 mmHg higher and prevalence of hypertension was higher (OR =2.1). Thus, our results and those of others support the concept of interaction between theVDR ge-notypes and lead.
We observed a significant negative interaction between time-since-baseline and tibia bone lead levels in the lon-gitudinal analyses. The negative interaction can be inter-preted in two different ways: the association between tibia bone lead and pulse pressure may decrease during the follow-up or the association between time-since-baseline and pulse pressure may decrease with higher lead exposure levels. A possible explanation for the de-creasing effect of cumulative lead levels on pulse pressure during the follow-up is that people who had developed health related problems or diseases were more likely to drop out during follow-up [40]. Hence, the participants who stayed longer in the study may be healthier than those who dropped out. Another possible explanation is that other atherosclerotic risk factors became more pro-nounced as the study participants get older. As a result, the association between lead exposure and pulse pressure may seem attenuated over time. Alternatively, we have already reported that bone lead concentrations are falling in these participants, and more quickly for patella lead [41]. This suggests that the weaker associations between the baseline bone lead levels and the follow-up pulse pres-sures could reflect the lower exposure at later follow-up visits. In spite of the changing association between bone lead levels and pulse pressure over time, our main interest, the effect modifications byVDR Bsm1andTaq1genotypes on the association between bone lead levels and pulse pressure were consistent over time (Figure 1).
We see consistent results with regard to Bsm1 and Taq1. These SNPs are closely located to each other in theVDRgene (distance betweenBsm1andTaq1= 1 kilo
base pairs, size of the VDR gene = 63 kilo base pairs). The two SNPs are in high linkage disequilibrium (r2= 0.92). Among participants with at least one minor frequency allele on Bsm1, 98% had at least one minor frequency allele on Taq1. This explains why Bsm1 and Taq1 show similar effect modification signals. And this consistent results support that our finding is less likely to be a false positive from genotyping errors onBsm1or Taq1. In theVDR gene,Bsm1 is located in intron8, and Taq1 is located in exon9. Genetic polymorphisms in in-tron regions, where splice enhances or silencers bind, can have an effect on alternative splicing [42]. More than 60% of the alternatively spliced variants in humans sults in changes in the protein structure which may re-sult in conformational changes [43]. However, whether these SNPs, Bsm1 and Taq1, are the functional poly-morphism with an effect on the structure of vitamin D receptor or on the affinity of the receptor, or whether they are in high linkage disequilibrium with some other functional SNPs is unclear. It should be further investi-gated in animal studies orin vitrostudies.
The strengths of the current study include reliable bone lead measurements and extensive follow-ups up to 20 years (median follow-up of 9 years and median num-ber of follow-up examinations of 4). The repeated mea-surements in pulse pressure and covariates increase statistical power to detect the gene by environment in-teractions. However, the NAS is an older cohort of pre-dominantly white male participants. Hence, the findings may not be generalizable to women, younger individuals, and other ethnicities.
Conclusion
Additional file
Additional file 1: Table S1.Characteristics of genetic markers inVDR gene.Table S2.Adjusted changes in pulse pressure (mmHg) with at least one minor allele inVDRgene per IQR increase in bone lead marker using baseline data.Table S3.Adjusted changes in pulse pressure (mmHg) with an IQR (3μg/dL) increase in blood lead levels.
Abbreviations
BMI:Body mass index; CVD: Cardiovascular diseases; DBP: Diastolic blood pressure; HDL: High-density lipoprotein; IQR: Interquartile range; KXRF: K-x-ray fluorescence instrument; NAS: Normative aging study; NTP: National toxicology program; SBP: Systolic blood pressure; SNP: Single nucleotide polymorphism; VDR: Vitamin D receptor.
Competing interests
The authors declare that they have no competing interests.
Authors’contributions
MAJ carried out statistical analyses and drafted the manuscript. HH, JS, MGW, LHN, DS and PSV contributed to collection of data, interpretation of data, and revision of the manuscript. SKP conceived of the study and participated in its design and coordination and helped to draft the manuscript. All authors read and approved the final manuscript.
Acknowledgements
This work was supported by grants from the National Institute of Environmental Health Sciences (NIEHS) R01-ES05257, R01-ES07821, RO1-ES015172, K01-ES016587, and P30-ES017885. This research was also funded by the University of Michigan M-cubed program. The Veterans Affairs (VA) Normative Aging Study is supported by the Cooperative Studies Program/Epidemiology Research and Information Center of the US Department of Veterans Affairs and is a component of the Massachusetts Veterans Epidemiology Research and Information Center, Boston, Massachusetts. Support was also provided by a VA Research Career Scientist award to David Sparrow.
Author details
1Department of Epidemiology, University of Michigan School of Public
Health, Ann Arbor, MI, USA.2Dalla Lana School of Public Health, University of Toronto, Toronto, ON, Canada.3Department of Environmental Health, Harvard School of Public Health, Boston, MA, USA.4School of Health Sciences, Purdue University, West Lafayette, IN, USA.5Veterans Affairs Boston Healthcare System and Boston University School of Medicine & Public Health, Boston, MA, USA.
Received: 8 July 2014 Accepted: 27 December 2014 Published: 13 January 2015
References
1. National Toxicology Program (NTP). NTP monograph: health effects of low-level lead. In: National Toxicology Program, National Institute of Environ-mental Health Sciences. Research Triangle Park, NC: U.S: Department of Health and Human Services; 2012.
2. Martin D, Glass TA, Bandeen-Roche K, Todd AC, Shi W, Schwartz BS. Associ-ation of blood lead and tibia lead with blood pressure and hypertension in a community sample of older adults. Am J Epidemiol. 2006;163:467–78. 3. Cheng Y, Schwartz J, Sparrow D, Aro A, Weiss ST, Hu H. Bone lead and
blood lead levels in relation to baseline blood pressure and the prospective development of hypertension the normative aging study. Am J Epidemiol. 2001;153:164–71.
4. Elmarsafawy SF, Jain NB, Schwartz J, Sparrow D, Nie H, Hu H. Dietary calcium as a potential modifier of the relationship of lead burden to blood pressure. Epidemiology. 2006;17:531–7.
5. Yazbeck C, Thiebaugeorges O, Moreau T, Goua V, Debotte G, Sahuquillo J, et al. Maternal blood lead levels and the risk of pregnancy-induced hypertension: the EDEN cohort study. Environ Health Perspect. 2009;117:1526–30. 6. Wells EM, Navas-Acien A, Herbstman JB, Apelberg BJ, Silbergeld EK, Caldwell
KL, et al. Low-level lead exposure and elevations in blood pressure during pregnancy. Environ Health Perspect. 2011;119:664–9.
7. Revis NW, Zinsmeister AR, Bull R. Atherosclerosis and hypertension induction by lead and cadmium ions: an effect prevented by calcium ion. Proc Natl Acad Sci U S A. 1981;78:6494–8.
8. Kaji T, Suzuki M, Yamamoto C, Mishima A, Sakamoto M, Kozuka H. Severe damage of cultured vascular endothelial cell monolayer after simultaneous exposure to cadmium and lead. Arch Environ Contam Toxicol. 1995;28:168–72. 9. Vaziri ND. Mechanisms of lead-induced hypertension and cardiovascular
disease. Am J Physiol Heart Circ Physiol. 2008;295:H454–65. 10. Perlstein T, Weuve J, Schwartz J, Sparrow D, Wright R, Litonjua A, et al.
Cumulative community-level lead exposure and pulse pressure: the normative aging study. Environ Health Perspect. 2007;115:1696–700. 11. Zhang A, Park SK, Wright RO, Weisskopf MG, Mukherjee B, Nie H, et al. HFE
H63D polymorphism as a modifier of the effect of cumulative lead exposure on pulse pressure: the normative aging study. Environ Health Perspect. 2010;118:1261–6.
12. Onalaja AO, Claudio L. Genetic susceptibility to lead poisoning. Environ Health Perspect. 2000;108 Suppl 1:23–8.
13. Feldman D, Pike JW, Glorieux FH. Vitamin D, vol. 2. London, San Diego: Elsevier, Academic Press; 2005.
14. Rosen JF, Pounds JG. Quantitative interactions between Pb2+ and Ca2+ homeostasis in cultured osteoclastic bone cells. Toxicol Appl Pharmacol. 1989;98:530–43.
15. Pounds JG. Effect of lead intoxication on calcium homeostasis and calcium-mediated cell function: a review. Neurotoxicology. 1984;5:295–331. 16. Schwartz BS, Stewart WF, Kelsey KT, Simon D, Park S, Links JM, et al.
Associations of tibial lead levels with BsmI polymorphisms in the vitamin D receptor in former organolead manufacturing workers. Environ Health Perspect. 2000;108:199–203.
17. Cozzolino M, Stucchi A, Rizzo MA, Soldati L, Cusi D, Ciceri P, et al. Reprint of: vitamin D receptor activation and prevention of arterial ageing. Proc Abstr 8th Int Symp Amino Acid Protein Metabol Health Dis. 2013;23(Supplement 1):S31–6. 18. Giallauria F, Milaneschi Y, Tanaka T, Maggio M, Canepa M, Elango P, et al.
Arterial stiffness and vitamin D levels: the Baltimore longitudinal study of aging. J Clin Endocrinol Metab. 2012;97:3717–23.
19. Andrukhova O, Slavic S, Zeitz U, Riesen SC, Heppelmann MS, Ambrisko TD, et al. Vitamin D is a regulator of endothelial nitric oxide synthase and arterial stiffness in mice. Mol Endocrinol. 2014;28:53–64.
20. Goel RK, Lal H. Role of vitamin d supplementation in hypertension. Indian J Clin Biochem. 2011;26:88–90.
21. Yang L, Ma J, Zhang X, Fan Y, Wang L. Protective role of the vitamin D receptor. Cell Immunol. 2012;279:160–6.
22. Falk E. Pathogenesis of atherosclerosis. J Am Coll Cardiol. 2006;47:C7–12. 23. Krieg Jr EF, Butler MA, M-h C, Liu T, Yesupriya A, Dowling N, et al. Lead and
cognitive function in VDR genotypes in the third National Health and Nutrition Examination Survey. Neurotoxicol Teratol. 2010;32:262–72. 24. Weaver VM, Lee B-K, Todd AC, Ahn K-D, Shi W, Jaar BG, et al. Effect
modification byδ-aminolevulinic acid dehydratase, vitamin D receptor, and nitric oxide synthase gene polymorphisms on associations between patella lead and renal function in lead workers. Environ Res. 2006;102:61–9. 25. Bell B, Rose C, Damon A. The normative aging study: an interdisciplinary
and longitudinal study of health and aging. Aging Human Develop. 1972;3:5–17.
26. Kim R, Aro A, Rotnitzky A, Amarasiriwardena C, Hu H. K X-ray fluorescence measurements of bone lead concentration: the analysis of low-level data. Phys Med Biol. 1995;40:1475–85.
27. Wright RO, Silverman EK, Schwartz J, Tsaih SW, Senter J, Sparrow D, et al. Association between hemochromatosis genotype and lead exposure among elderly men: the normative aging study. Environ Health Perspect. 2004;112:746–50.
28. Morrell CH, Brant LJ, Ferrucci L. Model choice can obscure results in longitudinal studies. J Gerontol A Biol Sci Med Sci. 2009;64:215–22. 29. Assmann G, Cullen P, Evers T, Petzinna D, Schulte H. Importance of arterial
pulse pressure as a predictor of coronary heart disease risk in PROCAM. Eur Heart J. 2005;26:2120–6.
30. Baena-Diez JM, Bermudez-Chillida N, Garcia-Lareo M, Olivia Byram A, Vidal-Solsona M, Vilato-Garcia M, et al. Role of pulse pressure, systolic blood pressure, and diastolic blood pressure in the prediction of cardiovascular risk: cohort study. Med Clin. 2008;130:361–5.
32. Altshuler DM, Gibbs RA, Peltonen L, Altshuler DM, Gibbs RA, Peltonen L, et al. Integrating common and rare genetic variation in diverse human populations. Nature. 2010;467:52–8.
33. Xi-Biao Y, Cui-E W, Hua F, Shui-Lian Y, Yi-Wen L, Wei-Min N. Associations of blood lead levels, kidney function, and blood pressure withδ-aminolevulinic acid dehydratase and vitamin d receptor gene polymorphisms. Toxicol Mech Methods. 2003;13:139–46.
34. Rezende V, Barbosa Jr F, Montenegro M, Sandrim V, Gerlach R, Tanus-Santos J. Haplotypes of vitamin D receptor modulate the circulating levels of lead in exposed subjects. Arch Toxicol. 2008;82:29–36.
35. Schwartz BS, Lee BK, Lee GS, Stewart WF, Simon D, Kelsey K, et al. Associations of blood lead, dimercaptosuccinic acid-chelatable lead, and tibia lead with polymorphisms in the vitamin D receptor and [delta]-amino-levulinic acid dehydratase genes. Environ Health Perspect. 2000;108:949–54. 36. Edelstein S, Fullmer CS, Wasserman RH. Gastrointestinal absorption of lead
in chicks: involvement of the cholecalciferol endocrine system. J Nutr. 1984;114:692–700.
37. Fullmer CS. Intestinal lead and calcium absorption: effect of 1,25-dihydroxycholecalciferol and lead status. Proc Soc Exp Biol Med. 1990;194:258–64.
38. Smith CM, DeLuca HF, Tanaka Y, Mahaffey KR. Effect of lead ingestion on functions of vitamin D and its metabolites. J Nutr. 1981;111:1321–9. 39. Lee BK, Lee GS, Stewart WF, Ahn KD, Simon D, Kelsey KT, et al. Associations
of blood pressure and hypertension with lead dose measures and polymorphisms in the vitamin D receptor and delta-aminolevulinic acid dehydratase genes. Environ Health Perspect. 2001;109:383–9.
40. Weuve J. Magnitude matters: beyond detection in the presence of selection in research on socioeconomic inequalities in health. Epidemiology. 2013;24:10–3.
41. Wilker E, Korrick S, Nie LH, Sparrow D, Vokonas P, Coull B, et al. Longitudinal changes in bone lead levels: the VA Normative Aging Study. J Occup Environ Med. 2011;53:850–5.
42. Ward AJ, Cooper TA. The pathobiology of splicing. J Pathol. 2010;220:152–63. 43. Yura K, Shionyu M, Hagino K, Hijikata A, Hirashima Y, Nakahara T, et al.
Alternative splicing in human transcriptome: functional and structural influence on proteins. Gene. 2006;380:63–71.
44. Barry PS. A comparison of concentrations of lead in human tissues. Br J Ind Med. 1975;32:119–39.
45. Bandeen-Roche K, Glass TA, Bolla KI, Todd AC, Schwartz BS. Cumulative lead dose and cognitive function in older adults. Epidemiology. 2009;20:831–9.
doi:10.1186/1476-069X-14-5
Cite this article as:Jhunet al.:Effect modification by vitamin D receptor genetic polymorphisms in the association between cumulative lead exposure and pulse pressure: a longitudinal study.Environmental Health
201514:5.
Submit your next manuscript to BioMed Central and take full advantage of:
• Convenient online submission
• Thorough peer review
• No space constraints or color figure charges
• Immediate publication on acceptance
• Inclusion in PubMed, CAS, Scopus and Google Scholar
• Research which is freely available for redistribution