R E S E A R C H
Open Access
Quantification of the exposure and effects of road
traffic noise in a dense Asian city: a comparison
with western cities
Alan Lex Brown
1*†, Kin Che Lam
2†and Irene van Kamp
3†Abstract
Background:Particularly in Asia, dense, traffic-intense, and usually high-rise cities are increasingly the norm. Is existing knowledge on exposure to road traffic noise, and on people’s response to such exposure, garnered primarily from western cities, equally applicable in these?
Methods:Hong Kong has high population and traffic density and a high-rise building form. Road traffic noise exposure was estimated, and residents’responses to traffic noise measured, for a sample of 10,077 dwellings. Noise level estimates were based on three-dimensional modelling. Best international survey practice measured self-reported annoyance and sleep-disturbance. Benchmark estimates of exposure, and of annoyance and self-reported sleep disturbance, are provided. We compare Hong Kong exposure with those of European cities, and the exposure-response relationship for annoyance in Hong Kong to those reported from elsewhere - based on the tolerance limits of previous syntheses. Exposure-response for self-reported sleep disturbance is also compared.
Results:The distribution of exposures of dwellings in high-rise, high-density, Hong Kong is different from those reported from Europe, but not at the higher noise levels. The exposure-annoyance relationship for road traffic noise was from the same population of exposure-response relationships, being well within the tolerance limits, of studies used to generate the synthesized Miedema and Oudshoorn curves. The exposure-response curve for self-reported sleep disturbance was parallel to that of Miedema and Vos but slightly lower.
Conclusions:The proportion of the Hong Kong population exposed to high levels (>70 dB) is similar to that found in Europe. However, a much higher proportion, compared to European cities, is exposed to Ldenlevels of
60–64 dB, and a much lower proportion to lower levels (<55 dB). There is no evidence that the exposure-response relationships for annoyance and self-reported sleep disturbance in Hong Kong are different from relationships synthesized from earlier studies - despite the western bias and temperate-climate bias in the studies available in the syntheses. This is an important finding for urban planning and traffic noise management of the growing mega-cities in the world whose built forms can be expected to reflect that of Hong Kong more than of cities in the west.
Keywords:Road traffic noise, Exposure, Exposure-response relationships, Annoyance, Sleep disturbance, Hong Kong, Megacities
* Correspondence:Lex.Brown@griffith.edu.au †Equal contributors
1
Urban Research Program, Griffith School of Environment, Griffith University, Nathan, Brisbane, Australia
Full list of author information is available at the end of the article
Background
Exposure and exposure-response to road traffic noise The World Health Organization has highlighted urbanization, economic development and growth in motorized transport as drivers of the growing extent and intensity of environmental risk from road traffic noise [1]. Development of policy and management responses to this risk requires, inter alia, knowledge of the prevalence of exposure to road traffic noise and the relationship between exposure and its human effects.
Hammer et al. [2] note that much of the data on the prevalence of noise exposures in the United States is out-dated and inadequate. Various estimates of popula-tion exposures to environmental noise have been ob-tained by a range of measurement and modelling techniques [3-6]. In Europe, the Environmental Noise Directive [7] has driven more recent estimations of ex-posure using extensive programs of noise mapping of road traffic and other noise sources for European urban agglomerations [8-10]. The European estimates utilize harmonized noise indicators Lden and Lnight: the Lden
(day-evening-night equivalent level) is a metric related to annoyance; Lnight (night equivalent level) is a metric
related to sleep disturbance. Sleep disturbance and an-noyance, mostly from road traffic noise exposure, com-prise the main burden of disease from environmental noise in Europe [1].
Exposure-response relationships for annoyance with road traffic noise have been estimated over many de-cades: amongst the earliest being in France [11], Sweden [12], the UK [13] and the USA [14]. There has been con-siderable variation in the results of individual studies and various syntheses have been performed [15-17]. The most recent meta-analysis was that by Miedema and Oudshoorn [18] who examined twenty-six studies from six European countries and Canada, consisting of a total of 19,172 individuals. They reported the percentage of the community Highly Annoyed (%HA) over an Lden
exposure range of 45–75 dB together with confidence intervals for the population mean %HA. Much of the base data for this meta-analysis is now several decades old, and similarly for the revised international standard ISO 1996–1 [19] and the American standard ANSI 12.9 – Part 4 [20] which provide other yardsticks for exposure-response relationships for transport noise sources. More recent exposure-annoyance studies for road traffic noise have been reported from Europe [21,22] and from Asia [23-25] but there have been no further syntheses, and invariably the authors of any new study have benchmarked their result with the rela-tionship reported by Miedema and Oudshoorn [18].
The effects of noise exposure on sleep have both acute and long-term dimensions, and these are associated with
different noise indicators. Acute effects link with event-related measures while overall sleep parameters link with Lnight, as a whole-of-night indicator. A meta-analysis of
13 subjective self-reported sleep disturbance studies from road traffic noise (9,603 individuals from: 8 studies from Europe, 2 from Canada, 2 from Japan and 1 from Turkey) was reported by Miedema and Vos [26]. It related the percentage of the community who self-reported being Highly Sleep Disturbed (%HSD) to Lnight
over a range of 45 to 65 dB. We note that self-reported sleep disturbance is a subjective measure of the effects of noise on sleep often used in surveys, while more ob-jective polysomnographic measures can be used in ex-perimental settings, but are less suitable in large-scale community surveys.
Road traffic noise and different city form
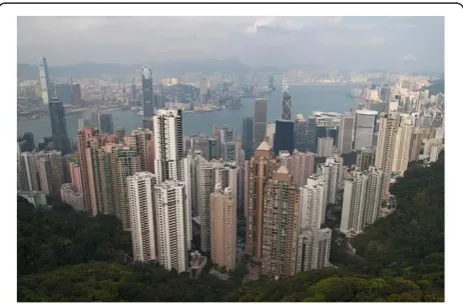
There is a global shift in the centre of gravity of urbanization from the developed to the developing world. In the latter, about half of the population already live in cities and this proportion will be two-thirds by 2050 [27]. By 2025, more than half of the twenty-five megacities in the world will be in Asia, and located in the tropics or sub-tropics [28]. Hong Kong (Figure 1) has one of the world’s highest population densities with most of the population living in high-rise buildings, in-cluding what Yuen and Yeh [29] call super-tall buildings of 50 storeys or more, surrounded by high intensities of road traffic (251 vehicles/road kilometre [30]). Most of the dwellings in Hong Kong are apartments in these high-rise building, typically with two to three bedrooms and mostly in line of sight with nearby or distant road-ways. While the city form of any individual city will depend on topography, planning controls and land eco-nomics, the growing number of large and mega-cities of
Asia and elsewhere will likely be closer in morphology to that of Hong Kong than they will be to the cities of Europe and North America. The high-density ver-tical development and dense road traffic on a limited road network of Hong Kong are being emulated else-where [31].
For this reason, these results from Hong Kong have relevance well beyond this one city. An important ques-tion is whether current knowledge on exposure, and syn-theses of exposure-response relationships, largely based on studies in “western” cities, are applicable in cities across the world, or whether they are shaped by the physical [32] and social characteristics of the cities in which they were conducted. Architectural forms of Hong Kong residential development are highly varied [33] but their common feature is verticality. Hong Kong’s differences also extend beyond built form: it has a monsoonal humid subtropical climate with near uni-versal air-conditioning of domestic premises, and this will change the indoor experience of outdoor noise. Some literature also suggests that the social and cultural background of a population may affect perception of fac-tors such as overcrowding and noise [34], and Ko [35] reported a different sensitivity of Chinese to aircraft noise. Brown [36] however, has refuted evidence of this difference.
This paper examines (1) if the exposure to road traffic noise in a high-rise city, with high population and traffic densities, is different from that in European cities; and (2) if the exposure-response relationships for annoyance and self-reported sleep disturbance in Hong Kong can be considered as drawn from the same population of exposure-response relationships as that on which the Miedema and Oudshoorn [18] and the Miedema and Vos [26] meta-analyses of annoyance and self-reported sleep disturbance responses, respectively, were based.
Methods
A city-wide study was commissioned in the Hong Kong Special Administrative Region (HKSAR). It utilized a large random sample of the population, estimated the exposure of the dwellings of this sample to road traffic noise, and measured annoyance and self-reported sleep responses by questionnaire.
Sample selection and household interviews were con-ducted by the Census and Statistics Department (CSD) ([37]: Appendix one). The population sampled was all residential addresses in the HKSAR—2,292,707 house-holds in which 6,888,080 people resided in 2010. Dwellings were randomly sampled, with prior letters sent to the selected addresses, and house calls be-tween November 2009 and March 2010. An adult aged 18 years or above was randomly selected for interview in each selected household. The survey responses were from
individuals, not aggregated over the household. A total of 10,077 interviews were successfully completed, achieving a 76% response rate overall.
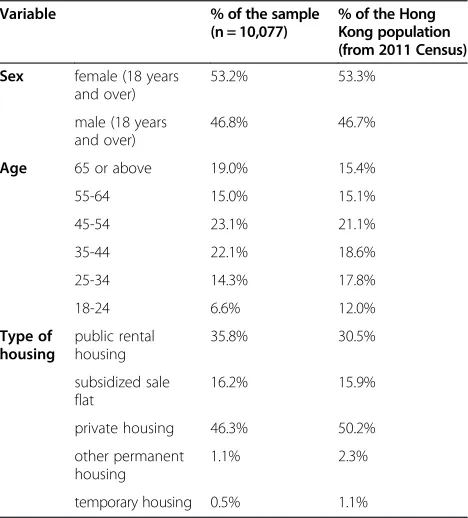
The representativeness of this sample can be con-firmed, in part, by comparing selected demographic and housing characteristics with those available for the whole Hong Kong population in the HKSAR 2011 census [38]. The percentages for the sample and the population in Table 1 demonstrate that the respondents in the survey provide good representation of the Hong Kong popula-tion, though there has been minor oversampling of those aged 65 years and above (likely explained by the higher probability this age group would be at home when sur-veyors called) and some undersampling of the two youn-ger age categories, particularly those aged 18–24. The housing type of those in the sample reflects those in the population across public rental housing, subsidized sale flats, private housing and temporary housing.
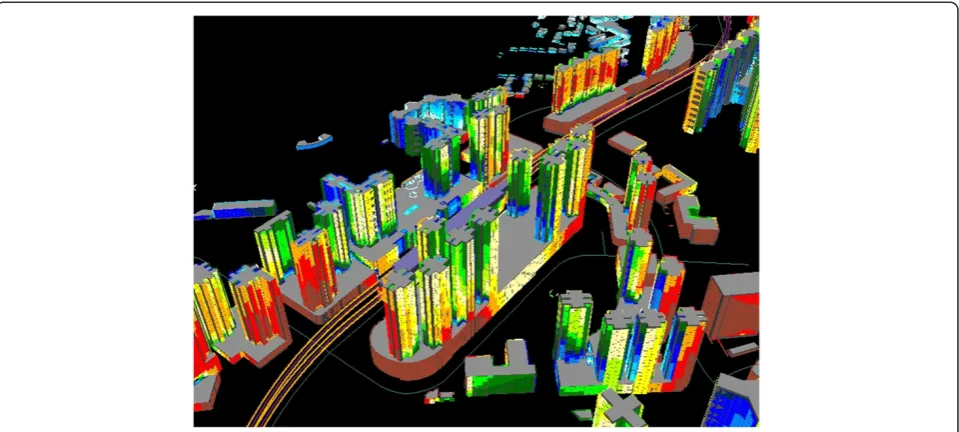
City-wide traffic noise mapping had been conducted using 3D technology [39] and the ISO 9613–2 [40] method including the LimA software [41] adapted for Hong Kong, together with digital topographic, building and traffic data for the year 2010. Figure 2 illustrates the mapping by which Ldenand Lnightwere calculated at the
most exposed façade of each of the 10,077 dwellings in the complex vertical urban form of Hong Kong.
Response to noise was measured as one component of a routine CSD Thematic Household Survey [37]. The
Table 1 Proportion of the sample, and the proportion of the Hong Kong population, female or male, by age category, and by housing type
Variable % of the sample (n = 10,077)
% of the Hong Kong population (from 2011 Census) Sex female (18 years
and over)
53.2% 53.3%
male (18 years and over)
46.8% 46.7%
Age 65 or above 19.0% 15.4%
55-64 15.0% 15.1%
45-54 23.1% 21.1%
35-44 22.1% 18.6%
25-34 14.3% 17.8%
18-24 6.6% 12.0%
Type of housing
public rental housing
35.8% 30.5%
subsidized sale flat
16.2% 15.9%
private housing 46.3% 50.2%
other permanent housing
1.1% 2.3%
noise focus was initially masked with the questionnaire posed as a survey on general environmental issues of the neighbourhood. Face-to-face interviews were conducted in respondents’ households. A rigorous data verification protocol applied by the CSD ensured quality control, with 15% of the households revisited to ascertain reli-ability of answers concerning factual matters, such as the number of rooms in the dwelling. Questionnaire de-sign and application protocol followed the international standard for measurement of annoyance [42].
Annoyance was measured on a 0–10 numeric scale (‘Thinking about the last 12 months or so, when you are here at home, what number from 0 to 10 best shows how much you are bothered, disturbed or annoyed by road traffic?’) with’ not at all’ and ‘extremely’ as end-labels of the scale. Self-reported sleep disturbance was measured on a similar scale (‘…what number from 0 to 10 best shows how much was your sleep disturbed by noise from road traffic?’). Spoken languages in Hong Kong include Cantonese, English and Mandarin, and the questionnaire was prepared in all three. Initially in English, it was translated to colloquial Cantonese and Mandarin then translated back to English as a cross-check. The verbal annoyance descriptors in Cantonese were derived from a pilot test akin to the procedure undertaken by Ma et al. [43] for Mandarin.
The questionnaire also included a noise sensitivity scale, using a revised version of the Weinstein scale [44] and a measure of respondent’s overall satisfaction/ dissatisfaction with their residential area (defined as their residential “estate/street block”) as a place to live. The latter question was asked early in the interview before respondents were aware the survey focussed on noise.
Results
Exposure of the Hong Kong population to road traffic noise
The level of road traffic noise (Lden) at the most exposed
façade of the 10,077 dwellings in the sample of Hong Kong households is shown in Figure 3. To facilitate comparison with exposures of European cities, these are reported as incident levels with no inclusion of the sound reflected from the building façade of interest [7,45,46] though reflections from other building fa-cades in the area had been included in the prediction modelling.
Figure 2An example of the application of 3D noise mapping of high-rise residential building facades.
Given the large sample size, and the random selection from a sampling frame of all households in the HKSAR, Figure 3 is a good estimate of the road traffic noise expos-ure of the dwellings of the Hong Kong population. Lden
levels ranged from 30 dB to 80 dB, with a median exposure of 59 dB. This is some 4 dB higher than the estimated me-dian of 55 dB in European cities [10] and, at least initially, appears to support suggestions that traffic noise levels may be higher in Asian than Western cities [25,47,48].
Extent of annoyance and self-reported sleep disturbance from road traffic noise
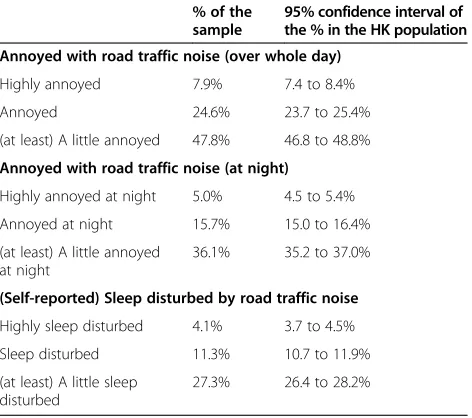
The extent of annoyance and self-reported sleep disturb-ance from road traffic noise in the Hong Kong population has been estimated from the survey results. Based on re-sponses from the annoyance, annoyance at night and sleep disturbance questions, and utilizing the same cut-offs used by Miedema and Oudshoorn [18] for 11-point scales, re-sults are reported in Table 2 as %HA (percentage highly annoyed), %A (percentage annoyed), and %LA (percentage (at least) a little annoyed), with equivalents for self-reported sleep disturbance. The 95% confidence intervals for estimates of the proportion of the adult population in Hong Kong annoyed or sleep disturbed are also shown.
Exposure-response relationships for annoyance and self-reported sleep disturbance in Hong Kong
The %HA with road traffic noise was calculated within each 1 dB exposure band. Various models regressing % HA with Lden were examined, and a quadratic model
was the best fit (R2= 0.912). The fitted model over the range from 42 dB to 77 dB Lden is shown in Figure 4
(%HA = 77.36 – 3.102Lden+ 0.0323Lden2 ). Levels below
42 dB were excluded because of estimation method uncertainty at these low levels, and there were fewer than 10 respondents exposed in each 1 dB band above 77 dB and these too were excluded.
As for annoyance, the %HSD with road traffic noise was calculated within each 1 dB band of exposure and regressed against Lnight. Figure 5 shows the best-fit
quad-ratic model (%HSD = 22.64–1.1245Lnight+ 0.0148Lnight2 )
over the range from 42 dB to 69 dB (R2= 0.629). Expo-sures above 69 dB Lnight were excluded because there
were 10 or less respondents exposed in the 1 dB bands above this level.
Moderating variables
Various authors e.g. [49,50] have examined confounders and effect modifiers in exposure-response relationships. Table 2 Estimates of the proportion of the population of
Hong Kong annoyed, or self-reporting sleep disturbance, by road traffic noise
% of the sample
95% confidence interval of the % in the HK population Annoyed with road traffic noise (over whole day)
Highly annoyed 7.9% 7.4 to 8.4%
Annoyed 24.6% 23.7 to 25.4%
(at least) A little annoyed 47.8% 46.8 to 48.8%
Annoyed with road traffic noise (at night)
Highly annoyed at night 5.0% 4.5 to 5.4%
Annoyed at night 15.7% 15.0 to 16.4%
(at least) A little annoyed at night
36.1% 35.2 to 37.0%
(Self-reported) Sleep disturbed by road traffic noise
Highly sleep disturbed 4.1% 3.7 to 4.5%
Sleep disturbed 11.3% 10.7 to 11.9%
(at least) A little sleep disturbed
27.3% 26.4 to 28.2%
Figure 4The %HA with road traffic noise.The data points are the %HA within each 1 dB interval of exposure over the Lden range of 42 to 77 dB. The best fit quadratic exposure-response regression model is shown, together with 95% upper and lower confidence bounds.
In the present study, a binary logistic regression analysis (IBM SPSS Statistics, Version 21) was conducted using the exposure (Lden) and individual annoyance outcome
of all respondents in the sample (n = 10,077), to assess if select variables intervened in the relationship. For this analysis, a respondent’s annoyance was coded as “1” Highly Annoyed, for a score of 8, 9 or 10 on the 0–10 numeric annoyance scale, or “0” Not Highly Annoyed, for all other scores. Four independent variables were examined: two related to the high-rise built form of Hong Kong that could potentially be confounders, and two that were personal factors known to be significant effect modifiers from previous studies [49]. The variables included in the logistic regression were:
Floor Level of the respondent’s quarters, categorized as low (0 to 15th floor), mid (16th to 35th floor) or high (36th to 71st floor). These category bounds were based on equal intervals of the logarithm of vertical propagation distance from surface roadway sources to higher floors;
Public (0) or Private (1) ownership of the respondent’s living quarters. Such ownership status is a primary discriminant of the morphological characteristics of residential buildings in Hong Kong (see Reference 33, Table1);
Noise Sensitivity. Overall noise sensitivity scores were classified by tertile cut-offs as High, Medium or Low [51];
respondents’satisfaction with their residential area coded as“1”Dissatisfied and“0”Not Dissatisfied.
Predictor variables were entered in the logistic regres-sion in blocks, with noise exposure Ldenin the first step,
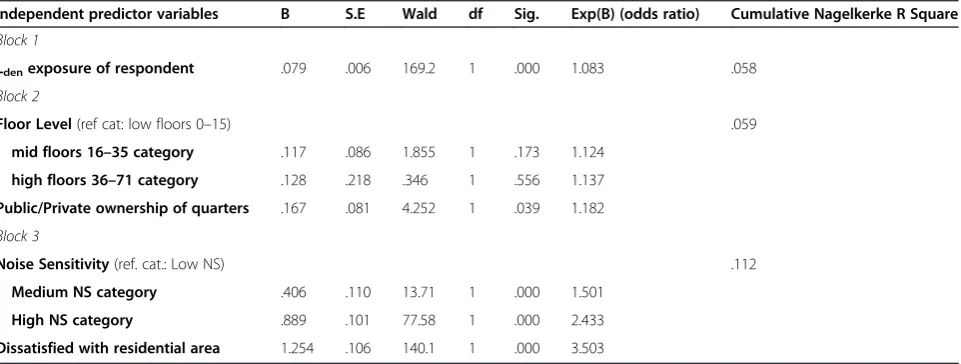
the built-form variables in the second and personal vari-ables in the third step. Table 3 shows results from the lo-gistic regression. The Wald criterion demonstrated that Floor Level was not significant in predicting Highly Annoyed respondents. All other variables were signifi-cant, though the Public/Private ownership was only mar-ginally so.
The odds ratios in Table 3 show that respondents in medium and high Noise Sensitivity categories were 1.5 and 2.4 times more likely to be Highly Annoyed than were respondents in the low Noise Sensitivity category. Respondents who were dissatisfied overall with their residential area were 3.5 times more likely to be Highly Annoyed than respondents not dissatisfied with their area. Noise Sensitivity and overall satisfaction with the living environment, are effect modifiers. However, while the logistic regression, by including successive blocks of variables in the analysis has resulted in an increase in the Nagelkerke R Square statistic, the overall ability of the model to predict individual respondents who were Highly Annoyed remains low (Nagelkerke’s R Square = .112).
A binary logistic regression analysis of the relationship between road traffic noise exposure (Lnight) of
respon-dents and their sleep disturbance outcomes produced analagous results and is not reported here.
Discussion
This Hong Kong study is one of the largest exposure-response studies for road traffic noise ever undertaken. The size of the sample (n = 10,077) was greater than the total number of subjects utilized in the Miedema and Vos [26] 13-study self-reported sleep disturbance meta-analysis, and more than half of all the subjects utilized
Table 3 Binary logistic regression of highly annoyed respondents on noise exposure, testing significance levels of potential confounder variables (floor level and public/private status) and effect modifiers (noise sensitivity and overall satisfaction/dissatisfaction with the neighbourhood)
Independent predictor variables B S.E Wald df Sig. Exp(B) (odds ratio) Cumulative Nagelkerke R Square
Block 1
Ldenexposure of respondent .079 .006 169.2 1 .000 1.083 .058
Block 2
Floor Level(ref cat: low floors 0–15) .059
mid floors 16–35 category .117 .086 1.855 1 .173 1.124
high floors 36–71 category .128 .218 .346 1 .556 1.137
Public/Private ownership of quarters .167 .081 4.252 1 .039 1.182
Block 3
Noise Sensitivity(ref. cat.: Low NS) .112
Medium NS category .406 .110 13.71 1 .000 1.501
High NS category .889 .101 77.58 1 .000 2.433
in the Miedema and Oudshoorn [18] 26-study annoy-ance meta-analysis. The large sample, rigorous random sampling of the HKSAR adult population, a response rate of 76%, estimation of road traffic noise exposure in-cident at each individual dwelling, and application of best international practice in the measurement of annoy-ance and self-reported sleep disturbannoy-ance, have produced benchmark estimates in this study of the exposure and responses of the Hong Kong population to road traffic noise.
Comparing exposure to road traffic noise in Hong Kong and elsewhere
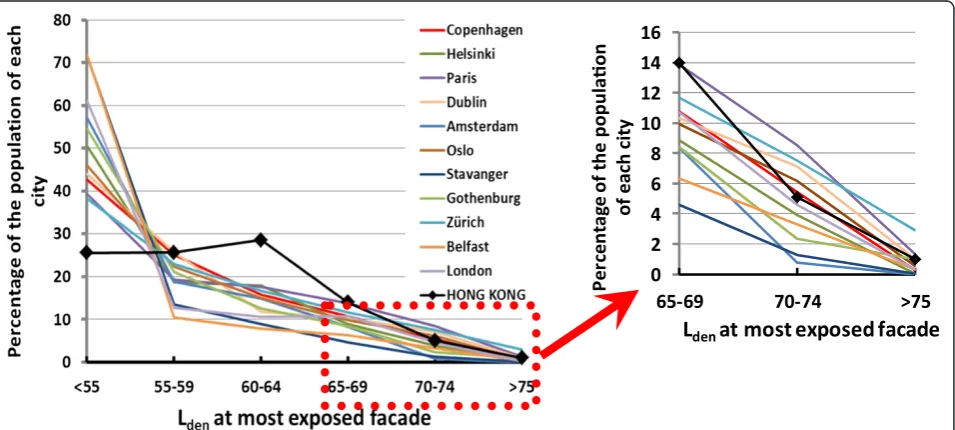
The exposure of the Hong Kong population to road traf-fic noise can be compared with recent estimates from Europe. Figure 6 plots the Hong Kong exposure with that of a selection of European cities [10] including two with population sizes similar to Hong Kong (Paris and London), several cities of one million population, and two smaller cities. The European data is in 5 dB bands with no reporting of exposures less than 55 dB. In Figure 6, the“<55 dB”category has been calculated as the balance of the city populations whose exposure has not been estimated. The Hong Kong data, originally in 1 dB bands and estimated to levels as low as 30 dB, have been transformed into 5 dB bands in Figures 6, and con-catenated to the range reported from Europe.
The differences between the Hong Kong exposures and that of the European cities are striking except at the high end of exposure, and consistent across all the comparison cities. The proportion of the population in Hong Kong exposed to the higher levels of road
traffic noise is similar to that in European cities, but a much higher proportion of the Hong Kong popula-tion is exposed to levels of road traffic noise in the band 60–64 dB, and a much lower proportion to the lower levels of exposure experienced in European cities (<55 dB).
We explain this in terms of the compact and vertical nature of urban development in Hong Kong. There is close proximity of some dwellings to roadways with con-sequent high noise exposures, but this occurs in nearly all cities: whether in Hong Kong, Europe or North America. What is different is that, in most other cities, a significant proportion of dwellings are also located at considerable distances from major roadways (see, for ex-ample, Brown and Lam [52]) and this proportion, if the development is not high-rise, benefits from acoustic shielding provided by intermediate buildings along the propagation path—resulting in something of the order of half of the populations of many cities being exposed to lower levels of road traffic noise (say < 55 dB). The high-rise buildings together with high traffic density, in Hong Kong, result in nearly all dwellings having line-of-sight to a roadway noise source, though exposure levels at many will be moderated because of the large path length distances from the roadways to the upper floors of high buildings. This deprives them of much of the shielding effect along the source-to-receiver path that is provided by the urban fabric of low-rise cities. Thus, Hong Kong is noisier, but not predominantly in terms of intensity and extensity of higher noise levels, but through the bulge in exposures to Lden levels in the 55 to 69 dB
bands.
Figure 7 makes the same comparison between Hong Kong and European cities, but in terms of road traffic noise exposures in the night hours (Lnight). The patterns
of difference, and the explanations, parallel those for Ldenin Figure 6.
Comparing road traffic exposure-response relationships in Hong Kong and elsewhere
How does the exposure-annoyance relationship for road traffic noise in Hong Kong compare to that from the Miedema and Oudshoorn [18] synthesis? Both curves are shown in Figure 8 over the range 45 to 75 dB Lden.
At levels to about 60 dB, the Hong Kong response is close to that of the population mean responses reported by Miedema and Oudshoorn [18] but at higher levels the curves diverge, with a lower %HA in Hong Kong. The differences are not particularly large: 4% and 7% at levels of 65 and 70 dB respectively, increasing to near 10% at 75 dB. The difference can also be compared by noting that, in Hong Kong, the level at which 20% of the population is Highly Annoyed with road traffic noise is 4 dB higher than estimated from the synthesized curve. The most important question is: can the relationship found in the Hong Kong study be considered as drawn from the same population of exposure-response relation-ships as were the original studies included in the meta-analysis?
Groothuis-Oudshoorn and Miedema [53] indicate that the tolerance interval of the exposure-response curve synthesized from their meta-analysis, rather than its confidence interval, provides bounds within which (say 95% of ) any new randomly drawn exposure-annoyance curve should fall. The 95% tolerance interval for the Miedema and Oudshoorn [18] synthesis is shown shaded in Figure 8 and the Hong Kong curve falls well within this interval. Effectively, this means that, despite the western bias in the selection of exposure-response
studies used in their meta-analysis, the new Hong Kong curve is from the same population of exposure-response relationships used to generate the synthesized Miedema and Oudshoorn [18] curve.
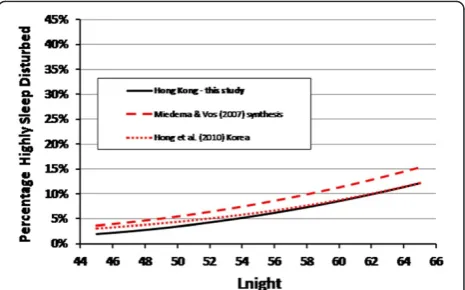
The Hong Kong exposure-response curve for self-reported sleep disturbance from road traffic noise can also be compared (Figure 9) though this is only partial in the absence of tolerance limits from the sleep meta-analysis. The figure shows that the %HSD for the Hong Kong population parallels that of the Miedema and Vos [26] synthesis of previous studies, but is slightly lower. The %HSD exposure-response from a Korean road traf-fic study [54] is also shown. The similarity of the three curves, one based on the synthesis of largely European studies, and two from single-city Asian studies, suggests that there may not be any underlying differences
Figure 7The percentage of each city population exposed to road traffic noise (Lnight) in 5 dB bands.For Hong Kong and a selection of European cities of different population size.
Figure 8Comparison of the exposure-response model of %HA with road traffic noise in Hong Kong with that synthesized by Miedema and Oudshoorn [18].The 95%tolerance intervalof the synthesized exposure-response curve from the meta-analysis of 26 previous studies [18] is shown shaded.
between self-reported sleep disturbance from road traffic noise responses in Europe and in Asia. The Korean authors had also noted the predominance of studies of European origin included in the Miedema and Vos [26] meta-analysis.
Other observations
While we have demonstrated that the exposure-response relationship for road traffic noise annoyance in Hong Kong falls within the tolerance limits of the synthesized curve from Miedema and Oudshoorn [18], it is still use-ful to consider two study-specific physical factors that could have contributed to the different, somewhat lower, mean response in Hong Kong.
The first is the potential for greater differences be-tween external noise levels and internal noise levels as a result of the extensive use of air-conditioning in Hong Kong’s subtropical climate. Exposure-response curves are constructed on road traffic noise levels incident on the external façade, but there is logic in considering that the response may be shaped by the levels experienced inside the dwelling. Hong Kong has near universal installation of air-conditioning in dwellings—only 4% of the survey respondents reported their dwelling had none—and some 90% had air-conditioners fitted in their bedrooms, 93% in the living rooms. It is not that the acoustic properties of the window/façade material in air-conditioned premises would consistently be different to those of dwellings in other climatic zones, but the be-haviour of residents with respect to ventilation may be. There is a lack of empirical data, but anecdotally the op-eration of air conditioning tends to be associated with complete closure of windows whereas, with the heating of dwellings in temperate climates, a high proportion of the community is known to crack windows slightly open for ventilation during sleep [55]. Complete window clos-ure would result in lower internal noise for a given external noise exposure, potentially shifting an annoyance-response curve downwards. Future studies in both tropical and temperate climates need to measure, diurnally and seasonally, detailed window-closing behaviour.
Secondly, for dwellings with high noise exposures lo-cated many storeys above ground level, there may be a difference in the nature of the road traffic noise signal experienced. These elevations (for example say, at 60 storeys) mean long propagation paths from the surface traffic sources to the dwellings. Transmission of road traffic noise signals over these distances changes the na-ture of the traffic noise signal towards one with a lower variability in levels. This means that respondents in Hong Kong at higher storeys may experience a reduced “noise climate”, with maximum levels from traffic emerging less above the background traffic levels than would respondents experiencing the same Lden at lower
floors, or as would tend to be experienced in a low-rise city. Noise events may thus be less noticeable in this situ-ation, and there are indications that sleep disturbance from road traffic noise, and perhaps annoyance [56], may depend on the number of noise events experienced. While Floor Level of the respondent’s apartment was not a significant variable in the logistic regression analysis, differences in the noise climate experienced at different building elevations should be investigated in future stud-ies of exposure-response in high-rise citstud-ies.
Conclusions
The proportion of the population in Hong Kong exposed to high levels of road traffic noise (>70 dB) is similar to that found in cities in Europe. However, a much higher proportion of the population in Hong Kong compared to European cities is exposed to Lden levels of road traffic
noise of 60–64 dB, and a much lower proportion to the lower levels (<55 dB). We have explained this as a conse-quence of the high-rise built form of Hong Kong where there is both high population and high traffic density. The exposure-annoyance response relationship for road traffic noise in Hong Kong falls well within the tolerance limits of the Miedema and Oudshoorn [18] synthesized exposure-annoyance curve for the percentage of the population highly annoyed with road traffic noise. Fit within a toler-ance interval, rather than a confidence interval, is appropri-ate in comparing the exposure-response relationship from a single new study with the results of a prior synthesis of exposure-response relationships. The percentages of the Hong Kong population who reported they were highly sleep disturbed by road traffic noise also closely follows the exposure-response relationship for high self-reported sleep disturbance based on the pooled data used by Miedema and Vos [26]. There has been a Western bias, and a temperate-climate bias, in the studies used in prior meta-analyses of human responses to road traffic noise. How-ever, the exposure-response relationships for annoyance and self-reported sleep disturbance reported from the high-density, high-rise, sub-tropical city of Hong Kong are not inconsistent with these. This is an important finding for future urban planning and traffic noise management of many of the projected mega-cities in the world that will be located in non-temperate climatic zones in Asia and else-where and whose urban forms can be expected to reflect that of Hong Kong more than of cities in the west.
Abbreviations
dB:decibel; CSD: Census and Statistics Department; HKSAR: Hong Kong Special Administrative Region; Lden: Day-evening-night equivalent sound level; Lnight: Night equivalent sound level; NS: Noise sensitivity; %HA: Percentage highly annoyed; %A: Percentage annoyed; %LA: Percentage (at least) a little annoyed; %HSD: Percent highly sleep disturbed.
Competing interests
Authors’contributions
ALB, KCL and IVK contributed equally to the analysis and reporting. All authors read and approved the final manuscript.
Acknowledgements
Sabine Janssen (TNO) brought the use of tolerance intervals to our attention and provided data on this interval from the Miedema and Oudshoorn [18] analysis. The study from which the data in this paper has been extracted has been reported on the website of the EPD of the HKSAR.
Author details
1Urban Research Program, Griffith School of Environment, Griffith University,
Nathan, Brisbane, Australia.2Department of Geography and Resource Management, The Chinese University of Hong Kong, Hong Kong, China. 3
National Institute for Public Health and the Environment, Centre for Sustainability, Environment and Health, Bilthoven, The Netherlands.
Received: 19 June 2014 Accepted: 25 February 2015
References
1. Fritschi L, Brown AL, Kim R, Schwela DH, Kephalopoulos S. Burden of disease from environmental noise: Quantification of healthy life years lost in Europe. Copenhagen: World Health Organization, Regional Office for Europe; 2011.
2. Hammer MS, Swinburn TK, Neitzel RL. Environmental noise pollution in the United States: developing an effective public health response. Environ Health Perspect. 2014;122:115–9. http://dx.doi.org/10.1289/ehp.1307272. 3. Hansen MA. National ambient noise survey. Washington, DC: US
Environmental Protection Agency; 1982.
4. Brown AL, Bullen RB. Road traffic noise exposure in Australian capital cities. Acoust Aust. 2003;31:17–22.
5. Skinner CJ, Grimwood CJ. The UK Noise Climate 1990–2001: population exposure and attitudes to environmental noise. Appl Acoust. 2005;66:231–43.
6. Tsai KT, Lin MD, Chen YH. Noise mapping in urban environments: a Taiwan study. Appl Acoust. 2009;70:964–72.
7. Council Directive 2002/49/EC of the European Parliament and of the Council of 25 June 2002 relating to the assessment and management of environmental noise: Official Journal of the European Communities. 2002; L 189:12–25.
8. De Vos P, Licitra G. Noise maps in the European Union: An overview. In: Licitra G, editor. Noise Mapping in the EU: Models and Procedures. 13th ed. Boca Raton: CRC Press; 1993. p. 285–310.
9. European Commission. Assessment of Exposure to Noise (WG-AEN) Position Paper: Good Practice Guide for Strategic Noise Mapping and the Production of Associated Data on Noise Exposure. Version 2. Brussels: European Commission DG Environment; 2007.
10. EEA (European Environment Agency). Noise Observation and Information Service for Europe; 2013. Available: http://noise.eionet.europa.eu/viewer.html [accessed 12 October 2013]
11. Lamure C, Barcelon M. La gene du au bruit de la circulation automobile: Une enquête auprès de rverains d’autoroutes, Cahiers du Centre Scientifique et Technique du Bâtiment. 88th ed. 1967.
12. Fog H, Jonsson E. Traffic noise in residential areas. Stockholm: National Swedish Institute for Building Research; 1968. Report 36E.
13. Griffiths ID, Langdon FJ. Subjective response to road traffic noise. J Sound Vib. 1968;8:16–32.
14. Galloway WJ, Clark WE, Kerrick JS. Highway noise: Measurement, simulation and mixed reaction. National Co-operative Highway Research Program. Washington DC: Highway Research Board; 1969. Report 78.
15. Schultz THJ. Synthesis of social surveys on noise annoyance. J Acoust Soc Am. 1978;64:377–405.
16. Fidell S, Barber DS, Schultz TJ. Updating a dosage-effect relationship for the prevalence of annoyance due to general transportation noise. J Acoust Soc Am. 1991;89:221–33.
17. Miedema HME, Vos H. Exposure-response relationships for transportation noise. J Acoust Soc Am. 1998;104:3432–45.
18. Miedema HME, Oudshoorn CG. Annoyance from transportation noise: relationships with exposure metrics DNL and DENL and their confidence intervals. Environ Health Perspect. 2001;109:409–16.
19. ISO 1996–1. Acoustics. Description, measurement and assessment of environmental noise—Part 1: Basic quantities and assessment procedures. Geneva, Switzerland: International Standards Organization; 2003. 20. ANSI 12.9. Quantities and procedures for description and measurement of
environmental sound - Part 4: Noise assessment and prediction of long-term community response. New York: American National Standards Institute; 1996.
21. Klæboe R, Amundsen AH, Fyhri A, Solberg S. Road traffic noise–the relationship between noise exposure and noise annoyance in Norway. Appl Acoust. 2004;65:893–912.
22. Jakovljevic B, Paunovic K, Belojevic G. Road-traffic noise and factors influencing noise annoyance in an urban population. Envir Intl. 2009;35:552–6.
23. Ota A, Yokoshima S, Tamura A. Comparison of dose–response relationships among different traffic noises - Social survey on residential areas exposed to combined noises. In: Proceedings of InterNoise07 Istanbul, Turkey. 2007. p. 1584–91.
24. Yano T, Sato T, Morihara T. Dose–response relationships for road traffic, railway and aircraft noises in Kyushu and Hokkaido, Japan. In: Proceedings of InterNoise07 Istanbul, Turkey. 2007. p. 1576–83.
25. Phan HYT, Yano T, Phan HAT, Nishimura T, Sato T, Hashimoto Y. Community responses to road traffic noise in Hanoi and Ho Chi Minh City. Appl Acoust. 2010;71:107–14.
26. Miedema HME, Vos H. Associations between self-reported sleep disturbance and environmental noise based on reanalyses of pooled data from 24 studies. Behav Sleep Med. 2007;5(1):1–20.
27. Montgomery MR. The urban transformation of the developing world. Science. 2008;319:761–4.
28. UN Habitat. State of the World’s Cities 2012–2013. 2013. Available: http://unhabitat.org/books/mid-term-evaluation-of-the-cities-and-climate-change-initiative/ [accessed 9 March, 2015].
29. Yuen BKP, Yeh AGO. Introduction: High-rise living in Asian cities. In: Yuen BKP, Yeh AGO, editors. High-Rise Living in Asian Cities. New York: Springer; 2011. p. 1–8.
30. World Bank World Development Indicators: Traffic and congestion. 2013. Available: http://wdi.worldbank.org/table/3.13 [accessed 21 Oct. 2013]. 31. Lau SSY. The physical environment of tall residential buildings: the case of
Hong Kong. In: Yuen BKP, Yeh AGO, editors. High-Rise Living in Asian Cities. New York: Springer; 2011. p. 25–47.
32. Wang B, Kang J. Effects of urban morphology on the traffic noise distribution through noise mapping: a comparative study between UK and China. Appl Acoust. 2011;72:556–68.
33. Lam KC, Ma WC, Chan PK, Hui WC, Chung KL, Chung YTT. Relationship between road traffic noisescape and urban form in Hong Kong. Environ Monit Assess. 2013;185:9683–95.
34. Jenks M. The acceptability of urban intensification. In: Williams K, Burton E, Jenks M, editors. Achieving Sustainable Urban Form. London: E & FN Spon; 2000. p. 242–50.
35. Ko NWM, Lei PEI. Subjective responses of Chinese to aircraft noise. Appl Acoust. 1982;15:251–61.
36. Brown AL. Critique of subjective responses of Chinese to aircraft noise. Appl Acoust. 1984;17:223–32.
37. Census and Statistics Department, HKSAR. Thematic Household Survey Report No. 48 2012, Appendix one: Survey Methodology 101–105. Available: http://www.statistics.gov.hk/pub/B11302482011XXXXB0100.pdf [accessed 13 October 2013].
38. Census and Statistics Department, HKSAR. 2011 Population Census (Tables A103, E306). Available: http://www.census2011.gov.hk/en/main-table.html [accessed 17 January 2015].
39. Law CW, Lee CK, Lui ASW, Yeung MKL, Lam KC. Advancement of three-dimensional noise mapping in Hong Kong. Appl Acoust. 2011;72:534–43.
40. ISO 9613–2: 1996. Acoustics–Attenuation of Sound During Propagation Outdoors Part 2–General Methods of Calculation. Geneva, Switzerland: International Standards Organization; 1996.
41. Bruel and Kjaer 2013. Predictor LimA Software Suite Type 7810. Available: http://www.bksv.com/Products/EnvironmentManagementSolutions/Noise% 20Mapping%20and%20Prediction/predictor-lima-7810.aspx [accessed 14 October 2013].
43. Ma H, He Y, Gao H, Jiang G, Jiang Z, Liu X. International joint study on the measurement of community response to noise: construction of noise survey question and noise annoyance scale (in Chinese). Acta Acustica. 2003;28:309–14.
44. Kishikawa H, Matsui M, Uchiyama I, Miyakawa M, Hiramatsu K, Stansfeld SA. The development of Weinstein’s noise sensitivity scale. Noise Health. 2006;8:154–60.
45. Abbott PG, Nelson PM. Converting the UK traffic noise index LA10,18hto EU noise indices for noise mapping, Transport Research Laboratory: Project Report PR/SE/451/02. 2002.
46. Memoli G, Paviotti M, Kephalopoulos S, Licitra G. Testing the acoustical corrections for reflections on a façade. Appl Acoust. 2008;69:479–95. 47. Leong ST, Laortanakul P. Monitoring and assessment of daily exposure of
roadside workers to traffic noise levels in an Asian city: a case study of Bangkok streets. Environ Monit Assess. 2003;85:69–85.
48. Puchera J, Korattyswaropama N, Mittala N, Ittyerah N. Urban transport crisis in India. Transport Policy. 2005;12:185–98.
49. Fields J. Effect of personal and situational variables on noise annoyance in residential areas. J Acoust Soc Am. 1993;93:2753–63.
50. Guski R. Personal and social variables as co-determinants of noise annoyance. Noise Health. 1999;1:45–56.
51. Van Kamp I, Job RFS, Hatfield J, Haines M, Stellato RK, Standfeld SA. The role of noise sensitivity in the noise-response relation: a comparison of three international airport studies. J Acoust Soc Am. 2004;116:3471–9. 52. Brown AL, Lam KC. Can I play on the road Mum? - Traffic and homes in
urban Australia. Road Trans Res. 1994;3:12–23.
53. Groothuis-Oudshoorn CGM, Miedema HME. Multilevel grouped regression for analyzing self-reported health in relation to environmental factors: the model and its application. Biom J. 2006;48:67–82.
54. Hong J, Kim J, Lim C, Kim K, Lee S. The effects of long-term exposure to railway and road traffic noise on subjective sleep disturbance. J Acoust Soc Am. 2010;128:2829–35.
55. WHO. Night noise guidelines (NNGL) for Europe. Copenhagen: World Health Organization, Regional Office for Europe; 2009.
56. Brown AL. Longitudinal annoyance responses to a road traffic noise management strategy that reduced heavy vehicles at night. J Acoust Soc Am. 2015;137:165–76.
Submit your next manuscript to BioMed Central and take full advantage of:
• Convenient online submission
• Thorough peer review
• No space constraints or color figure charges
• Immediate publication on acceptance
• Inclusion in PubMed, CAS, Scopus and Google Scholar
• Research which is freely available for redistribution