* Corresponding author.
E-mail addresses: abbashh2002@gmail.com, abbas.hassin@uobasrah.edu.iq (Abbas H. Hassin Alasadi), baidaalsafi@yahoo.com (Baidaa M.Alsafy).
I. IntRoductIon
T
he abnormal growths of melanocytes cause malignant melanoma skin cancer, which invades or spreads to other parts of the body without normal controls; malignant melanoma divided into four types,which are classified by their histologic features and are listed according
to their frequency of occurrence [1, 2]:
A. Superficial Spreading Melanoma
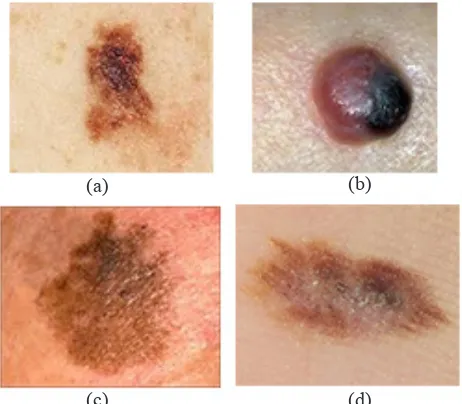
SSMM is the most popular kind of malignant melanoma, which effects on all ages. It may occur on any part of the body and it is usually found on the legs of women and the trunk of men, it is usually greater than 0.5cm in diameter. It usually develops as an asymmetric plague with variation in color such as black, red, brown, blue, and white as pigment pattern and irregularity (notching of borders), see Fig.1(a).
B. Nodular Malignant Melanoma
NMM typically presents as dome-shaped dark brown or black nodule that ulcerates and bleeds, it is less common but more malignant. It is most commonly found on the trunk, although anybody site can be affected, including covered areas such as the axillae and buttocks. Recognition may be delayed because an irregular edge and multiple colors are often absent. The outline of the lesion may be irregular and its color varied. Often, it will have a well-defined border and symmetry in contract to other melanoma, see Fig.1 (b).
C. Lentigo Malignant Melanoma
LMM is a specific type of malignant melanoma that develops in chronically sun-exposed areas, particularly the face, in the elderly; varying admixtures of pink, gray, blue, and white represent it. The borders are frequently highly irregular and notched. The overall size may range from 1.0 to 20.0 cm or larger. Begins as a macule with tan color that spreads peripherally with gradual mixed darkening and become palpable, as a papule, nodule or plaque and transformed into LM melanoma darken [3], see Fig.1 (c).
Fig. 1. Malignant Melanoma Types. (a) Superficial Spreading Melanoma. (b) Nodular Melanoma (c) Lentigo malignant Melanoma. (d) Acral Lentiginous Melanoma.
(a)
(c)
(b)
(d)
Keywords
Malignant Melanoma; Preprocessing; Separation; Feature Extraction; Diagnosis.
Abstract
Malignant melanoma is a kind of skin cancer that begins in melanocytes. It can influence on the skin only, or it may expand to the bones and organs. It is less common, but more serious and aggressive than other types of skin cancer. Malignant Melanoma can happen anywhere on the skin, but it is widespread in certain locations such as the legs in women, the back and chest in men, the face, the neck, mouth, eyes, and genitals. In this paper, a proposed algorithm is designed for diagnosing malignant melanoma types by using digital image processing techniques. The algorithm consists of four steps: preprocessing, separation, features extraction, and diagnosis. A neural network (NN) used to diagnosis malignant melanoma types. The total accuracy of the neural network was 100% for training and 93% for testing. The evaluation of the algorithm is done by using sensitivity, specificity, and accuracy. The sensitivity of NN in diagnosing malignant melanoma types was 95.6%, while the specificity
was 92.2% and the accuracy was 93.9%. The experimental results are acceptable. DOI: 10.9781/ijimai.2017.458
Diagnosis of Malignant Melanoma of Skin Cancer
Types
Abbas H. Hassin Alasadi, Baidaa M. Alsafy *
Department of Computer Science at Basra University, Basra (Iraq)
Computer Science Department, Science College, ThiQar University, ThiQar (Iraq)
or nodules that are blue, black or amelanotic and often ulcerated. It usually starting under the cuticle and producing pigmented streak in the nail plate2, see Fig.1 (d).
II. the PRoPosed algoRIthM
This section gives a general view of the proposed algorithm for diagnosis malignant melanoma skin cancer. The structure of the proposed algorithm is shown in Fig. 2.
Input
(Digital Image) (Remove Noises)Preprocessing
Separation (Malignant from
healthy skin)
Output (Superficial, Nodular, Lentigo
or Acral malignant)
Diagnosis (NN Classification)
Features Extraction (Color, Geometry,
Texture)
Fig. 2. The essential steps of the proposed algorithm.
Logically, the first step of the classification of malignant melanoma of skin cancer system is the input image. Image in digital format is given as an input to the system. Next step, is the preprocessing which includes noises removal. Median [4] and Gaussian Filtering [5] remove the noises. After filtering, the image is subjected to separation step that separates the malignant lesion from normal skin. Some unique features distinguish the malignant melanoma of skin cancer types. The feature extraction techniques used here are color features; texture features and shape features. The selected features are given as the input to Neural Network classifier (NN) which classifies the given datasets into malignant melanoma types.
A. Preprocessing
In this paper, the images databases of melanoma skin cancer are obtained from the Lloyd Dermatology and Laser Center6. This database contains about 200 color images for malignant melanoma of skin cancer. Images are captured in the JPEG format, with maximum resolution size 481x734 pixels, which were later resized to 256 x 512 pixels. The aim of the preprocessing step is to enhance the images and remove noises using Median and Gaussian Filtering, then apply contrast enhancement which sharpen the image border and improve the accuracy for separation. A Gaussian filter was used on the image to reduce the noise; Gaussian filter is a low pass filter that suppresses high frequency detail while preserving the low frequency components of the image. A sigma value of 0.5 was chosen to enable noise filtering while still keeping the edge components of the image.
Median Filtering is an image filtering method that makes the skin cancer image smoother. In which each pixel value in an image is exchanged with the median value of its neighboring pixels including itself. To reduce the noise while keeping the edges, the median filter is applied. It is used for decreasing the effect of small structures such as thin hair and separated unwanted pixels such as air bubbles. In order to have preferable performance and get high contrast for the image .We use image adjustment that removes the unwanted part of the image that came from some noises. The result improved the shape and edges of image. Additionally, contrast enhancement can sharpen the border of image and raise the accuracy for separation see Fig. 3.
Fig.3. Sample of malignant melanoma images after applying the preprocessing steps. (a) Original image. (b) Applying Gaussian filter. (c) Applying median filter. (d) After image adjustment.
(a)
(c)
(b)
(d)
B. Skin Lesion Separation
In this paper, we must separate skin lesion in color images to extract color features, and gray level images to extract texture features so skin lesion separation stage pass into two stages:
C. Skin Lesion Separation for Color Images
The main steps for lesion separation can be categorized into four sections: (1) Thresholding and converting to binary image (2) Finding of initial point (3) Traced boundary (4) Detected skin lesion shows the results separation step. Fig. 4. shows example of all steps the results separation. Algorithm (1) describes the steps of lesion separation algorithm.
Algorithm (1): Lesion Separation for color image.
Input: Color image after preprocessing step. Output: Color image with detecting lesion.
Step1: Converting color image into gray level image with increasing the contrast of the output image using image adjustment. Step2: Using gray thresholding, which computes a global threshold that
can be used to convert an intensity image to a binary image. Step3: Detect the size of binary images, which returns the sizes of each
dimension.
Step4: Returns an array of 1s that is the same size as image using ones which returns an n-by-n matrix of 1s.
Step5: Inverting between binary image and the result of step4. Step6: Finding of initial point by detecting the point between row and
column (detect the point in row and detect the point in co-lumn) in binary image.
Fig. 4. Example of the main lesion separation steps. (a) Original image. (b) Converting into gray level with increasing the contrast. (c) Applying Thresholding and converting to binary image. (d) Inverting binary image. (e) Traced boundary and detected lesion.
(a)
(d)
(b)
(e)
(c)
D. Skin Lesion Separation for Gray Level Images
The main steps for lesion separation can be categorized into four sections (1) thresholding (2) morphological operation (3) border detection (4) lesion extraction. Fig. 5 shows the results separation step. Algorithm (2) describes the steps of lesion separation algorithm.
Algorithm (2): Lesion Separation for Gray Level Image. Input: Gray level image after preprocessing step. Output: Gray level image contain lesion only. Step1: The gray level image is of the size (256*512).
Step2: Thresholding was used, the pixels of image (C) less than 100 equals to Zero (C(C<100) =0).
Step3: Create Binary image with some unwanted pixels.
Step4: Remove unwanted pixels from binary image that have fewer than (400) unwanted pixels, producing another binary image without unwanted pixels.
Step5: Clear the image border, which suppresses structures that are ligh-ter than their surroundings and that are connected to the image border.
Step6: Filling the holes in the binary image.
Step7: Remove unwanted pixels from binary image that have fewer than (200) unwanted pixels, producing another binary image without unwanted pixels.
Step8: Perform closing morphological with the structuring element as a disk shape of size=1 on the binary image.
Step9: Filling the holes in the binary image.
Step10: Convert the input gray level image into unsigned 8-bit integers. Step11: Convert the image that results of the step10 into unsigned 8-bit
integers.
Step12: Multiplies each element in array (image result from step 10) by the corresponding element in array (image result from step 11) and regains the result in the corresponding element of the output array.
Fig. 5. Example of the main lesion separation steps. (a) Image after preprocessing. (b) Applying Thresholding and converting to binary image. (c) Remove unwanted pixels. (d) Apply morphological operation. (e) Detect border. (f) Lesion separation.
(a)
(d)
(b)
(e)
(c)
(f)
E. Feature Extraction
These features are selected for distinguish malignant melanoma types. Three feature extraction types are proposed here; color, geometry and texture features see Fig. 6.
Fig. 6. Feature extraction to classification malignant melanoma types.
F. Color Features
The color features include; mean, skewness, and standard derivation. These features extract the Color Moment (CM) descriptor proposed in [7]. The common moments are mean, standard deviation, and skewness; the corresponding calculation can be defined as follows respectively:
∑
== Nj ij
i N1 1f
µ
(1)
(
)
121
2
1
−
=
∑
Nj= ij ii
N
f
µ
image pixel and N is the total number of pixels in the image. , , (i=1,2,3) denote the mean, standard deviation, and skewness of each channel of an image respectively. Algorithm (3) describes the steps of color features extraction algorithm.
Algorithm (3): Color features extraction
Input: Color image for malignant melanoma. Output: Color features vector.
Step1: Convert the RGB color map into an HSV color map. The co-lumn of the output matrix represents Hue, Saturation, and Value respectively.
Step2: Compute mean for each H, S, and V channel as in (1).
Step3: Compute standard derivation for each H, S, and V channel as in (2).
Step4: Compute skewness for each H, S, and V channel as in the (3).
G. Geometry Features
The geometry features include Area of the lesion, Perimeter-to-Area Ratio of the lesion and, Eccentricity. We divide the perimeter by area using the hypothesis that a lesion with a large perimeter-to-area ratio will likely have a jagged boundary, while a pigmented lesion with a small perimeter-to-area ratio will likely have smoothed edge. Eccentricity is defined as the ratio of the Eigen values of the covariance matrix that corresponds to a binary image of the shape. To calculate eccentricity we have to computes the ratio of the distance between the foci of the ellipse fitted to the shape and its major axis length. The output is between 0 and 1, with 0 representing a circle and 1 a line. Algorithm (4) describes the steps of geometry features algorithm.
Algorithm (4): Compute Geometry Features.
Input: Binary image which results from separation step after apply morphological operation.
Output: Geometry features vector. Step1: Compute the area of the lesion.
Step2: Compute the perimeter of the lesion using compute the distance around the boundary of the region.
Step3: Compute theperimeter-to-area ratio by divided the perimeter to area.
Step4: Compute the eccentricity, which is the ratio of the distance bet-ween the foci of the ellipse and its major axis length.
H. Texture Features
The texture features consist of contrast, correlation, energy, and homogeneity. All are computed from GLCM proposed in [8] for the four directions (0, 45, 90, and135) to gray level image of malignant melanoma. These features are described as below:
Contrast measures the amount of local variations in an image.
( ) ( )
∑∑
i j i-j Pi,j =
Contrast 2
(4)
Correlation is a measurement of gray tone linear dependencies in the image.( ) ( )
x yi j Pi j
µ
µ
− ∑∑
i-j ,= n Correlatio
2
present in the image.
( )
∑∑
+ − ′i j i j
j i P 1 , = y Homogeneit
(7)
Algorithm (5) used to extract texture feature from gray level Co-occurrence matrix for gray level image.Algorithm (5): Compute Texture Feature
Input: Gray level image, which results from the last step of lesion seg-mentation.
Output: Texture features vector.
Step1: Resize the entire image to size 128 * 128. Step2: Compute the size of gray level image.
Step3: Compute GLCM to the gray level image with four off set (0, 45, 90, and 135). The GLCM creates by calculating how pre-dominating a pixel with gray level (grayscale intensity) value i occurs horizontally adjacent to a pixel with the value j. (You can allocate other pixel spatial relationships using the ‘Offsets’ parameter (0, 45, 90, and 135). Each element (i , j) in GLCM assigns the number of times that the pixel with value i occurred horizontally adjacent to a pixel with value j.
Step4: Initialize Matrices at each edge (0, 45, 90, 135) to zero G0= G1= G2= G3= zeros.
Step5: Compute the texture feature to GLCM contrast, correlation, energy, and homogeneity for each angle as in (4), (5), (6), and (7) respectively.
After extract the three types of features malignant melanoma images, combine in one vector to use in the diagnosis step to recognize among malignant melanoma types, you must refer that features extraction step make in training and testing phases.
I. Diagnosis
The last step of the proposed algorithm is diagnosis malignant melanoma types, after obtained features vector and store it, the diagnosis step is followed, in this paper, we use neural networkto diagnoses among malignant melanoma types.
Algorithm (6): NN Classification
Input: A vector of features (28 features). Output:Total accuracy from the NN.
Step1: Create feed forward neural network with three hidden layers, number of neuron in each hidden layer 150, 160,170 respec-tively, these number of layers are chosen after experiment (try and error), input layer for creating neural network is identified by characteristics of inputs. We have twenty eight features vec-tor. Therefore, the number of neuron in input layer is twenty eight, and out layer neuron determined by number of class, we have four classes (malignant melanoma types) therefore the number of neuron in output layer is four.
Step2: Determine the important parameter, learning rate equal to 0.00001, epochs equal to 1000, maximum number of iterations, training time infinity, data division function (divide rand),
transfer function of ith layer hyperbolic tangent sigmoid
‘and training function is back propagation function, weight and bias is generating randomly. These parameters are chosen in our work because it makes the NN gives effective results. Step3:Training the network with train data and target matrix,
tar-get matrix is matrix with four row and four column, each row
consists of vector of zero values except a 1 in element
i
, wherei
is the class they are to perform.Step4: Simulates the neural network by taking the initialized net and network input matrix (train data), return the indices to the lar-gest output as class predict.
Step5: Compute the network performance.
Step6: Compute the network accuracy using confusion matrix.
Step7: Simulates the neural network by taking the training net and test data with target, return the indices to the largest output as class predict.
Step8: Compute the network performance. Step9: Compute the network accuracy.
Fig. 7. shows the network structure with one input layer, three hidden layers and four output layers. It is 28×150×160×170×4 network structure. The input vector is twenty eight. The output vector is four. This thesis uses the above ANN architecture, feed forward back propagation learning algorithm to generate, train and test the neural network for malignant melanoma type’s diagnosis. MATLAB software with its neural network toolbox is used. Data sets are portioned into two subsets, training set and testing set. The network gives high accuracy when train equal to 100% and test equal to 93% with best training performance is 3.8831e-014 at epoch 60.
The obtained results from training NN on 100 cases are 100%. When we test the NN on 100 cases for malignant melanoma types (Twenty five for each type), we found that seven of these cases fail in testing. Therefore, the accuracy of the system is 93%.
Table I and Table II illustrate the classification results of NN for types of melanoma skin cancer in training and testing stages.
taBle I
classIfIcatIon ResultsfRoM nn foR MalIgnant MelanoMa lesIonsIn tRaInIng stage
Malignant Melanoma lesions Classification Result (%)
Superficial Malignant Melanoma 100
Lentigo malignant melanoma 100
Nodular Malignant Melanoma 100
Acral Malignant Melanoma 100
taBle II
classIfIcatIon ResultsfRoM nn foR MalIgnant MelanoMa lesIonsIn testIng stage
Malignant Melanoma lesions Classification Result (%)
Superficial Malignant Melanoma 92
Lentigo malignant melanoma 96
Nodular Malignant Melanoma 92
Acral Malignant Melanoma 92
The accuracy for all types 93
III. PeRfoRMance evaluatIon MeasuRes
The proposed system performance is evaluation by expressions of sensitivity, specificity, and accuracy. The three expressions determined as follow [9]:
• Sensitivity is used to measure the ratio of positives that are correctly
identified; the result denotes positively (disease). It is computed as the following equations:
∗ 100%
(8)
• Specificity is used to measure the ratio of negatives that are
correctly identified; the result denotes negatively (non-disease). It is computed as the following equations:
∗ 100%
(9)
• Accuracy is used to measure the eventuality that the diagnostic test
is performed correctly. It is computed as in the following equations:
∗ 100%
(10)
Where TP is True Positives that correctly diagnosed positive cases; TN is True Negative that correctly diagnosed negative cases, FP is False Positives that incorrectly diagnosed negative cases, and FN is False Negative that is incorrectly diagnosed positive cases.The performance measure to the diagnosis malignant melanoma types is done by the expressions of sensitivity, specificity, and accuracy that are computed for ANN classification using (8), (9), and (10) respectively.
Table III and Table IV show the performance evaluation results of all experiment to diagnosis malignant melanoma types in training and testing stages.
Nodular Malignant Melanoma 100 100 100
Acral Malignant Melanoma 100 100 100
taBle Iv testIng PeRfoRMance MeasuRe.
Data Type Sensitivity% Specificity% Accuracy % Superficial Malignant Melanoma 95.6 92.2 93.9
Lentigo Malignant Melanoma 89.6 95.6 92.4
Nodular Malignant Melanoma 92.0 92.0 92.0
Acral Malignant Melanoma 95.6 92.2 93.9
Iv. c
onclusIonsThe work in the field of melanoma of skin cancer detection is difficult because of the different circumstances in which the images were taken, the multiplicity of devices used in obtaining the images and the distortions that occur in the stage of obtaining the images. The proposed algorithm that used in this paper encouraging results in terms of time that taken in the recognition based on neural network to diagnose malignant melanoma types. Early melanoma skin cancer diagnostic system using computer-based techniques is more efficient than the conventional biopsy methods. The cost involved as well as the time taken for detection is less in this proposed methodology. This system will be a great help in early detection of malignant melanomas for faster, cheaper, more intuitive and efficient treatment. The proposed method has an accuracy of 93% for recognition malignant melanoma types, which is much higher than that of conventional methods.
R
efeRences[1] J. William, T. Berger, and D. Elston, Andrews’ diseases of the skin: clinical dermatology, Elsevier Health Sciences, 2015.
[2] National Comprehensive Cancer Network, Melanoma, NCCN Guidelines for Patients, Version 1, 2014.
[3] K. Cheung, “Image Processing for Skin Cancer Detection: Malignant Melanoma Recognition”, M.Sc. Thesis, Graduate Department of Electrical and Computer Engineering University of Toronto, 1997.
[4] G. Gupta, “Algorithm for image processing using improved median filter and comparison of mean, median and improved median filter. “International Journal of Soft Computing and Engineering 1.5 (2011): 2231-2307.
[5] H. Zhou, J. Wu and J. Zhang, Digital Image Processing part II, Bookboon, 2010.
[6] Melanoma Database: http://www.lloydderm.com
[7] D. Ping Tian, ‘’A Review on Image Feature Extraction and Representation Techniques”, International Journal of Multimedia and Ubiquitous Engineering8.4 (2013): 385-396.
[8] E. Alaa, and H. Demirel, “Co-occurrence matrix and its statistical features as a new approach for face recognition.” Turkish Journal of Electrical Engineering & Computer Sciences 19.1 (2011): 97-107.
[9] S. Mariam, S. Mabrouk, and A. Sharawy, “Automatic detection of melanoma skin cancer using texture analysis.” International Journal of Computer Applications 42.20 (2012): 22-26.
.
more than ten years as Assistant Professor at different Universities abroad the current position. His research interests include Medical Image processing, Biometrics, Information retrieval, and Human-computer interaction. His research work have published in various international journals and conferences.
Dr. Abbas is an active reviewer in many journals of the areas of computer science and software engineering. He is one of ACIT,UJCS, and IJPRAI members.
Baidaa M. Alsafy