Em.iroonensal and Experintraisi Belay, Vol. 00, No. 1, pp. 75 5!1, 1990 0098-8472190 53.00+0.00
Printed in Great Britain. Pergaimm Press pie
A COMPARISON OF PRESSURE CHAMBER, LEAF-PRESS, AND
CANOPY TEMPERATURE FOR FOUR SPECIES UNDER HUMID
CONDITIONS
R. E. SOJKA,* E. J. SADLER,t C. R. CAMP]' and F. B. ARNOLD: * USDA-Agricultural Research Service, Route 1, Box 186, Kimberly, ID 83341, U.S.A., 1. USDA-Agricultural Research Service, P.O. Box 3039, Florence, SC 29502, U.S.A. and USDA-Soil Conservation Service, 514 S. 23rd Ave, Bozeman, MT 59715-3963, U.S.A.
(Received 11 January 1989; accepted in revised farm 22 May 1989)
SOJKA R. E., SADLER E. J., CAMP C. R. and ARNOLD F. B. A comparison of pressure chamber, leaf-press, and canopy iemperatureforfror species under humid conditions. ENVIRONMENTAL AND EXPERIMENTAL BOTANY 30, 75-83, 1990.—Numerous techniques are currently available for measurement of plant water status in field environments, including pressure chambers and indices based upon infrared-determined canopy temperatures. The Campbell-Brewster (J-14) leaf press has been promoted as a compact alternative to the pressure chamber for plant water potential deter-mination. In-depth comparisons of the J-14 ('PJ) with the pressure chamber ('P) or with canopy temperatures (T) and crop water stress index (CWSI) have been limited, and an evaluation of the technique in a humid environment was needed. All three J-14 end points [exudation from cut (TR) or uncut leaf edges (T N ) or darkening of interveinal areas (TN)] were highly correlated among themselves for the four species studied. Correlations of J-14 end points with other stress indicators from unstable diurnal periods were poor. None of the water status indicators correlated well with leaf diffusive resistance. Our data showed a species-related reliability of the J-14. The J-14 produced r2 values above 0.7 for soybean [Glycine max. (L.) Merr.] for all but comparisons with CWSI or T, minus air temperature (ST), and for corn (Zea mays L.) for '11„ only. The J-14 did not perform well for tomato (Lypersician esculentum Mill.) or rapeseed (Brassica napes L.), and is probably best regarded only as a relative indication of plant water status in the absence of calibration with other techniques. Failure of 'P„ or J-14 to correlate well with CWSI underscores difficulty with CWSI measurement under humid conditions.
Key words: Hydraulic leaf press, J-14 leaf plus, plant water potential, xylem pressure potential,
pressure bomb, crop water stress index.
INTRODUCTION
DETERMINING plant water status in the field can be inconvenient because of technique or equip-ment limitations. The pressure chamber (") has been widely used for field assessment of plant xylem pressure potential (111„) which is closely related to total plant water potential ('I') in the absence of significant osmotic potential ('P 5 ). Most pressure chambers are either excessively
bulky or have inadequate gas capacity for numer-ous measurements. Psychrometric determination ofWi 2lj is very precise, but is poorly suited to field use because of the time required and sensitivity to environmental variation. A highly portable method which has been suggested and which requires little or no equipment maintenance and no material resupply is the Campbell–Brewster hydraulic leaf press. 121
has been slow to gain acceptance for several reasons. Only limited data comparing it in detail to established plant water status indicators other than the pressure chamber are available. The physical meaning of the J-14 end points remains uncertain. Published comparisons of the J-14 press have to date been only with the
Scholander-1,3,8-11,15,17-19,24,28)
type pressure chamber,( rela-tive water content (relarela-tive turgidity) tech-niq ue,(3'as•2°' and thermocouple psychrom-etry.") Published comparisons of the J-14 end points with leaf temperature ( Tc ), leaf minus air temperature (q
T),
the derived crop water stress index (CWSI), or measurements of leaf diffusive resistance, leaf transpiration, or micrometeoro-logically-derived canopy parameters have not appeared.The J-14 end points generally observed are: free exudation from either the cut or uncut leaf edge (Ts, or Ts,,, respectively) or darkening of leaf interveinal areas (Tjd ). Frequently, Ts, and Tj „ are defined as exudation at or near a xylem element from either a cut or uncut edge. In the authors' experience, distinguishing between exu-dation at a xylem element or between xylem elements in the leaf lamina is difficult.
The majority of papers reporting a good relationship between 'I's and 'P. found that Ts over-estimated',., i.e. a more negative potential was measured for 'P. than for the corresponding value of tiji .11•8,11,17,18,28) Three factors may have
contributed to this. One is the subtlety of the Ts endpoint; HICKS
a
ai.(10) over-estimated T, if the first exudation of sap was taken as the Tj end-point. A one-to-one relationship existed if Tj was taken to be the pressure at which sap exuded from all leaf veins. Also, in none of the above T. vs Ts comparisons did the authors report transporting leaves in plastic or wrapping leaves with moist gauze or with plastic during chamber press-urization as recommended by GANDAR and TANNER ' 7) and TURNER and LONG(26' to combat the rapid rise in chamber temperature and vapor pressure deficit.'''") GRANT et aV8i also suggestedthat with the J- / 4, the xylem osmotic component is not measured, which upwardly biases 'I' by an amount that decreases as the plant progressively dries toward plasmolysis.
Other limitations of the J-]4 have been noted. Good correlation of Ts with T and q' from
pres-sure chamber and psychrometers, respectively have been limited to readings from stable (mid-day) periods"7) and in some species to partially stress-hardened plants.(') Furthermore, SHAYO-NGOW1 and CAMPBELL (24) caution that all J-14 end points include the pressure required to deform the tissue and increase the matrix potential to zero, and that these pressures alter matrix pore struc-ture causing a measurement artifact, which can affect the end points in all but pre-frozen samples. HUNT el ai, (1 ' ) may have seen evidence of this
in their work. They found that with Ts as the dependent variable, they intercept increased and the slope decreased as specific leaf area (SLA) decreased. They concluded that leaves with lower
SLA resist mechanical compression in the J-14
press, causing it to be less sensitive to differences in 'I',,.
The objectives of this study were to compare Tj,, Tju, and 'Pp with one another, with the standard pressure chamber measurement of T. using wrapped leaf samples, and with the crop water stress index (CWSI) as developed by JACK-SON et a1. ( ') and luso el al!" ) for four species in local irrigation studies. Unlike previous com-parisons, these comparisons were conducted under the typically humid conditions prevailing in the study area (the southeastern U.S.A.).
MATERIALS AND METHODS
Ongoing field studies with irrigation treat-ments, providing a range of plant water status from non-stressed to moderately stressed, were monitored in Florence and Charleston, South Carolina. Corn (Sea mays L.), soybean [Glyczne
max (L.) Merr.], and rapeseed (Brassica napus L.)
were grown on Norfolk Loamy sand (fine-loamy, siliceous, thermic, Typic Paleudult) in Florence, and tomato (Lypersictem esculentum Mill.) was grown on Hockley loamy fine sand (fine-loamy, siliceous, thermic Plinthic Paleudult) in Charles-ton. Crops were grown using conventional cul-tural practices for each crop in the region, includ-ing in-row subsoilinclud-ing to 0.45 m. Tomato was grown on 1.22-m staked rows. Soybean, corn, and rapeseed were grown on 0.76-m spaced rows. Rapeseed was in a twin-row configuration with 0.28 m between twin rows.
(a) 0.0
0 0 5.0 10.0 15.0 20.0 25.0 30.0 30.0
25.0
-G 0 20.0 -47
0
a_ 15.0 -_NC
10.0
5.0
-111-13 Cut oelga a-6 Uncut odes
1." - -. Color change
0
A COMPARISON OF FOUR SPECIES UNDER HUMID CONDITIONS 77
Table 1. Slopes and intercepts of well-watered base-lines used in calculations. Data taken from Inso(12)
Crop Scientific name Intercept (°C) Slope (°C/kPa)
Tomato Lypersicum esculenium Mill. 2.86 - 1.96
Soybean Glycine max (L.) Merr. 1.44 - 1.34
Rapeseed* Brassica napes L. 1.94 - 2.26
Corn Zen mays L. 3.11 - 1.97
*Insot") reported no data for rapeseed. Data for turnip (B. rapa) were used.
using a pressure chamber specially designed to allow rapid insertion and sealing and with a high chamber-mass to internal-volume ratio to mini-mize compression-decompression related tem-perature changes. Leaves were excised, immedi-ately placed in plastic bags containing wet paper towels, and quickly inserted into the pressure chamber for pressurization. Two-three centi-meters of excised petiole (or corn leaf) were left protruding from the plastic bag. With a constant pressure increase rate of 1300 kPa/min, total time from excision to decompression seldom exceeded 2 min. Pressure chamber end points were taken as the first free flow of sap from conductive tissue at leaf excision points. For rapeseed, soybean, and tomato chamber samples, excision was at the point of petiole attachment to the main stem, allowing entire compound leaves to be inserted into the pressure chamber. For corn, excision was at mid-leaf. All leaves selected were
most-Pressure Chamber, kPa s 100
recently-matured, fully-expanded, sun-exposed leaves. For pressure chamber vs j-14 comparisons, matched pairs of leaves were selected from side-by-side plants (one for the chamber, one for the J-14).
The J-14 was pressurized at approximately double the chamber rate. This was because of the coarser control which prevented more gradual pressurization. Each J-14 leaf was excised from the plant with a sharp razor blade so that uncut or cut-edge exudation could be watched sim-ultaneously. All three end points ('Plc , 'I'Jd) were noted on the same leaf sample. Each leaf was backed with white filter paper to facilitate detection of exudate.
Crop temperatures were obtained with an Ever-est model 110 Infrared thermometer using an emissivity setting of 0.98. It was aimed obliquely at the crop canopy taking care to include only foliage in the target area. Air temperatures were
30.0 25.0' 20.0 15.0 10.0 5.0 0.0
20.0 25.0 30.0 35.0 40.0 45.0
(b)
Crap Temperature, C
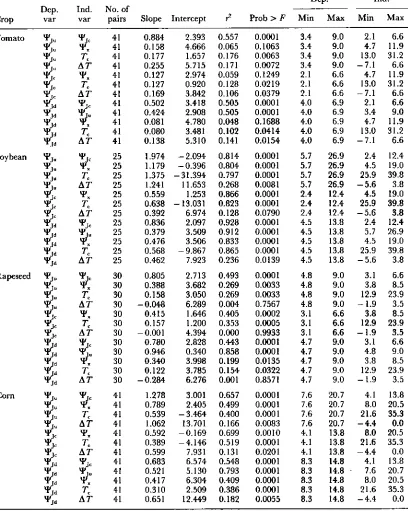
Table 2. Regression equations and coefficients of determination for relationships between measured plant water stress indicators for four species in kPa x 100/i)r and °C for T
Crop
Dep. var
Ind. var
No. of
pairs Slope Intercept r2 Prob > F
Dep. Ind.
MM Max Min Max
Tomato _HP j, 41 0.884 2.393 0.557 0,0001 3.4 9.0 2.1 6.6
41 0.158 4.666 0.065 0.1063 3.4 9.0 4.7 11,9
Th4 T, 41 0.177 1.657 0.176 0.0063 3.4 9.0 13,0 31.2
q
T 41 0.255 5.715 0.171 0.0072 3,4 9.0 - 7.1 6.6qrj, 41 0.127 2,974 0.059 0.1249 2.1 6.6 4.7 11.9
R
T
41 0.127 0.920 0.128 0.0219 2.1 6.6 13.0 31.2j
qj AT 41 0.169 3.842 0.106 0.0379 2.1 6.6 - 7.1 6.6
qjjd 41 0.502 3.418 0.505 0.0001 4.0 6.9 2.1 6.6
%P.m T i„ 41 0.424 2.908 0.505 0.0001 4.0 6.9 3.4 9.0
j
1P d 41 0.081 4.780 0.048 0.1688 4.0 6.9 4.7 11.9
T: 41 0.080 3.481 0.102 0.0414 4.0 6,9 13.0 31.2
. AT 41 0.138 5.310 0.141 0.0154 4.0 6.9 -7.1 6.6
Soybean 41.1„
'Pj„ 411' 25 25
1.974 1.179
- 2.094 - 0.396
0.814 0.804
0.0001 0.0001
5.7 5.7
26.9 26.9
2.4 4.5
12.4 19,0
'11j„ 25 1.375 - 31.394 0.797 0.0001 5.7 26.9 25.9 39.8
AT 25 1.241 11.653 0.268 0.0081 5.7 26.9 - 5.6 3.8
25 0.559 1.253 0.866 0.0001 2.4 12.4 4.5 19.0
T, 25 0.638 - 13,031 0.823 0.0001 2.4 12.4 25.9 39.8
:Pe AT 25 0.392 6.974 0.128 0.0790 2.4 12.4 - 5.6 3.8
jd .3, 25 0.836 2.097 0.928 0.0001 4.5 13.8 2.4 12.4
'P d ► 'I'
25 0.379 3.509 0.912 0.0001 4.5 13.8 5.7 26.9
`rid •
IF
25 0.476 3.506 0.833 0.0001 4.5 13.8 4.5 19.0
T: 25 0.568 - 9.867 0,865 0.0001 4.5 13.8 25.9 39.8
/.1 AT 25 0.462 7.923 0.236 0.0139 4.5 13.8 - 5.6 3.8
Rapeseed 41 ,, 30 0.805 2.713 0,493 0.0001 4.8 9.0 3.1 6.6
30 0.388 3.682 0.269 0.0033 4.8 9.0 3.8 8.5
qfj T: 30 0.158 3.050 0.269 0.0033 4.8 9.0 12.9 23.9
AT 30 -0.048 6.289 0.004 0.7567 4.8 9.0 - 1.9 3,5
tlf; 30 0,415 1.646 0.405 0.0002 3.1 6.6 3.8 8.5
T, 30 0.157 1.200 0.353 0.0005 3.1 6.6 12.9 23.9
AT 30 - 0.001 4.394 0.000 0.9933 3,1 6.6 -1.9 3.5
jj 30 0.780 2.828 0.443 0.0001 4.7 9.0 3.1 6.6
30 0.946 0.340 0.858 0.0001 4.7 9.0 4.8 9.0
111„ 30 0.340 3.998 0.199 0.0135 4.7 9.0 3.8 8.5
4(111.1
T, AT
30 30
0.122 - 0.284
3.785 6.276
0.154 0.001
0.0322 0.8571
4.7 4.7
9.0 9.0
12.9 -1.9
23.9 3.5
Corn '11.j„ 41 1.278 3.001 0.657 0.0001 7.6 20.7 4.1 13.8
tIfI
T T,
41 41
0.789 0.539
2.405 -3.464
0.499 0.400
0.0001 0.0001
7.6 7.6
20.7 20,7
8.0 21.6
20.5 35.3
Tju AT 41 1.062 13.701 0.166 0.0083 7.6 20.7 - 4.4 0.0
41 0.592 -0.169 0.699 0.0010 4.1 13.8 8.0 20,5
c, T, 41 0.389 - 4.146 0.519 0.0001 4.1 13.8 21.6 35.3
AT 41 0.599 7.931 0.131 0.0201 4.1 13.8 - 4.4 0.0
jd 'Pi, 41 0.683 6.574 0.548 0.0001 8.3 14.8 4.1 13.8
‘P d 41 0.521 5.130 0.793 0.0001 8.3 14.8 7.6 20.7
TI„ 41 0.417 6.304 0.409 0.0001 8.3 14.8 8,0 20.5
Jd T, 41 0.310 2.509 0.386 0.0001 8.3 14.8 21.6 35.3
0.0
0 0 5.0 10.0 15.0 20.0 25.0 30.0
A COMPARISON OF FOUR SPECIES UNDER HUMID CONDITIONS 79
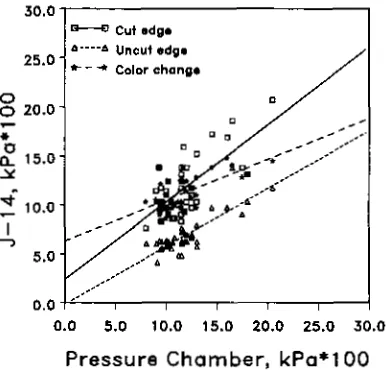
Pressure Chamber, kPa*100 FIG. 2. Comparison ofJ-1 4 press with pressure chamber
for corn.
determined from automated weather stations immediately adjacent to the plots. The Florence stations were described by Soptk and PARSONS(25)
and SADLER and CAmP.(21) The Charleston data were collected with commercial (CR21, Camp-bell Scientific, Logan, UT) data logger-based weather stations. For all but the rapeseed data, vapor pressures above the canopy (at 1 m height) were calculated from relative humidity meas-ured with a Beckman Humi-Chek II precision hygrometer.
The CWSI was calculated using the empirical formulas derived by I DSO et al. {13) and summarized by CLAWSON et al. {') Results were confirmed using the computer program of CARNEY and PINTER:4)
The equations used were as follows:
CWSI(TT, F )1(T,.— T. ] )
where T, is crop temperature (DC) and subscripts u and I indicate upper and lower limits, respec-tively.
T . Ta + ao+ a i * (esa— esa'),
Ta is air temperature (CC), as and a, are intercept (CC) and slope (°C/kPa) of the well-watered base-line (see Table 1 for values), esa is saturation vapor pressure at T., (kPa), and esa' is saturation vapor pressure (kPa) at ( +no). This last is an estimate of T, at zero transpiration.
= Ta + ao + a i * (esa— ea)
where ea is actual vapor pressure (kPa). The term
(esa — ea) is recognized as the vapor pressure
defi-cit (VPD).
Upon completion of each plant water status determination, a record of Ta, T, AT, RH
(rela-tive humidity), VPD, IP„Ti,,'Pj „,'Pjd , and CWSI existed for correlation—regression analysis for the date and time. Regression analysis was ac-complished using the PROC RSQUARE sub-routine of SAS (SAS Institute, Cary, NC).
RESULTS AND DISCUSSION
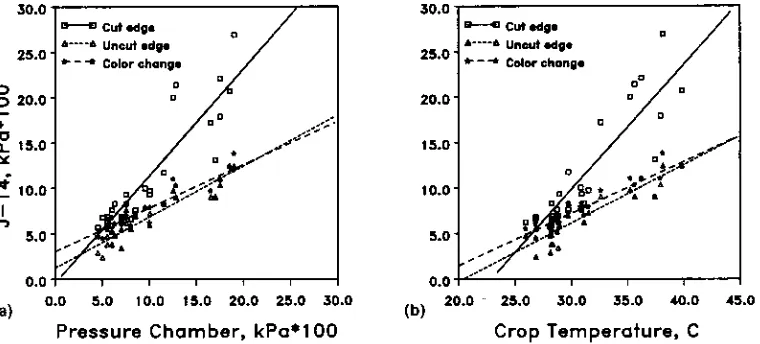
A statistical summary of the relationship between physically measured parameters for all four crops is presented in Table 2. Soybean pro-vided uniformly good correlations of J-14 par-ameters with all measured water status indicators except A T, which confirms and expands the find-ings of GRANT et al. (6) The relationships between
IF J „, 1id and 'P or T, are shown in Figs la and lb. In addition to the relationships between these parameters, it should be noted that the three J-14 end points for soybean are closely related. Under southeastern conditions, some problems
Table 3. Regression equations and coefficients of determination for relationships between values from unwrapped and wrapped samples for three species in a pressure chamber ( unwrapped = dep. var.) in ea x 100
No, of
-Dep. Ind.
Max Max
Crop pairs Slope Intercept rz Prob > F Min Min
Soybean 25 1.043 0.356 0.906 0.0001 4.5 22.5 4.5 19.0
Rapeseed 30 0.974 0.955 0.747 0.0001 4.5 10.7 3.8 8.5
2.50 2.25 2.00 1.75 1.50 1.25 1.00 0.75 0.50 0.25 0.00 -- 0.25 - 0.50 7 0.75 ---1.00
0 F")
5 10 15 20 25 30
13-0 Soybean. ohareber , /
6,-6 Soybean, uncut edge. Soybean, taller change / / Corn, chamber
Tomato, chamber • /
• /
• L.
• „
i
re • Coa 06
c
1'1'1'1'
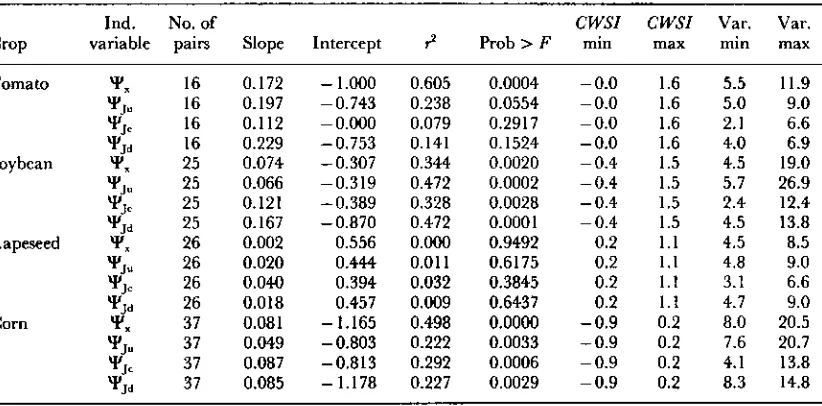
Table 4. Regression equations and coefficients of determination for relationships between CWSI ( dependent variable) and pressure chamber or J-14 measurements of plant water potential for four species in bars kPa x 100 for mid-day observations
(0900-1500 hr)
Crop
Ind. variable
No. of
pairs Slope Intercept r2 Prob > F CWSImin
CWSI max
Var, min
Var, max
Tomato Tx 16 0.172 -1.000 0.605 0.0004 - 0.0 1.6 5.5 11.9
tp.r„ 16 0.197 -0.743 0.238 0.0554 - 0.0 1.6 5.0 9.0
16 0.112 -0.000 0.079 0.2917 - 0.0 1.6 2.1 6.6
'Pp 16 0.229 -0.753 0.141 0.1524 - 0.0 1.6 4.0 6.9
Soybean 25 0.074 -0.307 0.344 0.0020 - 0.4 1.5 4.5 19.0
'Pj „ 25 0.066 -0.319 0.472 0.0002 -0.4 1.5 5.7 26.9
25 0.12/ -0.389 0.328 0.0028 - 0.4 1.5 2.4 12.4
25 0.167 -0.870 0.472 0.0001 -0.4 1.5 4.5 13.8
Rapeseed '11„ 26 0.002 0.556 0.000 0.9492 0.2 1.1 4.5 8.5
26 0.020 0.444 0.011 0.6175 0.2 1.1 4.8 9.0
26 0.040 0.394 0.032 0.3845 0.2 1.1 3.1 6.6
26 0.018 0.457 0.009 0.6437 0.2 1.1 4.7 9.0
Corn 37 0.081 - 1.165 0.498 0.0000 - 0.9 0.2 8.0 20.5
Tp
n 37 0.049 - 0.803 0.222 0.0033 0.9 0.2 7.6 20.737 0.087 -0,813 0.292 0.0006 -0.9 0.2 4.1 13.8
tIljd 37 0.085 - 1.178 0.227 0.0029 - 0.9 0.2 8.3 14.8
Water potential, kPa*100
Flo. 3. Comparison of CWSI to water potential for soybean, corn, and tomato.
have been noted with A T determinations under fluctuating radiation. Despite efforts to minimize this some haziness may have affected the AT determination in all four species.
Corn had moderately good correlations
between T. and either Wi„, Tic, or TN (Fig. 2). A good relationship was also reported for sorghum
(Sorghum bicolor L. Moench) by Mots ei al., t " which has similar leaf structure and veination. The only comparison of the J-14 using corn previously reported was for matric potential determin-ation.'L4y As seen in Table 2, 'Ps, correlated
measurably better with Txthan did either or Tie! . Correlations between the J-14 end points
were poorer than for soybean but did indicate
they were strongly related.
Evaluations of the J-14 have not been reported for tomato or rapeseed. Table 2 suggests there is no acceptable relationship between the J-14 and any other traditionally measured indicator of stress for these two species. Indeed, the J-14 par-ameters are only moderately correlated among themselves in rapeseed and in tomato. By contrast, wrapped and unwrapped 'F„
measure-ments for soybean, rapeseed, and corn are sig-nificantly correlated (Table 3). The wrapped determinations were a subset ofTable 2. Data not presented were used to relate P,,, Tj „, IFjc , and
(a) Tomato
- 7.5
0.0 0.5 1.0 1.5 2.0 2.5
Vapor pressure deficit, Wei
3
- 7.5 . . .
0.0 0.5 1.0 1.5 2.0
Vapor pressure deficit, kPa
2.5
A COMPARISON OF FOUR SPECIES UNDER HUMID CONDITIONS SI
I
- 7.5
0.0 0.5 1.0 1.5 2.0 25 3.0 3.5 4.0 4.5 5.0
Vapor pressure deficit, kPa
- 7.5
0.0 0.5 1.0 1.5 2.0 2.5 3.0 3.5 4.0
Vapor pressure deficit. kPa
Fto. 4. Scatter of data within the GWSI envelope by hour of day. Letter symbols A to Q represent 1-hr increments from 0500 to 2100 hr, respectively.
they were from a narrow range of well-watered
plant potentials with fluctuating radiation levels. Previous investigators have shown that the relationship between J-14 parameters and other standard plant water stress indicators is diurnally
also necessary in this study to limit comparison of
kIJJ to mid-day periods.
The crop water stress index (CWSI) was regressed on the four variables Tx, kIJJ„, Tje , and
klijd , for mid-day readings (0900-1500 hr) for all four crops (Table 4). Tomato showed the closest correlation of CWSI (with '1"„) and soybean and corn showed some correlation with CWSI;
however, correlations were poor (r2 below 0.5).
Again the problem may in part relate to the lim-ited plant water potential ranges. Figure 3 illus-trates this with plots of CWSI vs klix for tomato, corn, and soybean. There have been indications that the CWSI may not perform well under humid conditions, particularly under variable radiation regimes, or where haziness limits maximum incoming radiation. Some indication of the difficulty associated with using the CWSI may be gained from Figs 4a, b, c, and d, in which mea-sured q T values are plotted against cor-responding VP!) values with points coded for hour of day for the four crops and showing the calculated baselines. Several observations can be made from these data about use of the CWSI
in humid regions. The range of CWSI observed indicates that the empirical form of the CWSI may
need local calibration, since values considerably outside the range 0-1 are found. This can be seen from values outside the envelope of the upper and lower limits in Figs 4b and 4d, for soybean and corn. Most values outside the envelope for tomato are from early morning or late afternoon, and not within the 0900-1500 time period usually used for CWSI calculations. Values for rapeseed are mostly within the envelope. The data for soybean corroborate those of EVANS and SADLER, (6) who
found values ranging from about 2°C above to 2°C below the envelope, and found both a time-of-day and radiation dependence of CWSI for soybeans for the same soil series. SojKA and PAR-SONS(25 and EVANS and SADLE12 {6) reported a simi-lar diurnal pattern. The current study lacks the time range to demonstrate the time-of-day depen-dence for soybean, though the range is similar. The trace for the tomato data is similar to the earlier soybean data, but lower in the envelope. The tomatoes were probably better watered than the soybeans.
Though the majority of published work with
CWSI has used cloud-free conditions near
mid-day, such conditions seldom exist during the growing season in the Southeast. The com-parisons among crops shown by IDS0' 12) included
sunlit and shaded baselines for five crops, for which the average effect of shading was to lower the baselines 3.8°C below that of the sunlit crops. If thin clouds or haze reduce irradiance, it is
reasonable to assume some intermediate baseline applies. The dependence of these data on radi-ation could not be studied because all the weather stations integrated the irradiance, and the varia-bility of irradiance precluded interpolation be-tween hourly or half-hourly averages.
CONCLUSIONS
The reliability of the Campbell-Brewster J-I4 press appears to be species-related, and was not acceptable for the tomato and rapeseed, reported here for the first time. The J-14 measurement of water status is at best a relative indicator and not necessarily an absolute measure of plant water status in the absence of precise species and environment related calibration. Our data con-firm the inability to relate J-14 parameters to other water stress parameters during meteor-ologically dynamic diurnal periods. The J-14 per-formed well with soybean for all but comparisons with A Tor CWSI and it performed well with corn only for comparison of '1%. All three J-14 end points were highly correlated among themselves
in soybean and corn and moderately so in tomato and rapeseed. The tri measurement generally over-estimated The leaf press did not cor-relate well with the CWSI in any of the four species. Failure of CWSI to correlate highly with
Tx as well as the J-14 parameters underscores the difficulties with the CWSI under high humi-dity/limited-radiation regimes.
Disclaimer—Names of equipment manufacturers and
suppliers are provided for the benefit of the reader and do not imply endorsement by the Department of Agriculture.
REFERENCES
I. BRISTOW K. L., ZYL W. H. VAN and DE...JAGER
A COMPARISON OF FOUR SPECIES UNDER HUMID CONDITIONS 83
2. CAMPBELL G. S. and BREWSTER S. F. (1975) Leaf water potential and soil water content measured with a simple hydraulic press. Paper presented at the Western Regional Research Project W-67, Honolulu, Hawaii, January.
3. CAMPBELL G. S., PAPENDICK R. I., RABIE E. and SHAYO-NGOWI A. J. (1979) A comparison of osmotic potential, elastic modulus, and apoplastic water in leaves of dryland wheat. Agron. J. 71, 31-36.
4. CARNEY B. and PINTER P. J. (1986) A computer program to calculate the crop water stress index. Third Arid Lands Remote Sensing Workshop,
9-11 April, University of Arizona, Tucson, AZ.
5. CLAWSON K. L., .JACKSON R. D. and PINTER P.
J., JR (in press) Evaluating plant water stress with canopy temperature differences. Agron. ,1.
6. EVANS D. E. and SADLER E. J. (1987) Energy
balance measurements for crop water status. ASAE Paper No. SER87-102. SE Region ASAE Meeting, Nashville, TN, 30 January-4 February 1987. American Society of Agricultural Engineers, St. Joseph, MI 49085-9659.
7. GANDA.R. P. W. and TANNER C. B. (1976) Potato leaf and tuber water potential measurements with a pressure chamber. Am. Pot. J. 53, 1-14.
8. GRANT R. F., SAVAGE M. J. and LEA J. D. (1981) Comparison of hydraulic press, thermocouple psy-chrometer, and pressure chamber for the measure-ment of total and osmotic leaf water potential in soybeans. S. Afr. J. Sci. 77, 398-100.
9. I-IEATHCOTE D. G., ETHERINGTON J. R. and WOOD-ARD F. L. (1979) An instrument for non-destruc-tive measurement of the pressure potential (tur-gor) of leaf cells. J. exp. Bot. 30, 811-186.
10. HICKS S. K., LASCANO R. J., WENDT C. W. and
ONKEN A. B. (1986) Use of a hydraulic press for estimation of leaf water potential in grain sorghum.
Agron. J. 78, 749-751.
11. HUNT R. E., JR, WEBER J. A. and GATES D. M. (1984) Differences between tree species in hydraulic press calibration of leaf water potential are correlated with specific leaf area. Pl. Cell Envir. 7, 597--600.
12. IDSO S. B. (1982) Non-watered stressed baselines: a key to measuring and interpreting plant water stress. Agric. Met. 27, 59-70.
13. IDSO S. B., JACKSON R. D., PINTER R. J., JR,
REGINATO R. J. and HATFIELD J. L. (1981) Nor-malizing the stress degree day for environmental variability. Agric. Met, 24, 45- 55.
14. JACKSON R. D., I p so S. B., REGINATO R. J. and
PINTER P. J., JR (1981) Canopy temperature as a crop water stress indicator. Wat. Resonr. Res. 17,
1133-1138.
15. JONES C. A. and CARABALY A. (1980) Estimation of leaf water potential in tropical grasses with the Campbell-Brewster hydraulic press. Trap. Agric. (Trinidad) 57, 305-307.
16. PURITCH G. S. and TURNER J. A. (1973) Effects of pressure increase and release on temperature within a pressure chamber used to estimate plant water potential. J. exp. Bat. 24, 342-348.
17. RADULOVICH R. A., PHENE C. J., DAVIS K. R. and
BROWNELL J. R. (1982) Comparison of water stress of cotton from measurements with the hydraulic press and the pressure chamber. Agron. J. 74, 383-385.
18, RAJENDRUDU G., SINGH M. and WILLIAMS J. H. (1983) Hydraulic press measurements of leaf water potential in groundnuts. Expl. Agric. 19, 287-291.
19. RENARD C., FLEMAL J. and BARAMPAMA D. (1979) Evaluation de la resistance a is secheresse chez le theier au Burundi. Cafe CO340 The' 23, 175-182. 20. RHODES P. R. and MATSUDA K. (1976) Water
stress, rapid polyribosome reductions and growth.
Pl. Physiol. 58, 631-635.
21. SADLER E. J. and Cm.. C. R., JR (1984) A remotely programmed and interrogated weather station for research facility. Agron. Abstracts, p. 18.
22. SAVAGE M. J., CASS A. and DEjAGER J. M. (1981) Measurement of water potential using thermo-couple hygrometers. S. Afr. J. Sci. 77, 24-27. 23. SCHOLANDER P. F., HAMMED H. T., HEMMINGSEN
E. A. and BROADSTREET E. D. (1964) Hydrostatic pressure and osmotic potential in leaves of man-groves and some other plants. Proc. Natl. Acad. Sci.,
U.S.A. 52, 119-125.
24. SHAYO-NGOWI A. and CAMPBELL G. S. (1980) Measurement of matric potential in plant tissue with a hydraulic press. Agron. J. 72, 567- 568. 25. SoptA R. A. and PAasom J. E. (1983) Soybean
water status and canopy microclimate relation-ships at four row spacings. Agron. J. 75, 961-968. 26. TU RNER N. C. and LONG M. J. (1980) Errors
arising from rapid water loss in the measurement of leaf water potential by the pressure chamber technique. Aust. J. Pl. Physiol. 7, 527-37.
27. WENKERT W., LEMON E. R. and SINCLAIR T. R. (1978) Changes in water potential during pressure bomb measurement. Agron. J. 70, 353-355. 28. YEGAPPAN T. M. and MAINSTONE B. J. (1981).
Comparisons between press and pressure chamber techniques for measuring leaf water potential.