Peculiarities of Raman scattering in nanometric
superionic conductors Cu
6PS
5Br
1
Studenyak I.P., 1 Buchuk R.Yu., 2 Kranjcec M., 1 Stephanovich V.O.,
1
Panko V.V. and 3 Kokenyesi S.
1
Uzhhorod National University, 46 Pidhirna St., 88000 Uzhhorod, Ukraine; E-mail: [email protected]
2
Geotechnical Department Varaždin, University of Zagreb, 7 Hallerova Aleja, 42000 Varaždin, Croatia; E-mail: [email protected]
3
University of Debrecen, 18/a Bem tér, 4028 Debrecen, Hungary; E-mail: [email protected]
Received: 08.04.2009
Abstract
Superionic conductors Cu6PS5Br are obtained in nanocrystalline state with
ball-milling. Phonon spectra of micro- and nano-powders are studied using Raman spectroscopy. Due to reduction of crystallite size, we have observed essential low-frequency shifts of the Raman scattering bands, broadening of the latter and the corresponding intensity decrease. Specific features of the Raman spectra of nanometric superionic conductors are explained predominantly by their surface phonon modes.
Keywords: nanocrystals, superionic conductors, Raman scattering
PACS: 63.50.+x; 78.30.Hv UDC: 535.36
1. Introduction
Cu6PS5Br crystals belong to the family of compounds with argyrodite structure [1, 2].
They are characterised by high concentration of disordered vacancies and possess both superionic and ferroelastic properties. High ionic conductivity at the room temperature [3, 4] determines potential possibilities of their practical applications as solid electrolyte sources of energy, sensors and highly efficient capacitors.
Cu6PS5Br crystals belong to the cubic system at the room temperature (the space
group F 34 m) and two phase transitions (PTs) occur at low temperatures: a ferroelastic one at Tc = 268±2 K and a superionic one at Ts = 166–180 K [3, 4]. Below the ferroelastic PT point Cu6PS5Br belongs to the monoclynic system (the space group Cc) and the
optical technique have shown that the domain structure [9] and optical birefringence [10] of Cu6PS5Br crystal are observed at Т < Тс. Domain structure, thermal expansion,
ultrasonic velocity and an х, Т-phase diagram of the mixed crystals Cu6PS5IxBr1-x have
been studied in the work [11], whereas the Raman scattering, optical absorption and the luminescence have been dealt with in [4, 12–15]. The studies of the optical absorption edge in Cu6PS5Br crystal have evidenced existence of excitons below the superionic
PT temperature, which undergo considerable changes with increasing temperature. The transition into superionic state results not only in variations of the exciton structure, but also in appearance of exponential contributions in the long-wavelength absorption edge. At T > Ts the temperature behaviour of the exponential parts has been successfully
described by the empirical Urbach rule [12, 13].
In spite of the fact that the optical properties of bulk crystals of Cu6PS5Br superionic
conductors have been studied extensively enough, researches of their changes due to transition to micro- or nanometric sizes only begin. Since the nanometric superionic conductors are of outstanding interest for the physics of nanoionic materials and nanosensors, the present work is aimed at investigations of specific features of the Raman scattering spectra in micro- and nanocrystalline superionic conductors Cu6PS5Br.
2. Experimental
Cu6PS5Br single crystals were grown using a chemical vapour transport technique. The
micro- and nanocrystalline powders of various grain sizes were obtained with ball-milling the material in a cylindrical stainless-steel vial, using hardened steel balls. The grain size reduction achieved during each milling step was followed by measuring the X-ray diffraction spectra (XRD) of the powders with a horizontal Siemens diffractometer using the Cu Kα1 radiation. The XRD analysis has confirmed that the lattice structure of
Cu6PS5Br is preserved in the nanocrystalline samples, though the diffraction peaks
become broader and less pronounced with decreasing size. The average grain size parameters for different duration times were determined following from the XRD patterns. Raman scattering measurements were performed on a double grating monochromator LOMO DFS-24, the excitation being provided by a He-Ne laser (632.8 nm). The error of width contour registration did not exceed 1 cm–1 and the intensity distortion was within the limits of 2–4%.
3. Results and discussion
We have performed Raman scattering studies of the bulk crystals and micro- and nanocrystalline powders of Cu6PS5Br obtained by millings of different durations (see
mode. A band corresponding to A1
symmetry vibration is observed in the frequency region of 400–450 cm–1, which is the most pronounced in the spectra. Finally, two bands are revealed in the spectra in the region of 500–600 cm–1. They have been related to ТО and LO vibrations of F2 mode
corresponding to internal stretching vibrations of tetrahedral PS4
3–
groups [4].
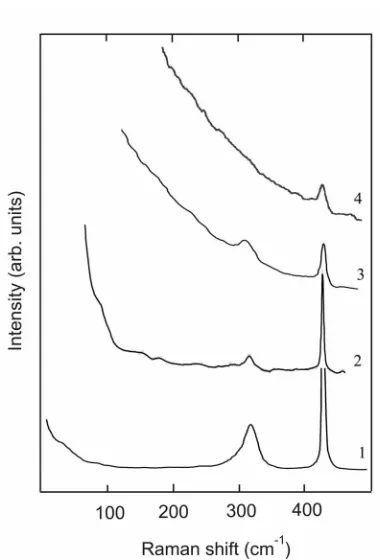
A considerable increase in Rayleigh scattering, masking the low-frequency Raman bands, is observed in nanocrystalline Cu6PS5Br powders
(Fig. 1). Hence only the Raman bands located above 100 cm–1 could be detec-ted. The spectra of the microcrystalline powder with the average grain size of 10µm and the nanocrystalline powder
with the average grain size of 38 nm contain two distinct maxima, the higher-frequency one corresponding to an A1 symmetry vibration and the lower-frequency one being a superposition of Е and F2
symmetry modes. The crystallite size reduction results in a low-frequency shift of the both bands, their broadening and decrease in intensity. Moreover, in the nanocrystalline powders with the average grain size of 15 nm the band corresponding to the superimposition of the Е and F2 symmetry modes, is totally smeared and only the
maximum corresponding to the A1 symmetry vibration is observed.
A considerable low-frequency shift of the Raman bands and their broadening occurring in nanometric crystals are most often explained by confinement-related relaxation of selection rules due to small crystallite sizes [16] and surface phonon modes [17]. The former factor seems to be hardly possible in our case because, according to the calculations [18], the minimal crystallite size under studies (15 nm) is too large to ascribe the observed features of size-related behaviour of the Raman band parameters to phonon confinement. Hence, the changes in the Raman spectra observed with decreasing nanocrystallite size could be assigned to surface phonon modes.
It should be noted that, contrary to the case of bulk crystals, the contribution of surface phonons to the Raman spectrum of nanocrystalline powders should be taken into account independently of exciting beam probing depth [18]. Therefore, for the spherical microcrystals of diameter d one might expect Raman observation of a series of surface
Fig. 1. Raman spectra of bulk Cu6РS5Br
crystals (1) and micro- (2) and nanocrystalline powders of Cu6РS5Br with different average
phonon modes with the quantum numbers l = 1, 2, 3, … corresponding to ( 1)
( ) l m
l
ε ω = − + ε , (1)
where εmis the dielectric constant of the medium surrounding the microcrystals [19]. The
intensity of these modes in nanocrystals decays as 1/rl–1 with increasing distance from the surface of the sphere, with the exception of a so-called Fröhlich mode (l = 1) which has a constant amplitude over the whole volume of the sphere. The Raman scattering efficiency in a small spherical crystal is given by [19]
2 2
( , )
S=C aβ+b E ∆ K k , (2)
where C is a constant, the parameters a and b give respectively the contributions of
atomic displacement and electro-optical effect to the scattering,
β
=
Z M
/
(
ω
TO2−
ω
2)
, Zis the effective charge, M the reduced mass, ωTO the long-wave transverse optical
phonon frequency, and E2 the volume- and thermal-averaged squared field amplitude
of the surface mode. Here
2 2
1 1/
( , )
( ) ( 1/ )
k R
K k
K k k R
π
′′ + ∆ =
′ ′′
− + + , (3)
where R denotes the radius of the sphere, K the radial wave number of the bulk phonon defined from the momentum conservation law, and k′ and k″ are real and imaginary parts of the complex radial wave number introduced in order to include both the bulk phonons (real values in the case of damping effects being neglected) and the surface phonons (imaginary values) in the same formulation.
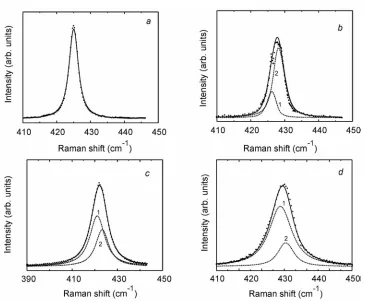
In order to estimate the contribution of surface phonon modes to the spectra measured experimentally we have fitted the A1 Raman band by a superposition of two
Lorentzian contours. The corresponding results are shown in Fig. 2. It is clearly seen from Table 1 that the A1 band is well fitted by the two peaks, the lower-frequency one being
broader than the higher-frequency peak. It should be noted that the averaged ratio of intensities referred to the surface and bulk phonons depends strongly on the grain size. Decrease in the latter results in larger contribution of the lower-frequency band and the resulting A1 band shifts towards lower energies and broadens. Such the behaviour enables
Table 1. Spectral positions and halfwidths of the “bulk” and surface phonons in Cu6PS5Br.
“Bulk” phonon Surface phonon Compounds
ω(cm–1) Γ(cm–1) ω(cm–1) Γ(cm–1)
Bulk single Cu6PS5Br crystals 425 3.1 – –
Microcrystalline powders (10 µm) 424 2.8 422 1.8
Nanocrystalline powders (38 nm) 423 6.7 421 7.7
us to attribute the broader lower-frequency bands to the surface phonons in nanocrystalline superionic conductors Cu6PS5Br.
Let us point out that the mode located at 425 cm–1 represents a fully symmetrical polar vibration for the hypothetic case of an ideal free PS4 tetrahedron. However, this
vibration becomes slightly polar due to effect of the crystal field. The polarity increases with the size decrease due to a breakdown and changes in the chemical bonds occurring for the tetrahedra directly at the nanocrystal surface. That is why our explanation of the shift and broadening observed in the Raman spectra with the average size reduction, which involves increasing contribution of the surface phonon scattering seems to be quite reasonable.
4. Conclusions
Nanocrystalline superionic Cu6PS5Br conductors are obtained with ball-milling and their
average size is estimated from the direct XRD measurements. A considerable increase in Rayleigh scattering, masking the low-frequency Raman bands, is observed with decreasing average grain size in the nanocrystalline Cu6PS5Br powders. The effect is also
Fig. 2. Part of the Raman spectrum that includes the most intense A1 band for the
bulk single Cu6РS5Br crystals (a) and the micro- and nanocrystalline powders of
Cu6РS5Br (the average grain sizes of 10µm (b), 38 nm (c), and 15 nm (d)) and
accompanied by a low-energy shift, a broadening and intensity decrease in the phonon bands. The evolution of the Raman spectra occurring as a result of decreasing crystallite size is explained predominantly by the surface phonon modes, of which contribution to the Raman spectrum then increases due to higher surface-to-volume ratio.
Acknowledgement
The authors are grateful to the State Fund for Fundamental Research of Ukraine for the financial support under project F25.2/067.
References
1. Kuhs W F, Nitsche R and Scheunemann K, 1978. The crystal structure of Cu6PS5Br, a
new superionic conductor. Acta Cryst. B 34: 64-70.
2. Nilges T and Pfitzner A, 2005. A structural differentiation of quaternary copper argirodites: Structure – property relations of high temperature ion conductors. Z. Kristallogr. 220: 281-294.
3. Studenyak I P, Kovacs Gy Sh, Orliukas A S and Kovacs E T, 1992. Temperature variations of dielectric and optical properties in Cu6PS(Sе)5Hal superionics and
ferroelastics in the range of phase transitions. Izv. AN SSSR, Ser. Fiz. 56: 86-93. 4. Studenyak I P, Stefanovich V O, Kranjčec M, Desnica D I, Azhnyuk Yu M, Kovacs
Gy Sh and Panko V V, 1997. Raman scattering studies of Cu6PS5Hal (Hal=Cl,Br,I)
fast-ion conductors. Solid State Ionics 95: 221-225.
5. Haznar A, Pietraszko A and Studenyak I P, 1999. X-ray study of the superionic phase transition in Cu6PS5Br. Solid State Ionics 119: 31-36.
6. Fiechter S, Eckstein J and Nitsche R, 1983. Vapour growth of argyrodite-type ionic conductors Cu6PS5Hal. J. Cryst. Growth 61: 275-283.
7. Skritskii V, Valyavichus V, Samulionis V, Studenyak I P, Kovacs Gy Sh and Panko V V, 1989. Temperature dependences of elastic properties in Cu6PS5Br
superionic single crystals. Fiz. Tverd. Tela 31: 234-236.
8. Samulionis V, Banys J, Vysochanskii Y and Studenyak I, 2006. Investigation of ultrasonic and acoustoelectric properties of ferroelectric-semiconductor crystals. Ferroelectrics 336: 29-38.
9. Kaynts D I, Studenyak I P, Nebola I I and Horvat A A, 2003. Ferroelastic domains in Cu6PS5X (X = I, Br, Cl) crystals. Ferroelectrics 290: 23-27.
10.Studenyak I P, Kranjčec M, Suslikov L M, Kovacs Gy Sh and Hadmashy Z P, 2002. Birefringence in Cu6PS5Br crystals. Ukr. Fiz. Zhurn. 47: 447-450.
11.Girnyk I, Kaynts D, Krupych O, Martunyuk-Lototska I and Vlokh R, 2003. x,T- phase diagram of the Cu6PS5IxBr1-x mixed crystals. Optical, dilatation and ultrasonic velocity
studies. Ukr. J. Phys. Opt. 4: 147-153.
13.Studenyak I P, Kranjcec M, Kovacs Gy Sh, Panko V V, Desnica I D, Slivka A G and Guranich P P, 1999. The effect of temperature and pressure on the optical absorption edge in Cu6PS5X (X= Cl, Br, I) crystals. J. Phys. Chem. Sol. 60: 1897-1904.
14.Kranjčec M, Studenyak I P, Kovacs Gy Sh and Mitrovcij V V, 2002. Compositional disordering and some structural and optical parameters of Cu6P(S1-xSex)5Br mixed
crystals. Mat. Sci. Engin. B 95: 107-110.
15.Studenyak I P, Stephanovich V O, Bilanchuk V V, Panko V V and Studenyak Ya I, 2004. Influence of structural disordering on phonon and electron spectra of Cu6+δPS5Br superionic crystals. Func. Mat. 11: 363-366.
16.Ingale A and Rustagi K C, 1998. Raman spectra of semiconductor nanoparticles: Disorder-activated phonons. Phys. Rev. B 58: 7197-7204.
17.Hwang Y N, Park S H and Kim D, 1998. Size-dependent surface phonon mode of CdSe quantum dots. Phys. Rev. B 59: 7285-7288.
18.Gomonnai A V, Voynarovych I M, Solomon A M, Azhniuk Yu M, Kikineshi A A, Pinzenik V P, Kis-Varga M, Daroczy L and Lopushansky V V, 2003. X-ray diffraction and Raman scattering in SbSI nanocrystals. Mat. Res. Bull. 38: 1767-1772. 19.Ruppin R, 1975. Thermal fluctuations and Raman scattering in small spherical
crystals. J. Phys. C: Solid State Phys. 8: 1969-1978.
Studenyak I.P., Buchuk R.Yu., Kranjcec M., Stephanovich V.O.,Panko V.V. and Kokenyesi S., 2009. Peculiarities of Raman scattering in nanometric superionic conductors Cu6PS5Br.
Ukr.J.Phys.Opt. 10: 150-156.
Анотація. Суперіонні провідники Cu6PS5Br були отримані у нанокристалічному стані з
використаннямкульовогомлину. Методомспектроскопіїкомбінаційногорозсіяннясвітла
досліджено фононні спектри мікро- і нанорозмірних порошків. При зменшенні розміру
кристалів нами спостерігався суттєвий зсув смуги комбінаційного розсіяння у
низькочастотну область, її розширення і відповідне зменшення інтенсивності.
Особливості поведінки спектрів комбінаційного розсіяння світла нанорозмірних