REMITTANCE INFLOWS AND
ECONOMIC GROWTH: THE CASE OF
DEVELOPING COUNTRIES
Tolina Fufa*1, Casey Abington1, Tekle Wanorie1
1Department of Economics, Northwest Missouri State University, Maryville, MO 64468, USA
Abstract
This paper investigates the long-run growth effect of remittance flows to developing countries using the dynamic panel generalized-method-of-moments (GMM) estimators with Windmeijer (2005) correction. Our results indicate that the link between remittance inflows and economic growth is conditional on the extent of financial depth and quality of governance of the recipient countries.
Keywords: Remittances; Economic growth; GMM
INTRODUCTION
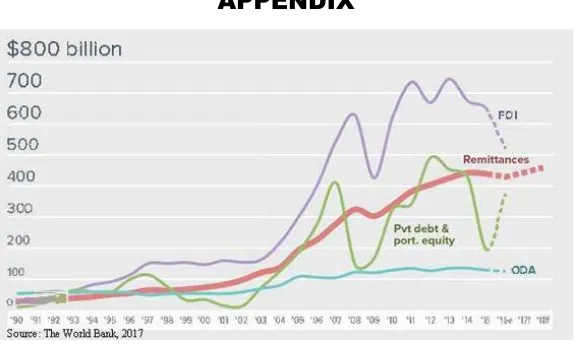
According to the World Bank, the officially recorded remittances to developing countries have increased from $49 billion in 1990 to $429 billion 2016. This amount represents about 75% of global remittance flows (World Bank, 2017) [1]. Furthermore, remittance flows to developing countries are more than three times the size of Official Development Assistance (ODA), which amounted to $142.6 billion in 2016, and are relatively more stable than cyclical private debt and equity flows (see Figure 1 in the Appendix). The sheer size of remittances has been continuously growing and now represents the second largest source of external funding for developing countries, behind foreign direct investment (FDI), which totaled $646 billion in 2016 (UNCTAD, 2017) [2]. It is also believed that billions more are transferred through unofficial channels.
by an altruistic motive (i.e., to help smooth consumption of the receiving family members), and/or a self-interest motive (i.e., as investment during good times) (Lucas & Stark, 1985; Rapoport & Docquier, 2006; Lueth & Ruiz-Arranz, 2008; Adams, 2009) [3]. Given that remittances are private financial flows that could be used to finance consumption and investment, they could potentially contribute to capital accumulation, both physical and human. This would then result in an increase in economic growth of the receiving economy by augmenting domestic sources of income, improving the creditworthiness of domestic investors (enhancing their collateral), and consequently, lowering the cost of capital in the domestic economy, and by improving domestic macroeconomic stability (or reducing output volatility). These effects, however, depend on the extent to which remittances are directed towards investment. If a significant portion of remittances goes to consumption, they could contribute towards poverty reduction and consumption smoothing and thus, short-run economic growth, but not necessarily to long-term economic growth (Barajas et al., 2009; Chami et al., 2005; IMF, 2005; World Bank, 2006) [4]. Remittance inflows could also exert a negative impact on labor force participation by encouraging consumption of leisure as the recipients can substitute unearned income for labor income, and could therefore dampen long-term economic growth (Chami et al., 2005). Theory also shows that remittance inflows may affect total factor productivity (TFP) growth through effects on the efficiency of domestic investments and the size of domestic production externalities generated by an economy (Barajas et al., 2009).
On the other hand, the empirical studies are also inconclusive. A number of empirical studies show that remittance inflows enhance investment, facilitate human capital formation, and total factor productivity and hence contribute positively to economic growth (IMF, 2005; World Bank, 2006; Ahortor & Adenutsi, 2009; Salahuddin & Gow, 2015; Borja, 2017). At the same time, a host of other empirical studies show that remittance inflows exert either no discernible or even negative effect on long-run economic growth (Barajas et al., 2009; Chami et al., 2005; Gupta, 2006; Lim & Simmons, 2015). Some of the studies show that remittances may hamper economic growth through a Dutch Disease effect (Acosta et al., 2009; Barajas et al., 2011) or by reducing labor supply and increasing investment risk (Chami et al., 2005), or by negatively affecting quality of domestic institutions (Abdih et al., 2012). Still other studies show that the growth effects of remittance inflows depend on the recipient countries’ domestic factors (Catrinsecu et al., 2009; Giuliano & Ruiz-Arranz, 2009).
minimize the potential instrument proliferation issue, which could bias the regression results downwards, this study contributes to the existing body of research in that it focuses only on developing countries (given that the growth impacts of remittances could differ between developed and developing countries), controls for six governance indicators besides the common control variables, examines if the growth effect of remittance is conditional on domestic factors including financial depth and quality of governance. The study also uses data averaged over five year period to minimize the effects of business cycle fluctuations from masking the long-run growth impact of remittance inflows.
Our results show that the effect of remittance inflow on economic growth depends on the extent of financial depth and the quality of governance of the recipient countries. Thus, any effort at boosting the growth effect of remittance should focus on strengthening the financial system and improving the quality of governance of the recipient countries.
The remainder of the paper is organized as follows. Section 2 describes the data. Section 3 discusses the econometric methodology employed and Section 4 provides the empirical results of the study. Finally, Section 5 concludes the paper.
DATA AND PRELIMINARY ANALYSIS
This study employs a panel of 48 countries for which we have complete data on remittance inflows and control variables for the period 1996-2016. Our growth regressions are estimated using five-year averages of all variables. The dependent variable is economic growth as measured by a country’s annual percentage change in real GDP per capita. The control set is comprised of remittance inflows to GDP ratio along with other variables commonly found to be robustly significant in previous studies. Our World Bank remittance measure reflects annual inflows from personal transfers, employee compensation, and migrants’ transfers. Additionally, the full set of explanatory variables includes initial real GDP per capita, government consumption expenditures to GDP ratio, domestic credit to GDP ratio, inflation rate, population growth rate, trade openness, average years of schooling, real effective exchange rates, and measures of governance. Six separate measures reflecting different dimensions of governance are explored. These include voice and accountability, political stability and absence of violence, government effectiveness, regulatory quality, rule of law, and control of corruption. In addition to these separate measures, we formed a single governance variable which gives the combined average of the six aforementioned dimensions.
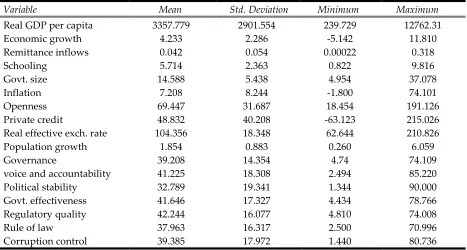
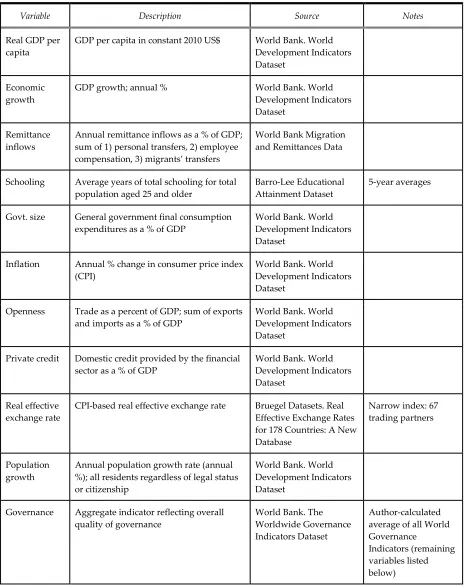
include these variables in our model. The measure of years of schooling serves as a proxy for a country’s level of human capital, which economic theory tells us is important for growth. Analyzing the governance variables contributes to the existing literature as they are relatively new measures and have not been included in many studies. See Table 1 in the Appendix for a full list of variables along with descriptions and sources for each. Summary statistics for each variable are shown in Table 2 below.
TABLE 2. SUMMARY STATISTICS
Variable Mean Std. Deviation Minimum Maximum
Real GDP per capita 3357.779 2901.554 239.729 12762.31
Economic growth 4.233 2.286 -5.142 11.810
Remittance inflows 0.042 0.054 0.00022 0.318
Schooling 5.714 2.363 0.822 9.816
Govt. size 14.588 5.438 4.954 37.078
Inflation 7.208 8.244 -1.800 74.101
Openness 69.447 31.687 18.454 191.126
Private credit 48.832 40.208 -63.123 215.026 Real effective exch. rate 104.356 18.348 62.644 210.826
Population growth 1.854 0.883 0.260 6.059
Governance 39.208 14.354 4.74 74.109
voice and accountability 41.225 18.308 2.494 85.220 Political stability 32.789 19.341 1.344 90.000 Govt. effectiveness 41.646 17.327 4.434 78.766 Regulatory quality 42.244 16.077 4.810 74.008
Rule of law 37.963 16.317 2.500 70.996
Corruption control 39.385 17.972 1.440 80.736
Note: Except real GDP per capita, schooling, real effective exchange rate, and governance indicators, all variables are expressed as percentage values.
ECONOMETRIC METHODOLOGY
We examine the causal link between economic growth and remittance inflow using the dynamic panel generalized-method-of-moments (GMM) estimators [5]. The cross-country growth regression we estimate can be written as follows:
Note that we can rewrite (1) as:
𝑦𝑖,𝑡 = 𝛼𝑦𝑖,𝑡−1 + 𝛽′𝑋𝑖,𝑡 + τt + 𝜇𝑖 + 𝜀𝑖,𝑡 (2) So that the model can equally be thought of as being for the increase or level of y.
Model (2) contains the lagged dependent variable as an explanatory variable in the same regression. Applying OLS estimator to this model results in biased and inconsistent estimates, since the lagged real per capita GDP is correlated with the country fixed effects in the error term. To remove this dynamic panel bias, Holtz-Eakin et al., (1988) and Arellano and Bond (1991) propose the first-difference transform of (2) as follows:
𝑦𝑖,𝑡−𝑦𝑖,𝑡−1= 𝛼(𝑦𝑖,𝑡−1− 𝑦𝑖,𝑡−2) + 𝛽′(𝑋𝑖,𝑡−𝑋𝑖,𝑡−1) + (𝜀𝑖,𝑡 − 𝜀𝑖,𝑡−1) (3) Although the fixed effects are expunged, the lagged per capita GDP as well as any of the control variables in 𝑋 are still potentially endogenous. To overcome this problem, Arellano and Bond (1991) uses the lagged levels of the explanatory variables as instruments under the assumptions that the error term,𝜀, is not serially correlated and that the explanatory variables are weakly exogenous (i.e., they are uncorrelated with future realizations of error terms). Specifically, this dynamic panel estimator commonly referred to as Difference GMM, uses the following moment conditions:
𝐸[𝑦𝑖,𝑡−𝑙(ℇ𝑖,𝑡− ℇ𝑖,𝑡−1)] = 0 for 𝑙 ≥ 2 ; 𝑡 = 3, … , 𝑇 , (4) 𝐸[𝑋𝑖,𝑡−𝑙(ℇ𝑖,𝑡− ℇ𝑖,𝑡−1)] = 0 for 𝑙≥ 2 ; 𝑡 = 3, … , 𝑇 , (5)
However, Blundell and Bond (1998) demonstrate that when explanatory variables are persistent over time, the untransformed lagged levels of these variables are weak instruments for transformed variables and this adversely affects the small- sample and asymptotic properties of Difference GMM.
𝐸[𝑦𝑖,𝑡+𝑝µ𝑖] =𝐸[𝑦𝑖,𝑡+𝑞µ𝑖] and 𝐸[𝑋𝑖,𝑡+𝑝µ𝑖] =𝐸[𝑋𝑖,𝑡+𝑞µ𝑖], for all p and q (6)
The additional moment conditions for the regression in levels are:
𝐸[(𝑦𝑖,𝑡−𝑙 − 𝑦𝑖,𝑡−𝑙−1)(µ𝑖 + ℇ𝑖,𝑡)] = 0 for 𝑙 = 1, (7) 𝐸[(𝑋𝑖,𝑡−𝑙− 𝑋𝑖,𝑡−𝑙−1)(µ𝑖+ ℇ𝑖,𝑡)] = 0 for 𝑙 = 1. (8)
The dynamic panel GMM-sometimes referred to as System GMM-, thus, uses the moment conditions in Eqs. (4), (5), (7), and (8) to generate consistent and efficient estimates.
The consistency of dynamic panel GMM rests on the validity of the instruments and the assumption that the error terms do not exhibit serial correlation. In particular, the estimator can suffer from a potential instrument proliferation; where by the instrument count may become equal to or larger than the number of cross-sectional units and thereby over -fitting the instrumented variables they may fail to remove the endogenous components of the variables and result in a biased parameter estimates towards those from non-instrumenting estimators. We can reduce this instrument count problem by either restricting the instruments to certain lags instead of all available lags or by collapsing the instrument matrix. The latter can be formally expressed as:
𝐸[𝑦𝑖,𝑡−𝑙(ℇ𝑖,𝑡− ℇ𝑖,𝑡−1)] = 0 for each 𝑙 ≥ 2 , (9) 𝐸[𝑋𝑖,𝑡−𝑙(ℇ𝑖,𝑡− ℇ𝑖,𝑡−1)] = 0 for each 𝑙 ≥ 2 . (10)
In dynamic panel GMM, we replace the moment conditions of the standard difference GMM (4 and 5) with (9) and (10). The new moment conditions state the same orthogonality assumption between the lagged levels and the differenced error term as (4) and (5) but we only want the estimator to minimize the magnitude of the empirical moments ∑𝑡𝑦𝑖,𝑡−𝑙(𝑒𝑖,𝑡− 𝑒𝑖,𝑡−1) for each 𝑙, rather than separate moments ∑𝑡,𝑙𝑦𝑖,𝑡−𝑙(𝑒𝑖,𝑡 − 𝑒𝑖,𝑡−1) for each 𝑙 and t (Roodman, 2009). This method, known as the Windmeijer correction, significantly minimizes the potential biases that arise due to over identification problem and boosts the efficiency of our estimates without losing information, as no lags are actually dropped.
EMPIRICAL RESULTS
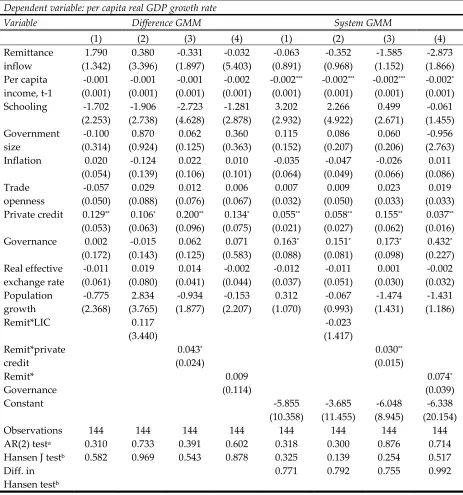
To estimate the causal link between remittance inflow and economic growth, we use both dynamic panel difference and system GMM estimators with five-year averaged dataset. As can be seen in Table 3, the coefficient estimate of remittance inflow is statistically not significant, implying that remittance inflow has no significant effect on economic growth of the countries studied during the 1996-2016 period. This result holds true after we control for initial income per capita, average years of schooling, government size, inflation rate, trade openness, private credit, population growth, governance, real effective exchange rate, and time dummies (results not indicated in the table)[8]. Given that our sample countries are at different income strata
(9 are low-income while 39 are middle-income countries, according to the World Bank’s official income classification)[9], we also investigate if remittance inflow exerts varying effects on economic growth depending on the income group of the sample countries. As can be seen in regression (2) of Table 3, the estimated coefficient of the interaction term between remittance inflow and an indicator variable LIC (LIC=1 if the country is a low-income, and 0 if middle income) is statistically not significant, implying that the growth effect of remittance inflow does not vary depending on the income group of the countries studied.
Similarly, the coefficient estimate of remittance inflow is negative and statistically not significant (regression 4) whereas the estimated coefficient of the interaction term between remittance inflow and governance is statistically significant at 10% (system GMM), indicating that remittance inflow enhances economic growth in those countries that possess a higher quality governance.
TABLE 3. REMITTANCE INFLOW AND ECONOMIC GROWTH: GMM REGRESSION RESULTS
Dependent variable: per capita real GDP growth rate
Variable Difference GMM System GMM
(1) (2) (3) (4) (1) (2) (3) (4) Remittance inflow 1.790 (1.342) 0.380 (3.396) -0.331 (1.897) -0.032 (5.403) -0.063 (0.891) -0.352 (0.968) -1.585 (1.152) -2.873 (1.866) Per capita income, t-1 -0.001 (0.001) -0.001 (0.001) -0.001 (0.001) -0.002 (0.001) -0.002*** (0.001) -0.002*** (0.001) -0.002*** (0.001) -0.002* (0.001) Schooling -1.702
(2.253) -1.906 (2.738) -2.723 (4.628) -1.281 (2.878) 3.202 (2.932) 2.266 (4.922) 0.499 (2.671) -0.061 (1.455) Government size -0.100 (0.314) 0.870 (0.924) 0.062 (0.125) 0.360 (0.363) 0.115 (0.152) 0.086 (0.207) 0.060 (0.206) -0.956 (2.763) Inflation 0.020
(0.054) -0.124 (0.139) 0.022 (0.106) 0.010 (0.101) -0.035 (0.064) -0.047 (0.049) -0.026 (0.066) 0.011 (0.086) Trade openness -0.057 (0.050) 0.029 (0.088) 0.012 (0.076) 0.006 (0.067) 0.007 (0.032) 0.009 (0.050) 0.023 (0.033) 0.019 (0.033) Private credit 0.129**
(0.053) 0.106* (0.063) 0.200** (0.096) 0.134* (0.075) 0.055** (0.021) 0.058** (0.027) 0.155** (0.062) 0.037** (0.016) Governance 0.002
(0.172) -0.015 (0.143) 0.062 (0.125) 0.071 (0.583) 0.163* (0.088) 0.151* (0.081) 0.173* (0.098) 0.432* (0.227) Real effective exchange rate -0.011 (0.061) 0.019 (0.080) 0.014 (0.041) -0.002 (0.044) -0.012 (0.037) -0.011 (0.051) 0.001 (0.030) -0.002 (0.032) Population growth -0.775 (2.368) 2.834 (3.765) -0.934 (1.877) -0.153 (2.207) 0.312 (1.070) -0.067 (0.993) -1.474 (1.431) -1.431 (1.186) Remit*LIC 0.117
(3.440) -0.023 (1.417) Remit*private credit 0.043* (0.024) 0.030** (0.015) Remit* Governance 0.009 (0.114) 0.074* (0.039)
Constant -5.855
(10.358) -3.685 (11.455) -6.048 (8.945) -6.338 (20.154) Observations 144 144 144 144 144 144 144 144 AR(2) testa 0.310 0.733 0.391 0.602 0.318 0.300 0.876 0.714
Hansen J testb 0.582 0.969 0.543 0.878 0.325 0.139 0.254 0.517
Diff. in Hansen testb
0.771 0.792 0.755 0.992
regressions include interaction terms between remittance inflow and a dummy variable for low-income countries (LIC=1 if low low-income country and 0 otherwise) in (2), private credit in (3), governance in (4); all regressions incorporate Windmeijer correction (2005), with robust standard errors in parentheses; *,**,*** indicate significance at the 10%, 5%, and 1% level, respectively; P-values of post-estimation tests are reported; (a) The null hypothesis is that the errors in the first-difference regression exhibit no second-order serial correlation; (b) The null hypothesis is that the instruments used are not correlated with the residuals.
The coefficient estimate of the quality of governance indicator is also statistically significant (system GMM), indicating the importance of institutions in facilitating economic growth. All control variables, with the exception of private credit, governance, and lagged per capita income, enter all of the regressions with statistically insignificant coefficients.
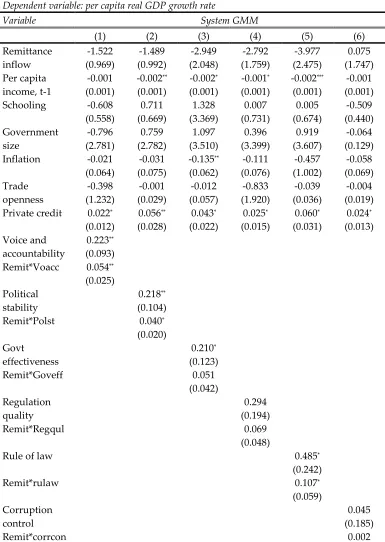
The governance index is composed of six indicators (voice and accountability, political stability, government effectiveness, regulation quality, rule of law, and control of corruption) and we are interested in identifying if some of the indicators are more important than others in boosting the effect of remittance inflow on economic growth of the recipient countries. Table 4 displays the regression results.
As we can see, the coefficient estimates of voice and accountability, political stability, government effectiveness, rule of law, and the interaction terms between remittance inflow and voice and accountability, remittance inflow and political stability, remittance inflow and rule of law are all statistically significant while the coefficients of regulation quality, control of corruption, and the interaction terms between remittance inflow and regulation quality, and remittance inflow and control of corruption are not significant. This indicates that, having a government structure that promotes voice and accountability, ensures political stability, and upholds rule of law is an important prerequisite to the realization of the potential growth effects of remittance inflows. This finding is in line with the works of Kaufmann and Kraay (2002), and Liu et al., (2018) that conclude that good governance can promote economic growth by nurturing systems and government policies that foster enabling environment for efficient resource utilization; or as Liu et al., (2018) describes it by encouraging the “helping hands” of power while inhibiting the “grabbing hands” of power.
World Bank (2006), to mention a few, that also found that the growth effect of remittances depends on a variety of domestic factors, including political and economic policies and institutions. The post-estimation tests also confirm that our results are robust and valid.
TABLE 4. REMITTANCE INFLOW, GOVERNANCE, AND ECONOMIC GROWTH: SYSTEM GMM REGRESSION RESULTS
Dependent variable: per capita real GDP growth rate
Variable System GMM
(1) (2) (3) (4) (5) (6)
Remittance inflow -1.522 (0.969) -1.489 (0.992) -2.949 (2.048) -2.792 (1.759) -3.977 (2.475) 0.075 (1.747) Per capita income, t-1 -0.001 (0.001) -0.002** (0.001) -0.002* (0.001) -0.001* (0.001) -0.002*** (0.001) -0.001 (0.001) Schooling -0.608
(0.558) 0.711 (0.669) 1.328 (3.369) 0.007 (0.731) 0.005 (0.674) -0.509 (0.440) Government size -0.796 (2.781) 0.759 (2.782) 1.097 (3.510) 0.396 (3.399) 0.919 (3.607) -0.064 (0.129) Inflation -0.021
(0.064) -0.031 (0.075) -0.135** (0.062) -0.111 (0.076) -0.457 (1.002) -0.058 (0.069) Trade openness -0.398 (1.232) -0.001 (0.029) -0.012 (0.057) -0.833 (1.920) -0.039 (0.036) -0.004 (0.019) Private credit 0.022*
(0.012) 0.056** (0.028) 0.043* (0.022) 0.025* (0.015) 0.060* (0.031) 0.024* (0.013) Voice and accountability 0.223** (0.093) Remit*Voacc 0.054**
(0.025) Political
stability
0.218**
(0.104) Remit*Polst 0.040*
(0.020) Govt
effectiveness
0.210*
(0.123)
Remit*Goveff 0.051
(0.042) Regulation
quality
0.294 (0.194)
Remit*Regqul 0.069
(0.048)
Rule of law 0.485*
(0.242)
Remit*rulaw 0.107*
(0.059) Corruption
control
0.045 (0.185)
(0.044) Real effective
exchange rate
-1.715 (3.164)
-0.024 (0.025)
-0.043 (0.061)
-0.030 (0.034)
-0.055 (0.041)
0.001 (0.023) Population
growth
-0.640 (1.115)
-0.222 (1.205)
-1.208 (2.013)
-2.026*
(1.185)
-2.846**
(1.271)
-2.803 (1.945) Constant 14.071
(21.983)
-3.732 (12.585)
-1.769 (21.510)
4.228 (22.179)
0.886 (21.040)
9.764*
(5.428) Observations 144 144 144 144 144 144 AR(2) testa 0.803 0.435 0.227 0.777 0.957 0.483
Hansen J testb 0.757 0.875 0.240 0.327 0.762 0.597
Diff. in Hansen testb
0.269 0.488 0.819 0.119 0.528 0.529
Notes: All variables are five-year averaged log values; all regressions control for income per capita (t-1), remittance inflow, schooling, government size, inflation, trade openness, private credit, real effective exchange rate, and population growth; in addition (1) controls for voice & accountability and its interaction term with remittance inflow, (2) controls for political stability and its interaction term with remittance inflow, (3) controls for government effectiveness and its interaction term with remittance inflow, (4) controls for regulation quality and its interaction term with remittance inflow, and (5) controls for rule of law and its interaction term with remittance inflow; all regressions incorporate Windmeijer correction (2005), with robust standard errors in parentheses; *,**,*** indicate significance at the 10%, 5%, and 1% level, respectively; P-values of post-estimation tests are reported; (a) The null hypothesis is that the errors in the first-difference regression exhibit no second-order serial correlation; (b) The null hypothesis is that the instruments used are not correlated with the residuals.
CONCLUSION AND POLICY IMPLICATIONS
This article examines the long-run growth effect of remittance flows to 48 developing countries using the dynamic panel generalized-method-of-moments (GMM) estimators with Windmeijer (2005) correction and five-year averaged data spanning from 1996-2016. The empirical results show that the growth effects of remittance inflow depend on the extent of financial deepening and the quality of governance of the recipient countries. Hence, any effort at boosting the growth effects of the huge remittance that flows into the developing countries should first focus on strengthening the financial system and other infrastructure that channel remittances into growth-enhancing activities, and promoting the quality of governance and domestic institutions that facilitate economic growth.
NOTES
[2] Excluding China, the remittance flows to low-and middle-income countries (LMICs) are also significantly larger than FDI in LMICs (World Bank, 2018).
[3] The literature also includes a third motive for remittance as informal arrangements between the migrant and family members regarding migration and remittance whereby the former appears to remit a fraction of their earned income on a regular basis (Lucas & Stark, 1985).
[4] In addition, if remittances are perceived to be permanent, they may tend to stimulate additional consumption rather than investment (Barajas et al., 2009).
[5] For a detailed description of the various GMM estimators, refer to Arellano & Bond (1991); Arellano & Bover (1995); Blundell & Bond (1998); Hansen (1982); and Roodman (2009).
[6] The new instruments seem more valid for variables that are very persistent over time, random walk-like variables, as past changes may be more predictive of contemporaneous levels than past levels are of current changes.
[7] Remember that we have assumed error term is not serially correlated.
[8] The results hold true when we also control for labor force participation rate (instead of population growth), and gross fixed capital formation-to-GDP ratio, which proxies for investment rate.
[9] See the appendix for the list of the countries included in the study.
[10] Giuliano & Ruiz-Arranz (2009), however, found a significant negative interaction term between remittance and financial deepening and argue that remittances boost growth in countries with less developed financial systems by providing an alternative way to finance investment and relaxing credit constraints.
REFERENCES
Abdih, Y., Chami, R., Dagher, J., & Montiel, P. (2012). Remittances and institutions: Are remittances a curse?. World Development, 40(4), 657-666.
Acosta, P. A., Lartey, E. K. K, & Mandelman, F. S. (2009). Remittances and the Dutch Disease.
Federal Reserve Bank of Atlanta Working Paper.
Adams, H. (2009). The determinants of international remittances in developing countries. World
Development, 37(1), 93-101.
Ahortor, C., & Adenutsi, D. (2009). The impact of remittances on economic growth in small-open developing economies. Journal of Applied Sciences, 9(18), 3275-3286.
Arellano, M., & Bond, S. (1991). Some tests of specification for panel data: Monte Carlo evidence and an application to employment equations. Review of Economic Studies, 58(2), 277-297. Arellano, M., & Bover, O. (1995). Another look at the instrumental-variable estimation of error-components models. Journal of Econometrics, 68, 29-52.
Barro, R., & Lee, J.W. (2013). A New Data Set of Educational Attainment in the World, 1950-2010. Journal of Development Economics, 104, 184-198.
Blundell, R., & Bond, S. (1998). Initial conditions and moment restrictions in dynamic panel data models. Journal of Econometrics, 87, 115-143.
Borja, K. (2017). Corruption indicators, foreign capital, and economic growth in developing countries. The Journal of Developing Areas, 51(4), 95-107.
Bruegel. (2018). Real effective exchange rates for 178 countries: a new database. http://bruegel.org/publications/datasets/real-effective-exchange-rates-for-178-countries-a-new-database/. (Accessed September 12, 2018, at 10:30).
Catrinescu, N., Leon-Ledesma, M., Piracha, M., & Quillin, B. (2009). Remittances, institutions, and economic growth. World Development, 37(1), 81-92.
Chami, R., Fullenkamp, C., & Jahjah, S. (2005). Are immigrant remittance flows a source of capital for development?. IMF staff papers (53). International Monetary Fund, 1.
Giuliano, P., & Ruiz-Arranz, M. (2009). Remittances, financial development, and growth. Journal
of Development Economics, 90(1), 144-152.
Gupta, P. (2006). Macroeconomic determinants of remittances: evidence from India. Economic
and Political Weekly, 41(26), 2769-2775.
Hansen, L.P., (1982). Large sample properties of generalized method of moments estimators.
Econometrica, 50(4), 1029-1054.
Holtz-Eakin, D., Newey, W., & Rosen, H. (1988). Estimating vector autoregressions with panel data. Econometrica, 56(6), 1371-1395.
International Monetary Fund. (2005). World economic outlook, April 2015: globalization and
external imbalances. World Economic and Financial Surveys, Washington.
Kaufmann, D., & Kraay, A. (2002). Growth without governance. Economia, 3(1), 169-229. Lim, S., & Simmons, W.O. (2015). Do remittances promote economic growth in the Caribbean community and Common market?. Journal of Economics and Business, 77, 42-59.
Liu, J., Tang, J., Zhou, B., & Liang, Z. (2018). The effect of governance quality on economic growth: Based on China’s provincial panel data. Economies, 6(5), 56.
Lucas, R. E. B., & Stark, O. (1985). Motivation to remit: evidence from Botswana. Journal of
Political Economy, 93, 901-918.
Lueth, E., & Ruiz-Arranz, M. (2008). Determinants of bilateral remittance flows. The B.E. Journal
of Macroeconomics, 8(1), 1-23.
Roodman, D. (2009). A note on the theme of too many instruments. Oxford Bulletin of Economics
andStatistics, 71, 135-158.
Salahuddin, M. & Gow, J. (2015). The relationship between economic growth and remittances in the presence of cross-sectional dependence. The Journal of Developing Areas, 49(1), 207-221. United Nations Conference on Trade and Development (UNCTAD). (2017). World investment
report: Investment and the digital economy. United Nations Publication, Geneva.
Windmeijer, F. (2005). A finite sample correction for the variance of linear efficient two-step GMM estimators. Journal of Econometrics, 126, 25-51.
World Bank. (2016). Global economic prospects: economic implications of remittances and
migration.
http://documents.worldbank.org/curated/en/507301468142196936/Global-economic-prospects-2006-economic-implications-of-remittances-and-migration. (Accessed September 12, 2018, at 13:50).
World Bank (2017). Migration and remittances: recent developments and outlook.
http://pubdocs.worldbank.org/en/992371492706371662/MigrationandDevelopmentBrief27.pdf. (Accessed September 12, 2018, at 15:40).
World Bank (2017). World Bank Migration and Remittances Data.
https://www.worldbank.org/en/topic/migrationremittancesdiasporaissues/brief/migration-remittances-data. (Accessed August 24, 2018, at 9:50).
World Bank (2017). World Bank World Development Indicators Dataset.
http://databank.worldbank.org/data/reports.aspx?source=world-development-indicators#. (Accessed August 24, 2018, at 10:55).
World Bank (2018). The world governance indicators project. http://info.worldbank.org/governance/wgi/index.aspx#home. (Accessed October 3, 2018, at 9:40). World Bank. (2018). Migration and remittances: recent developments and outlook.
https://www.knomad.org/sites/default/files/2018-04/Migration%20and%20Development%20 Brief%2029.pdf. (Accessed September 12, 2018, at 13:20).
APPENDIX
TABLE 1. VARIABLE DESCRIPTIONS AND SOURCES
Variable Description Source Notes
Real GDP per capita
GDP per capita in constant 2010 US$ World Bank. World Development Indicators Dataset
Economic growth
GDP growth; annual % World Bank. World Development Indicators Dataset
Remittance inflows
Annual remittance inflows as a % of GDP; sum of 1) personal transfers, 2) employee compensation, 3) migrants’ transfers
World Bank Migration and Remittances Data
Schooling Average years of total schooling for total population aged 25 and older
Barro-Lee Educational Attainment Dataset
5-year averages
Govt. size General government final consumption expenditures as a % of GDP
World Bank. World Development Indicators Dataset
Inflation Annual % change in consumer price index (CPI)
World Bank. World Development Indicators Dataset
Openness Trade as a percent of GDP; sum of exports and imports as a % of GDP
World Bank. World Development Indicators Dataset
Private credit Domestic credit provided by the financial sector as a % of GDP
World Bank. World Development Indicators Dataset
Real effective exchange rate
CPI-based real effective exchange rate Bruegel Datasets. Real Effective Exchange Rates for 178 Countries: A New Database
Narrow index: 67 trading partners
Population growth
Annual population growth rate (annual %); all residents regardless of legal status or citizenship
World Bank. World Development Indicators Dataset
Governance Aggregate indicator reflecting overall quality of governance
World Bank. The Worldwide Governance Indicators Dataset
Author-calculated average of all World Governance
Variable Description Source Notes
Voice and accountability
Extent to which citizens are able to participate in selecting government, freedom of expression, freedom of association, free media
World Bank. The Worldwide Governance Indicators
All World Governance Indicators are based on 30+ data sources that combine views from a large number of enterprise, citizen, and expert survey respondents
Political stability
Likelihood of political instability and/or politically motivated violence, terrorism
World Bank. The Worldwide Governance Indicators
Government effectiveness
Quality of public and civil services, independence from political pressures, quality of policy
formulation/implementation/commitment
World Bank. The Worldwide Governance Indicators
Regulatory quality
Ability of government to
formulate/implement policies that permit and promote private sector development
World Bank. The Worldwide Governance Indicators
Rule of law Quality of contract enforcement, property rights, police, and courts; likelihood of crime and violence
World Bank. The Worldwide Governance Indicators
Corruption control
Extent to which public power is used for private gain
World Bank. The Worldwide Governance Indicators
Countries included in the study: Algeria, Argentina, Bangladesh**, Benin*, Bolivia**, Botswana, Brazil, Burkina Faso*, Cameroon**, China, Colombia, Costa Rica, Cote d’Ivoire**, Dominican Republic, Egypt**, El Salvador**, Fiji, Ghana**, Guatemala**, Honduras**, India**, Indonesia**, Jamaica, Jordan**, Kenya**, Lesotho**, Madagascar*, Mali*, Mexico, Morocco**, Mozambique*, Niger*, Nigeria**, Pakistan**, Panama, Paraguay, Philippines**, Rwanda*, Senegal*, South Africa, Sri Lanka**, Sudan**, Suriname, Swaziland**, Thailand, Togo*, Tunisia**, and Turkey.
*represents low-income countries (LIC) (9);