A b s t r a c t. The aim of this research was to determine the ef-fects of traditional, reduced and no-tillage systems on the soil physi-cal properties: bulk density, water content, stability in water and soil physical quality. Traditional tillage involved soil inversion whereas reduced tillage and no-tillage were non-inversion systems. Soil phy-sical properties were measured on samples collected from the field throughout the growing season and harvest times. These included: particle size distribution, soil water content and bulk density. Soil sta-bility was measured in terms of the content of readily-dispersible clay (RDC) in the soil samples. From water retention curves, an in-dex of soil physical quality (Sindex) was calculated. The effect of tillage systems on the values of the physical properties was signi-ficant. The non-inversion plots (reduced tillage and no-tillage) in-creased water content and bulk density in the top layer in compari-son with traditional tillage. Reduced tillage and no-tillage reduced the amount of RDC and therefore increased soil stability, especial-ly in the top layer in comparison with traditional tillage. Reduced tillage and no-tillage also decreased theSindex after the first year in comparison with traditional tillage. However, after 4 years, the non-inversion plots (reduced tillage and no- tillage) showed some improvement in soil physical quality and soil stability in water.
K e y w o r d s: tillage systems, bulk density, water content, soil stability in water, readily-dispersible clay,soil physical quality
INTRODUCTION
Sustainable agriculture must protect the environment and at the same time produce good soil conditions for crop production. Therefore, there is growing interest in develo-ping systems of reduced tillage with mulching (conservation tillage) and no-tillage as alternative technologies to
traditio-nal tillage. Before introduction of soil conservation tillage several steps should be taken: the structure and fertility of the soil should be improved, pests including perennial weeds, insects and pathogens should be suppressed, and finally, the appropriate knowledge must be acquired (Dzienia et al., 2006). Reduced and no-tillage systems have effects on soil physical properties: bulk density, water content, soil sta-bility (Czy¿ and Dexter,2008; Gaþeet al.,2005, 2006a, b; Lipiec and Nosalewicz, 2004; Pabinet al.,2003) and soil physical quality (Dexter, 2004; Wereszczaka et al., 2009). Conservation tillage protects the subsoil against compaction and erosion by water. It can reduce run-off throughout the year (Dexteret al.,2004) reduce evaporative losses and can increase infiltration and can also increase the stability of the surface soil through increased organic matter content and increased biological activity. We are looking for soil phy-sical conditions that give good plant production whilst at the same time protecting the environment.
The aim of the research was to compare three different tillage systems (traditional, reduced and no-tillage) on some soil physical properties.
MATERIALS AND METHODS
Field experiments were done in 2003-2009 on a private farm at Rogów, in the Lubelskie voivodeship of Poland (50° 48’N, 23° 29’E, 230 m a.s.l.) on a silt loam soil that had been formed on loess, 60 km east from Lublin. A long-term field experiment with three tillage treatments was established in the autumn of 2002 (Czy¿ and Dexter, 2008). The soil is a silt loam formed on loess which is typical in this region and considered to be sensitive to erosion and compaction.
Soil physical properties as affected by traditional, reduced and no-tillage
for winter wheat**
E.A. Czy¿
1.2*
and A.R. Dexter
11Department of Soil Science, Erosion and Land Conservation, Institute of Soil Science and Plant Cultivation - National Research
Institute (IUNG-PIB), Czartoryskich 8, 24-100 Pu³awy, Poland
2University of Rzeszów, Faculty of Biology and Agriculture, Aleja Rejtana 16c, 35-959 Rzeszów, Poland
Received September 30, 2009; accepted October 22, 2009
© 2009 Institute of Agrophysics, Polish Academy of Sciences
*Corresponding author’s e-mail: ewac@iung.pulawy.pl
**The work was done under Programme of the Scientific Network, contract No. 17/E-164/SN-019/2007, grant PIB-IUNG 1.5; AGROGAS project ‘Reduction of greenhouse gas and ammonia in agriculture’ and grant No. 6ZR7 2006/06735.
A
A
Winter wheat was grown in three systems:
– traditional tillage (TT) with straw incorporation (chopped wheat straw) based on mouldboard ploughing (to 25 cm depth) and traditional soil management equipment, – reduced tillage (RT) with surface mulching with straw
based on a rigid-tine cultivator (to 10 cm depth),
– no-tillage (NT) with surface mulching with straw and direct sowing. TT involved soil inversion whereas RT and NT were non-inversion systems. Soil physical properties were measu-red on samples collected from the field at harvest time.
The long-term tillage experiment was set up in 2002 on 1 ha experimental plots with three replicates. The soil tillage treatments were established in October 2002 and sampled in each of the years 2003-2009. Winter wheat was sown in October and harvested in August.
The particle size distributions of the soils studied were determined by Casagrande’s hydrometer method modified by Prószyñski (Lityñskiet al.,1976). The organic matter content of the soils was measured by wet oxidation by the Tiurin me-thod (Ostrowskaet al.,1991). The annual precipitation is 588 mm on average with 376 mm within the growing season and tempe-rature 7.6 and 14.4°C, respectively (Table 1). Comparison of monthly air temperatures for the period 2003-2008 with the 120-year mean show, that from April to August were warmer
than the long-term average, except for 2004. Comparison of monthly precipitation for the periods 2003-2008 with the 120-year mean shows, that the period from April to August was drier than average in the 3 years: 2003-2005 and wetter than average in the 3 years: 2006-2008.
From each tillage treatment at the farm at Rogów, undisturbed soil cores of 100 cm3volume were collected after harvest (in the period August - October) in 2003-2008. Soil samples were taken from the 0-5, 5-10, 10-15, 20-25, 30-35 cm layers so as to include the cultivated layer, the pan and the non-tilled layers in 4 replicates.
For determination of bulk density (Mg m-3), and water content (%, m3m-3or kg kg-1) soil samples collected from the field were used. The soil samples were collected from soil pits that were dug in the field in the different treatments. For the above, 4 replicates were collected from each of the depth layers. The depth of sampling was selected to coincide with the depths of layers corresponding with the different til-lage practices. Undisturbed soil cores were taken by pushing stainless steel cylinders of 100 cm3vertically into the soil, and for each layer and location 4 replications were sampled. The cylinders were then closed and were placed in polythene bags to prevent water loss. Dry bulk density and water con-tent of the soils were measured in the laboratory by standard
Years
Months
I II III IV V VI VII VIII IX X XI XII IV-IX I-XII
Air temperatures (°C) Mean
2003 -4.3 -6.6 1.0 6.8 15.2 16.5 19.2 18.3 13.4 16.8 5.2 0.5 14.9 8.5
2004 -5.3 -1.2 2.2 8.0 11.9 15.9 17.9 18.0 12.7 9.9 3.4 1.2 14.1 7.9
2005 -0.5 -4.3 -0.7 8.7 12.7 15.5 19.8 17.0 14.1 8.6 2.4 -0.8 14.6 7.7
2006 -8.5 -4.9 -1.2 8.5 13.2 16.4 20.1 18.0 14.8 10.3 5.0 2.9 15.2 7.9
2007 2.8 -1.5 6.0 8.1 14.7 18.5 18.8 18.9 12.7 8.1 0.5 -1.4 15.3 8.8
2008 -0.2 1.9 3.5 9.0 13.1 17.3 18.2 18.5 12.6 10.0 4.4 0.4 14.8 9.1
2009 -3.2 -1.2 2.2 10.7 13.5 16.4 19.7 18.1 14.9 – – – 15.5 –
1871-1990 -3.5 -2.5 1.5 7.7 13.4 16.7 18.3 17.3 13.2 7.9 2.7 -1.4 14.4 7.6
Precipitation (mm) Total
2003 14.3 20.3 19.1 37.9 44.7 60.0 24.6 42.5 28.4 76.1 16.1 37.8 238.1 421.8
2004 14.7 25.5 22.1 95.3 31.3 33.7 59.7 61.3 42.2 35.5 69.3 19.3 323.5 509.9
2005 12.3 17.6 11.8 25.9 44.4 50.8 44.9 59.7 54.4 8.9 7.7 25.3 280.1 363.7
2006 5.7 14.2 29.2 38.0 58.9 40.2 35.7 214.6 28.8 16.3 32.5 7.3 416.2 521.4
2007 68.8 22.3 38.3 28.3 23.4 67.5 47.5 66.8 178 40.4 30.6 5.7 411.5 617.6
2008 20.5 19.8 52.9 67.6 81.9 62.2 93.8 115.2 88.2 32.4 21.4 19.3 508.9 675.2
2009 23.8 29.9 76.8 0.6 57.5 117.9 117.8 74.6 32.3 – – – 400.7 –
1871-1990 31 29 30 39 57 71 85 75 49 45 39 38 376 588
T a b l e 1.Comparison of mean monthly air temperatures (°C) and precipitation (mm) for the periods 2003-2009 with the 120-year
procedure. The determinations were done immediately after returning from the field so that further water loss was avoi-ded. The dry bulk density was calculated as the mass of dry soil per unit volume of moist soil.
Soil stability was measured by a turbidimetric method using samples from 5-10, 15-20 and 30-35 cm depths. Soil stability was measured in terms of the content of readily-dispersible clay (RDC) in the soil samples. The turbidimeter was a Hach model 2100AN as described in Czy¿ and Dexter (2008). The method used for determination of readily-dispersible clay, RDC (NTU/(g l)-1) and RDC (g 100 g-1 soil), is that described by Czy¿et al. (2002); Dexter and Czy¿ (2000), and is rather similar to that described by Kay and Dexter (1990); Watts and Dexter (1997) but was adap-ted for Polish sandy soils. Turbidity values are linearly pro-portional to the concentration of colloids (clay) in suspension (Dexter and Czy¿, 2000). The turbidimeter readings were expressed as NTU (Nephelometric Turbidity Units) and were normalized by dividing by the concentration of the origi-nal soil in the water to give NTU/(g l-1). The mass of soil was corrected to dry mass for this calculation. Ten replicates were used for each tillage system and depth at each place.
It was also considered the proportions of the soil clay content that are readily dispersible. We did this by using high energy inputs (30 min of intense stirring) to disperse all the clay followed by 18 h of sedimentation and measurement of turbidity (as described above) to obtain the normalized turbidity, T (NTU/(g l-1)), due to the total clay. We then calculated a factor,K, as follows:
K C
T
=éëê ùûú, (1)
where:Cis the total clay content (%) as measured in the particle size analysis,Kis a calibration factor that relates turbi-dity measurements to amounts of clay in suspension.Kmay be expected to be different for different soils because of differences in clay mineralogy (Czy¿ and Dexter, 2008).
For estimation of the soil physical quality (S) values, we measured water retention on undisturbed cylinder samples. Cylinder samples were wetted from below to saturation and then drained to water pressure,h, of 10, 20, 40, 80, 250 hPa. For pressures of 500, 1 000, 2 000, 4 000, 8 000, and 15 000 hPa, the measurements were made on crumbled soil fragments. The water contents,è, were measured gravimetrically. The mean
water contents for every value of pressure were then fitted to the van Genuchten (1980) equation. The non-linear van Genuchten equation was fitted iteratively to the experimental data for each sampling depth and date using the Levenberg-Marquardt method (Levenberg-Marquardt, 1963). The Mualem (1976) restriction fixing the relationship (m= 1–1/n) between the van Genuchten parameters n and m was applied.
The van Genuchten equation, when plotted asèagainst
ln(h) has an inflection point at which the curvature changes sign. From the parameters of the fitted van Genuchten equation, we calculated the water content at the inflection point,è
INFL, using the equation of Dexter and Bird (2001):
qINFL qsat qres q
m
res
m
= - éëê+ ùûú +
-( ) 1 1 , (2)
where: èsatand ères are the gravimetric water content at
saturation and the residual water content, respectively, and mis a shape parameter.èINFLcan be used as an estimate of
the optimum soil water content for tillage.
The slope of the water retention curves at the inflection point,S, was calculated according to Dexter (2004):
S n
m
sat res
m
=- - éëê+ ùûú
- +
( )
( )
q q 1 1
1
. (3)
TheSvalues were compared between the different til-lage systems. The relationship betweenSand soil bulk den-sity is significant. As shown by Dexter (2006) and Dexter and Czy¿ (2007), values ofScan be used to predict a range of other properties including: hydraulic conductivity, clod pro-duction during tillage, soil strength and root growth.Sis also related to the stability of soil in water as measured by the content of readily-dispersible clay (Gaþeet al., 2006a,b).
The literature presented above shows that theSindex is a useful addition to the range of approaches available to soil and tillage scientists. Use of theSindex enables us to iden-tify soil management practices for sustainable agriculture and for environmental protection.
The results were expressed as mean values: mean SEM. The results enable comparison of the inversion (TT) system with the non-inversion (RT and NT) systems. Statistical analysis of the measured values of soil bulk density, water content and the soil stability in water (measured as the con-tent of readily-dispersible clay) were done using the MiniTab© program. Differences at P<0.05 were considered to be sta-tistically significant.
RESULTS AND DISCUSSION
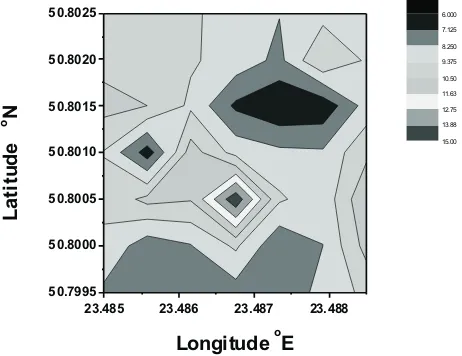
The particle size distribution of the experimental soil in 2003 was: 5% clay, 81% silt, 14% sand and 1.56% organic matter. Maps of organic matter and clay content (%) of the arable layer in 2003 at Rogów are shown in Figs 1 and 2.
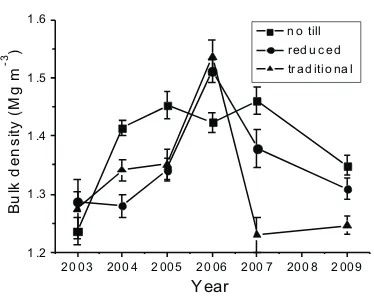
Analyzed values of soil bulk density for depth 0-15 cm confirm that on NT plot the highest values were at depth 7.5 cm and the lowest at 2.5 cm depth (Fig. 5). There were also trends showing decreased bulk densities after 7 years of use of the NT system. Here also we can see how decreased va-lues of bulk densities in the NT treatment occurred after 4-years use of this system tillage in comparison with TT and RT.
The results with the bulk density showed similar trends to those obtained with heavy soil observed in earlier research by Czy¿ (2005). In this reference, the effects of different tillage systems on physical properties of heavy soil in a 3-year field experiment were presented. The soil physical properties (bulk density, water content) in the 0-25 cm layer in the three diffe-rent tillage systems: traditional (mouldboard ploughing), redu-ced tillage and direct sowing. The value of bulk density, mean of three years, was highest with direct drilling (1.58 Mg m-3),
lower with reduced tillage (1.39 Mg m-3), and the lowest with conventional (ploughing) tillage (1.24 Mg m-3). Also Pranagal et al.(2005) presented results after 7 years of use of different tillage systems. Several authors have shown an increase in soil bulk density with reduced tillage or no-tillage system in compa-rison with the traditional tillage (plough) system. Some authors have shown in their experiments that such is the case with their soilsegFabrizziet al., 2005; Morenoet al.,1997; NiedŸwiecki and Pecio, 2008. However, some researchers have not found significant differences in bulk density between tillage treat-ments (Ferreraset al.,2000). Also Czy¿ and Dexter (2008) found that differences in bulk density were not significant with the loamy and loamy silt soils at the 0-10 cm depth. However, bulk density was greater in the 10-20 cm layer of loamy silt soils with NT in comparison with the TT and RT systems.
The effect of tillage system on water content at Rogów is shown in Fig. 6. There were no consistent effects of tillage on water contents at the times of sample collection. Compari-son of the effects of different tillage practices on water con-tent after 7 years show that RT and NT both had greater water contents in the top layer in comparison with the TT system.
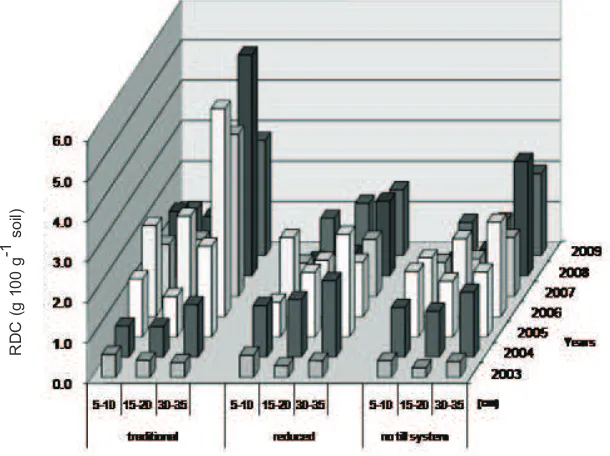
The RT and NT systems decreased mean values of readily-dispersible clay (RDC) throughout the whole profile and increased soil stability in comparison with traditional tillage (TT), especially in the top layer 5-10 cm (Fig. 7).
The results show effects of tillage systems on soil physi-cal quality,S, at 5-10 cm depth after 4 years (Fig. 8). After con-version from a soil incon-version system (TT) to a non- incon-version system (RT or NT), the soil physical quality deteriorates for the first 3 years before starting to improve. After one and two years, the RT and NT systems had smaller values of Sin comparison with TT. However, after four years both the RT and NT systems showed significantly increased values ofS.
The relationship between the index of soil physical qua-lity,S, and the content of readily-dispersible clay (RCD) has been published earlier by Gaþe et al.(2004) (Fig. 9).The boundaries between good and poor physical quality (S = 0.035) and between poor and very poor (S= 0.020) of the soils was suggested by Dexter (2004) and Dexter and Czy¿ (2007). Values ofSthat were measured on samples collected in the years 2003 and 2004 mainly followed the regression lines obtained forSvalues measured on samples collected in the previous year, except for theSvalues from Rogów that were well above the regression lines. At this location, the factor that had more significant effects on the dispersibility of clay minerals was the field water content of the soil samples. In 2003, the values ofRDCwere obtained on soil samples having around 0.10 kg kg-1water content, whereas the values ofRDCin the year 2004 were obtained on soil samples having around 0.24 kg kg-1water content. Although the silt loam soils from Rogów had quite good physical condition as quantified by theSindex, higher water contents at the time of collection of the soil samples led to the release of more dispersible clay in the year 2004.
23.485 23.486 23.487 23.488 50. 7995
50. 8000 50. 8005 50. 8010 50. 8015 50. 8020 50. 8025
LongitudeoE
L
a
ti
tu
d
e
o N
1.300 1.375 1.450 1.525 1.600 1.675 1.750 1.825 1.900
Fig. 1.Map of organic matter content (%) of the arable layer in
2003 at Rogów.
23.485 23.486 23.487 23. 488 50.7995
50.8000 50.8005 50.8010 50.8015 50.8020 50.8025
LongitudeoE
L
a
ti
tu
d
e
o N
6.000 7.125
8.250 9.375
10.50 11.63
12.75 13.88 15.00
Fig. 2.Map of clay content (%) of the arable layer in 2003 at
3 5 3 0 2 5 2 0 1 5 1 0 5 0
1.1 1.2 1.3 1.4 1.5 1.6 35
30 25 20 15 10 5 0
1.1 1.2 1.3 1.4 1.5 1.6
3 5 3 0 2 5 2 0 1 5 1 0 5 0
1.1 1.2 1 .3 1.4 1.5 1.6
3 5 3 0 2 5 2 0 1 5 1 0 5 0
1.1 1.2 1.3 1.4 1.5 1.6
35 30 25 20 15 10 5 0
1.1 1.2 1.3 1.4 1.5 1.6
3 5 3 0 2 5 2 0 1 5 1 0 5 0
1.1 1.2 1 .3 1.4 1.5 1.6
Bulk density ( Mg m-3)
D
e
p
th
(c
m
)
2004
Bulk density ( Mg m-3 )
D
e
p
th
(c
m
)
2005
Bulk density ( Mg m-3)
D
e
p
th
(c
m
)
2006
Bulk density (Mg m-3 )
D
e
p
th
(c
m
)
2007
Bulk density (Mg m- 3)
D
e
p
th
(c
m
)
2009
Bulk density ( Mg m-3 )
D
e
p
th
(c
m
)
NT redu ced trad itio nal 2003
Fig. 3.Effects of different tillage systems on soil bulk density (error bars show ±s.e.).
20 03 200 4 2 005 20 06 200 7 200 8 2 009 1 .2
1 .3 1 .4 1 .5 1 .6
B
u
lk
d
e
n
s
it
y
(M
g
m
-3 )
Year
n o t ill red u c ed tr ad it io na l
Fig. 4. Effects of different tillage systems on mean soil bulk
densities in the 0-15 cm layer (error bars show ±s.e.).
20 03 200 4 2 005 20 06 200 7 200 8 2 009 1 .1
1 .2 1 .3 1 .4 1 .5 1 .6
B
u
lk
d
e
n
s
it
y
(M
g
m
-3 )
Year
2 .5 c m 7. 5 c m 1 2.5 c m
Fig. 5.Trends in bulk density on the no till plot at three different
Soils with high contents of readily-dispersible clay in the presence of water may experience collapse of their structures. The importance played by water in weakening the bonds between particles that constitute the structure with the consequent loss of the inter-aggregate pores and soil homogenization has been discussed by Czy¿et al.(2002). Problems associated with clay dispersion include: anaerobic soil that is unsuitable for plant root growth, hard-setting on drying, and reduced infiltration of water with associated risk of run-off, flooding and erosion (Dexter and Czy¿, 2000). The importance of primary binding agents in stabilizing soil structure has been emphasized by Kay (1990). Readily-dis-persible clay (RDC) is also related to soil strength. A soil with a high content of readily-dispersible clay will be weak-er when wet and strongweak-er when dry than a soil with a low content of readily-dispersible clay. Reduced tillage decrea-sed the quantity of readily-dispersible clay (RDC) and there-fore increased soil stability, especially in the top layer 5-10 cm in both soils in comparison with traditional tillage (Czy¿ and Dexter, 2008; Dexter and Czy¿, 2000; Gaþeet al., 2004).
Several studies on soil quality have been focused on the role and importance of organic matter due to its great impact on physical, chemical and biological properties (Reeves, 1997).
It has been shown that organic matter reduces soil bulk densi-ty (Blanco-Canquiet al., 2009) and improves tilth in the sur-face horizons (Bruceet al., 1995). Usually, organic matter ma-kes soil easier to work and more friable (Watts and Dexter, 1998), and it stabilizes and holds soil particles together into ag-gregates (Tisdall, 1996). By improving pore size distribution and decreasing bulk density, it improves the soil ability to store and transmit air and water (Bruceet al., 1995; Kay, 1998).
CONCLUSIONS
1. In the top layer of the soil (0-15 cm) NT resulted in the highest mean values of soil bulk density at the 7.5 cm depth in comparison with the layers at 2.5 and 12.5 cm.
2. In the 0-15 cm layer after NT the highest mean values of soil bulk density occurred in comparison with TT and RT, excluding the wet year 2006.
3. There were no significant trends in soil water content at the times of sampling.
4. The non-inversion systems (RT and NT) decreased the content of readily-dispersible clay (RDC) and therefore increased soil stability, especially in the top layer (5-10cm) in comparison with inversion tillage (TT).
35 30 25 20 15 10 5 0
0.05 0. 10 0.15 0.20 0. 25 0.30
35 30 25 20 15 10 5 0
0. 05 0.10 0.15 0.20 0.25 0. 30
35 30 25 20 15 10 5 0
0.05 0.10 0.15 0. 20 0.25 0.30
35 30 25 20 15 10 5 0
0.05 0. 10 0.15 0.20 0. 25 0.30
35 30 25 20 15 10 5 0
0. 05 0.10 0.15 0.20 0.25 0. 30
35 30 25 20 15 10 5 0
0.05 0.10 0.15 0. 20 0.25 0.30 Wate r c ontent (kg k g-1)
D
e
p
th
(c
m
)
NT reduced traditional 2003
W ater c ontent (k g kg-1)
D
e
p
th
(c
m
)
2004
W ater content (kg k g-1)
D
e
p
th
(c
m
)
2005
Wate r c ontent (kg k g-1)
D
e
p
th
(c
m
)
2006
W ater c ontent (k g kg-1)
D
e
p
th
(c
m
)
2007
Water c ontent (kg k g-1)
D
e
p
th
(c
m
)
2009
Fig. 6.Effects tillage systems on soil water content (error bars show ±s.e.).
5. In the 0-15 cm layer during first three years, the non-inversion systems (RT and NT) decreased the soil physical quality as quantified by S. From the fourth year, the soil physical quality (as measured byS) in these non-inversion systems began to increase.
6. These results show that, after conversion from a non-inversion system (TT) to a non-non-inversion system (RT or NT), the soil physical quality deteriorates for the first 3 years before starting to improve. This illustrates the importance of long-term experiments in the study of the effects of tillage systems on soil physical properties.
REFERENCES
Blanco-Canqui H., Stone L.R., Schlegel A.J., Lyon D.J., Vigil M.F., Mikha M.M., Stahlman P.W., and Rice C.W., 2009. No-till induced increase in organic carbon reduces ma-ximum bulk density of soils. Soil Sci. Soc. Am. J., 73, 1871-1879.
Bruce R.R., Langdale G.W., West L.T., and Miller W.P., 1995. Surface soil degradation and soil productivity restoration and maintenance. Soil Sci. Soc. Am. J., 59, 654-660.
Czy¿ E.A., 2005.Effects of different soil tillage systems on some
soil physical properties and yield of maize in monoculture (in Polish). Pamiêtnik Pu³awski, 140, 35-47.
Fig. 7.Effects tillage systems on soil stability in water measured as the content of readily-dispersible clay, RDC (g 100 g-1soil).
RDC
(g
100
g
-1
soil)
Fig. 8.Effects tillage systems on soil physical quality values,S, at
5-10 cm depth in the first four years of use of different tillage systems.
S
values
0.000 0.010 0.020 0.030 0.040 0.050 0.060 0.070
0 1 2 3 4 5 6 7 8 9 10
RDC (NTU/(g L-1
))
V
a
lu
e
s
o
f
S
2003 2004
Fig. 9.Relationship between the index of physical quality,Sand
the content of readily-dispersible clay (in NTU/(g l-1)) (Gaþe
et al., 2004).
S
Czy¿ E.A. and Dexter A.R., 2008.Soil physical properties under winter wheat grown with different tillage systems at selected locations. Int. Agrophysics, 22, 191-201.
Czy¿ E.A., Dexter A.R., and Terelak H., 2002.Content of
readily-dispersible clay in the arable layer of some Polish soils. In: Sustainable Land Management-Environmental Protection. Advances in GeoEcology, 35, 115-124.
Dexter A.R., 2004.Soil physical quality: Parts I, II, III. Geoderma,
120, 201-239.
Dexter A.R., 2006.Applications ofS-theory in tillage research.
Proc. 17th Conf. ISTRO, August 28-September 3, Kiel, Germany.
Dexter A.R. and Bird N.R.A., 2001.Methods for predicting the
optimum and the range of water contents for tillage based on the water retention curve. Soil Till. Res., 57, 203-212.
Dexter A.R. and Czy¿ E.A., 2000.Effect of management on the
dispersibility of clay in a sand soil. Int. Agrophysics, 14, 269-272.
Dexter A.R. and Czy¿ E.A., 2007.Applications of S-theory in the
study of soil physical degradation and its consequences. Land Degr. Develop., 18(4), 369-381.
Dexter A.R., Czy¿ E.A., and NiedŸwiecki J., 2004.Water
run-off as affected by the distributions of values of hydraulic con- ductivity of the soil. Annual Rev. Agric. Eng., 3(1), 87-96.
Dzienia S., Zimny L., and Weber R., 2006.The newest trends In
soil tillage and techniques of sowing (in Polish). Fragmenta Agronomica, 22, 2(90), 227-241.
Fabrizzi K.P., García F.O., Costa J.L., and Picone L.I., 2005. Soil water dynamics, physical properties and corn and wheat responses to minimum and no-tillage systems in the southern Pampas of Argentina. Soil Till. Res., 81(1), 57-69. Ferreras L.A., Costa, J.L., Garcia F.O., and Pecorari C., 2000.
Effect of no-tillage on some soil physical properties of a structural degraded Petrocalcic Paleudoll of the southern “Pampa” of Argentina. Soil Till. Res., 54 (1-2), 31-39.
Gaþe O.P., Czy¿ E.A., and Dexter A.R., 2004.Effects of
readily-dispersible clay on soil quality and root growth. In: Plant Growth in Relation to Soil Physical Conditions (Eds J. Lipiec, R. Walczak, G. Jüzefaciuk). IA PAS, Lublin, Poland.
Gaþe O.P., Czy¿ E.A., and Dexter A.R., 2005. Soil physical
quality as affected by management practices. Proc. Conf. Eur. Geophysical Union, April 25-30, Vienna, Austria.
Gaþe O.P., Czy¿ E.A., and Dexter A.R., 2006a.Assessment and
prediction of soil physical quality for Polish arable layers. Proc. Int. Conf. Soil Protection Strategy-Needs Approaches for Policy Support, March 9-11, Pu³awy, Poland.
Gaþe O.P., Czy¿ E.A., and Dexter A.R., 2006b.Soil physical
quality, S, as a basis for relationships between key physical properties of arable soils. Advances in GeoEcology, 38, 102-109.
Kay B.D., 1990.Rates of change of soil structure under different
cropping systems. Adv. Soil Sci., 12, 1-52.
Kay B.D., 1998.Soil structure and organic carbon: a review. In:
Soils and Carbon Cycle. CRC Press, Boca Raton, FL, USA.
Kay B.D. and Dexter A.R., 1990.Influence of aggregate
diame-ter, surface area and antecedent water content on the dis-persibility of clay. Can. J. Soil Sci., 70, 655-671.
Lipiec J. and Nosalewicz A., 2004.The effects of soil compaction
on plant root growth, function and stomatal diffusive resis-tance. In: Plant growth in relation to soil physical conditions (Eds J. Lipiec, R. Walczak, G. Józefaciuk). IA PAS, Lublin, Poland.
Lityñski T., Jurkowska H., and Gorlach E., 1976.Agricultural
Chemical Analyses, Soils and Fertilizers (in Polish). PWN Press, Warsaw, Poland.
Marquardt D.W., 1963.An algorithm for least squares estimation of
non-linear parameters. J. Soc. Ind. Appl. Math., 11, 431-441. Moreno F., Pelegrín F., Fernández J.E., and Murillo J.M., 1997. Soil physical properties, water depletion and crop deve-lopment under traditional and conservation tillage in southern Spain. Soil Till. Res., 41(1-2), 25-42.
Mualem Y., 1976.A new model for predicting the hydraulic
con-ductivity of unsaturated porous media. Water Resour. Res., 12, 513-522.
NiedŸwiecki J. and Pecio A., 2008.Use of soil quality index for
assessment of effects of tillage at different depths. Proc. 5th Int. Soil Conf. Soil Tillage - New Perspectives, June 30-July 2, Brno, Czech Republic.
Ostrowska A., Gawliñski S., and Szczubia³ka Z., 1991. Methods
of Analysis and Etimation of Soil and Plant Properties (in Polish). Prot. Environ. Inst. IOΠPress, Warsaw, Poland.
Pabin J., Lipiec J., W³odek S., and Biskupski A., 2003.Effect of
different tillage systems and straw management on some physical properties of soil and yield of winter rye in mono-culture. Int. Agrophysics, 17, 175-181.
Pecio A. and NiedŸwiecki J., 2008. Relationship between soil
physical and chemical properties and physical quality index. Italian J. Agron. Suppl., 3, 335-336.
Pranagal J., Lipiec J., and Dom¿a³ H., 2005.Changes in pore
distribution and stability of two soils under long term tillage systems. Int. Agrophysics, 19, 165-174.
Reeves D.W., 1997.The role of soil organic matter in maintaining
soil quality continuous cropping systems. Soil Till. Res., 43, 131-167
Tisdall J.M., 1996.Formation of soil aggregates and accumulation
of soil organic matter. In: Structure and Organic Matter Sto-rage in Agricultural Soils (Eds M.R. Carter, D.A. Stewart). CRC Press, Boca Raton, FL, USA.
van Genuchten M.T., 1980.A closed-form equation for
predic-ting the hydraulic conductivity of unsaturated soils. Soil Sci. Soc. Am. J., 44, 892-898.
Watts C.W. and Dexter A.R., 1998.Soil friability: theory,
measu-rement and the effects of management and organic carbon content. Eur. J. Soil Sci., 49, 73-84.
Wereszczaka J., NiedŸwiecki J., Go³êbiewski B., and Pu¿yñski
S., 2009.The effect of 15 years of direct drilling application: