International Journal of Engineering
J o u r n a l H o m e p a g e : w w w . i j e . i rA New Mathematical Model To Optimize A Green Gas Network: A Case Study
Department of Industrial Engineering, Central Tehran Branch, Islamic Azad University, Tehran, Iran
P A P E R I N F O
Paper history:
Received 28 December 2016 Received in revised form 07 May 2017 Accepted 14 May 2017
Keywords: Green gas Network Hybrid GA/SA Algorithm Greenhouse Gas Emission Sustainable Development Electrical
A B S T R A C T
Global warming created by large scale emissions of Greenhouse Gases (GHG) are a worldwide concern. Due to this, the issue of green gas network has required more attention in the last decades. Here, we address the GHG-based problem that arises in a gas network where gas flow is transferred from the Town Board Station (TBS) to consumers by pipeline systems. Given this environment, an optimization model for a gas network in which GHG emission is expressed in term of environmental constraints is developed. Here, we formulate a gas network considering profitability and ecological goals to achieve sustainable development. To solve the model accurately, in small and medium sizes, we use GAMS 23.2 software and compare their results with the result of a metaheuristic algorithm (Hybrid GA/SA). The results show that the proposed algorithm is able to produce better answers in shorter time for large-scale problems. A case study in Mazandaran Gas Company in Iran is conducted to illustrate the validity and effectiveness of the proposed approach.
doi: 10.5829/ije.2017.30.07a.12
1. INTRODUCTION1
Regarding the development of gas industry in the recent decades, gas pipeline networks have evolved into huge and complex systems. Exploration, extraction, production, and transportation are stages which natural gas goes through to secure consumers. The network contains three phases. The transmission of gas from central production facility to City Gate Station (CGS) is called a transmission phase, while forwarding gas from CGS to Town Board Station (TBS) is called a feeding phase. Securement of gas to consumers is performed in the distribution phase, where TBS is responsible for supplying the desirable gas pressure based on consumer’s viewpoint. Due to the movement of a large volume of gas at high pressures over long distances, transmission and distribution planning are basic elements of a natural gas network. While gas pressure is reinforced by compressors in the transmission network, it is reduced by pressure reduction stations in the distribution network.
Pipelines in a natural gas network must be designed based on gas flow rate, length of pipe, gas maximum
*Corresponding Author’s Email: [email protected] (A. Mohajeri)
pressure drop allowance, and gas maximum velocity allowance. Gas companies usually apply heuristic methods which are based on human’s judgment and experience to find an optimal network. Trial and error procedures are common for such methods. But, for such methods to generate an optimal solution, one often needs an excessive computing work. Optimization methods, however, are suitable tools guaranteeing obtainment of optimal solutions with reasonable computing costs. Integration of gas network with the issue of environment protection confirms sharp decline in pollution problem. Research on this approach has received considerable attention recently and led to the creation of new research agenda: green gas chain management. So, this concept is a new paradigm the gas chain will have a direct relation to the environment. Nowadays, most research on green gas network has had a tendency to the transmission phase such as researches done by Azadeh et al. [1], Pishvaee and Razmi [2], Jamshidi et al. [3], Kashani and Molaei [4] and Subramanian et al. [5]. These studies focused on transmission of gas and only formulated models corresponding to this field. Hamedi et al. [6] presented an integrated multi-period optimization model for the distribution planning in different stages of natural gas M. Fallah, A. Mohajeri*, M. Barzegar-Mohammadi
supply chain. They formulated a mixed integer non-linear programming. Domschke et al. [7] considered networks containing pipes and various other components like compressor stations and valves with the aim to minimize the running costs of the compressor stations. Borraz-Sanchez and Haugland [8] proposed a solution method based on dynamic programming to address the fuel cost minimization problem to transport natural gas in a general class of transmission networks. Wu et al. [9] formulated a model for fuel cost minimization. The model employs a gradient search technique for the gas network. The steady state behavior of a sample gas distribution network was presented by Taherinejad et al. [10]. Mozafari and Lahroodi [11] presented an Artificial Neural Network (ANN)-based modeling technique for prediction of outlet temperature, pressure and mass flow rate of gas turbine combustor. Aryanejad and Ghavampour [12] proposed two stage multiple attribute decision making problem in Iranian Gas Distribution Systems. The purpose of their research is to present the possibility of replacing physical unit cost in transportation or distribution problems by an aggregate coefficient, getting qualitative and subjective considerations involved.
Reviewing the literature on gas network design, it is concluded that only a few research papers have considered green gas network. None of these research papers focuses on distribution phase of gas network. In this study, we extend Mohajeri et al. [13-15] model to protect the environment. In addition to managing properly gas distribution network to reduce negative impact of greenhouse gases emissions, we suggest a strategy for achieving an expected goal, simultaneously. Here, we focus on a different and important aspect of green gas network: we focus on pipelines and TBSs selection as a way to reduce emissions. For this, in addition to minimizing the total cost in the whole gas chain, we consider a regulation to reduce GHG emissions coming from gas flow. The proposed mechanism is a constraint on emissions. In this study, we pursue this scenario and develop problem formulation for it corresponding to the regulation. Overall, our main original contribution proposed in this paper is that we present the linear model based on Mohajeri et al’s model to construct an optimal green gas distribution network and propose the Hybrid GA/SA algorithm to solve the large size problems. Here, we intend to conduct a case study of the natural gas network in Mazandaran Gas Company in Iran. To our knowledge, this study is the first paper which decides on the emissions of GHG. In other words, none of the above mentioned activity considers the green gas network in which the emission of GHG is a decision variable. Moreover, none of these research papers focuses on distribution of gas between TBSs and consumers. All of these aspects are covered in this research.
The reminder of this paper is organized as follows: Section 2 represents Problem definition and mathematical model formulation. Section 3 is dedicated to solution methodology and section 4 represnts case study. Finally, section 5 signifies the conclusion.
2. PROBLEM STATEMENT
2.1. Description Here, we focus on the green
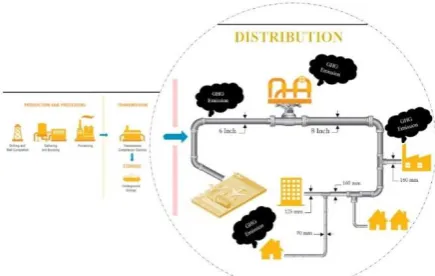
gas distribution network comprising of the pipelines having various sizes, TBSs, and consumers. The pipeline and TBS belong to the two indispensable components. The pipeline is responsible to connect the two places and to transmit a gas between them, while the TBS provides the motive force to maintain the natural gas flow through the network systems. In this study, we design a green gas distribution network with the aim of both minimizing the total cost and reducing the environmental impact in the whole chain by choosing the optimal locations of the TBSs, the flows of gases, and the pipe diameter sizes along a distribution stage when the demands of customers are given. Figure 1 shows a schematic view of the proposed green gas network.
We use IPCC [16] equations to estimate fugitive emissions as shown below:
*
, ,
E A EF
gas industry segement industry segement gas industry segement
(1)
,
E E gas industry segement
gas
industry segement
(2)
where:
Egas,industry segement
,
Annual emissions (Gg),EFgas,industry segement, Emission factor (Gg/unit of activity),
A industry segement, Activity value (units of activity).
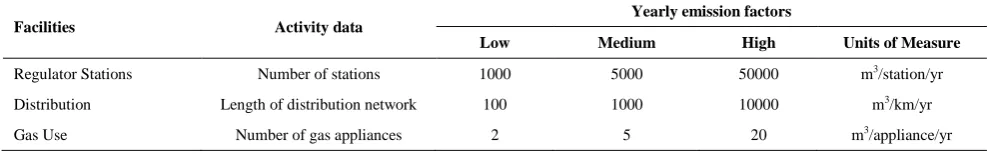
The indicative factors presented in Table 1 is used to specific classification of emission factors.
TABLE 1.classification of emission factors of natural gas
Facilities Activity data Yearly emission factors
Low Medium High Units of Measure
Regulator Stations Number of stations 1000 5000 50000 m3/station/yr
Distribution Length of distribution network 100 1000 10000 m3/km/yr
Gas Use Number of gas appliances 2 5 20 m3/appliance/yr
2. 2. Formulation Here, a mathematical programming model is proposed. To formulate a mixed integer linear programming (MILP) optimization model mathematically, the following notations are necessary: 2. 2. 1. Notation
I Set of candidate TBSs
T Set of TBS types
Z Set of consumer/demand zones
2. 2. 2. Parameters
C The cost of piping per distance unit with respect to gas flow rate
CT The average cost of piping per distance unit among the TBS
t
S Establishing cost for TBS of type t
z
q Demand of consumer zone z
it
Q Capacity of TBS i of type t
iz
d Distance between TBS i and consumer zone z
i i
d The distance between TBS i and TBS i'
' zz
d The distance between consumer zone z and consumer zone z'
M A large number.
EF1 Emission factor for pipelines
EF2 Emission factor for TBS
ME Maximum allowable Annual emissions
2. 2. 3. Variables
i
r 1, if TBS i is located
0, o.w.
it
h 1, if TBS of type is selected
0, o.w.
i t
itz
y
1,0, if consumer zone z is connected to TBS i of type to.w.z z
w 1, if there is a direct link between consumer zone z to consumerzone z' 0, o.w.
i
u 1, if TBS is a root
0, o.w.
i
i i
x 1, if there is a direct link between TBS to TBS
0, o.w.
i i
z
N Allocated number of consumers to consumer zone z
i i
f Amount of flow from TBS i to TBS i'
fzz Amount of flow from consumer zone z to consumer zone z'
z z
f Amount of gas flow from consumer zone z to consumer zone
z'
z
ew Amount of congested gas flow to be supplied to each consumer zone z
gzz
Amount of fugitive emissions from pipeline between consumer zone z to consumer zone z'
gitz
Amount of fugitive emissions from pipeline between TBS i of type t to consumer zone z
git Amount of fugitive emissions from TBS i of type t
w e itz
Amount of gas flow from TBS i of type t to consumer zone z.
2. 2. 4. Objective Function
1 2 3 4
min f f f f f (3)
where,
1 it t, i I t T
f h S
(4)
2 itz iz ,
i I t T z Z
f y d C
(5)
3 ii ii ,
i I j J
f x d CT
(6)
4 zz zz .
z Z z Z
f w d C
(7)
2. 2. 5. Constraints
, ,
i i
1 , i i I u
(9)
1
, , ,i i ii
r M r x i iI (10)
, , ,
i ii
rx i iI (11)
1
1 ,
,ii i i
i I
x u M r i I
(12)
1
1 ,
,ii i i
i I
x u M r i I
(13) , , ii i i Ix r i I
(14) , , , ii iix f i iI (15)
, , , ii ii
f x M i iI (16)
1
1 ,
,ii i i i i
i I i I
f f u M r i I
(17)
1
1 ,
,fii fi i u Mi ri i I
i I i I
(18)
, ,
it i t T
h r i I
(19), , ,
yitz hit i I t T
z Z (20) , , , itz it z Z
y h M i I t T
(21)1 , ,
zz itz
z Z i I t T
w y z Z
(22)1 , ,
z zz
z Z
N f z Z
(23)
1
, , ,z zz zz
N M w f z zZ (24)
1
, , ,z zz zz
N M w f z zZ (25)
, , ,
fzz wzzM z zZ (26)
, , ,
zz zz
f w z zZ (27)
w 1
M q ew
fzz , z z, Z,zz z z (28)
wzz1
M
qzewz
fzz, z z, Z, (29), , ,
zz zz
fw M z zZ (30)
, , ,
zz zz
f w z zZ (31)
, ,
zz z
z Z
f ew z Z
(32)
yitz1
M qzewz
ewitz , i I, t T, z Z, (33)
y 1
M
q ew
ewitz, i I, t T, z Z, itz z z (34), , , ,
itz itz
ew y M i I t T z Z (35)
, , , ,
itz itz
ew y i I t T z Z (36)
, , ,
itz it z Z
ew Q i I t T
(37)1 " , , ,
zz zz zz
g EF w d z zZ (38)
' 1 , , , ,
gitz EF yitzdiz i I t T z Z (39)
2
"it it, , ,
g EF h i I t T (40)
' '
' " ,
zz itz it
z Zz Z i It T z Z i It T
g g g ME
(41)
, , , , , , 0,1 , , , , , ,
r hi it yitz ui xiiwzz i i I t T z zZ (42)
, ', ' ', " ', , ' , 0 , , ,
, , .
Nz fii f zz f zz ewz ew itz i i I t T
z z Z
(43)
consumer receives service from one consumer or one TBS. Constraint (23) determines the allocated number of consumers to consumer zones. Constraints (24)-(27) express the flow between two consumers. Constraints (28)-(31) represent the amount of gas flow from consumer zone z to consumer zone z'. Constraint (32) indicates the amount of congested gas flow for supplying other consumers by each consumer. The amount of gas flow from TBS to consumer is shown by constraints (33)-(36). Capacity restriction is shown by constraint (37). Constraints (38)-(40) express the emission from pipelines and TBSs. Constraint (41) ensures that proposed network yearly emissions is less than Maximum allowable annual emissions. Constraint (42) imposes that the variables be binary. Non negativity of the variables is represented by constraint (43).
3. SOLUTION METHODOLOGY
Our proposed model is based on minimum spanning tree (MST) method which belongs to the NP-hard class of problem (Garey and Johnson) [17]. Because of the complexity of these problems, exact methods need excessive computation time. So, heuristic and metaheuristic algorithms are essential tools for solving such problems in reasonable amounts of time.
Here, the proposed hybrid GA/SA algorithm is presented as fallows:
1. Initialize GA parameters and SA parameters (nPop,MaxIt,Cper,Mper;T0,Alpha,MaxIt1,MaxIt2)
2. Initialize SA_Database
3. For Number of possible combinations of TBS
3.1. Initialize GA population based on MST and calculate related costs and stored in GA_Database
3.2. While Iteration< Maximum Generations
3.2.1. Apply crossover and calculate new child’s costs and stored in Cross_Database 3.2.2. Apply Mutation and calculate mutate costs
and stored in Mu_Database
3.2.3. Combines GA_Database, Cross_Database, Mu_Database and sort them according to FITNESS-FN
3.2.4. Truncated extra members END While 3.2
3.3. Choose the best solution of GA
3.4. Initialize T,T0,Alpha,MaxIt1,MaxIt2 for Simulate Annealing algorithm
3.4.1. BestSol= best solution of GA 3.4.2. While It1< MaxIt1 3.4.3. While It2< MaxIt2
3.4.4. X.Sol=Create neighbor solution of the BestSol and calculate related costs(X.Cost) If ((X.Cost< BestSol.Cost) & (Total Emission<ME))
BestSol=X Else
delta=X.Cost- BestSol.Cost; p=exp(-delta/T)
a=rand (0,1) if a<p
BestSol=X END if
END if
END While It1
3.4.5. T=T* Absorption rate END While It2
3.5. Store BestSol in SA_Database
END for Number of possible combinations of TBS (until terminating condition)
Return the Best Solution that stored in SA_Database and show related results and graphs
4. CASE STUDY
A natural gas network case study of Mazandaran Gas Company in Iran is conducted to verify the proposed model. Surveying on this case, nine potential locations for the TBS were decided. TBSs are selected to secure 119 consumers demands which is 11195 m3/h. Velocity and gas pressure were considered to be 20 m/sec and 30 psi, respectively. We applied GAMS 23.2 software package to facilitate computations in our Mixed Integer Programming (MIP) model and MATLAB R2015 software package for metaheuristic algorithm. The General Algebraic Modeling System (GAMS) is a high level modeling system for mathemathical programming and optimization and is specially designed for modeling linear, nonlinear, and mixed integer optimization problems. The system is specially useful with large and complex problems [18]. All the required information we used are as follows:
Relationships among gas flow rates and pipe diameter sizes.
The cost of piping per distance unit with respect to the gas flow rate.
Consumers’ demands.
The establishing cost and capacity of different TBSs.
Distance between the TBS and consumers, among the TBSs and among the consumers.
The validity of proposed model is measured for gas distribution network case study of Mazandaran Gas Company as summarized in Table 2. Now, the validity and effectiveness of the proposed metaheuristic algorithm in comparison to the exact method is analyzed. The results are given in Table 3. The results show that our proposed algorithm is effective for solving the problems. To find out that the algorithm obtains good solutions in reasonable times or not we generate 3 large size test problem and the results are given in Figure 2 and Table 4. In comparison to the exact method, the algorithm obtains solutions closer to the optimal solutions with much less time than the time needed to be spent for obtaining exact optimal solution.
4. 1. Parameter Tuning Parameter tuning plays
TABLE 2.Optimal Solution
Selective path Amount of gas flow Pipe (type)
5-4:[1] 5538.1 6"
5-6:[2] 1095.3 110 mm
5-7:[3] 1536.9 125 mm
5-8:[4] 3024.69 160 mm
3-2:[1] 912.4 110 mm
3-1:[2] 623 90 mm
4-3:[3] 1971.2 125 mm
4-5:[4] 1663.8 125 mm
8-9:[5] 2079 160 mm
9-10:[6] 1312.39 110 mm
10-11:[7] 817.09 110 mm
Objective: 217391366.76
Annual Emission: 10008.3 (m3/yr)
TABLE 3.Computational results
NUM. No.
of TBS
No. of Consumer
Proposed Algorithm (Hybrid GA/SA)
Exact Model
(GAMS) GAP (%)
1 1 5 1.09E+08 108500385.5 4.71E-03 0.71 sec 4.179 sec
2 1 5 1.15E+08 114572467.6 4.70E-03 0.95 sec 1.874 sec
3 2 7 1.47E+08 145523793.2 6.88E-03 1.13 sec 117.14 sec
4 2 7 1.60E+08 158309288.5 7.68E-03 1.68 sec 77.24 sec
5 3 6 1.17E+08 116935096.6 9.04E-04 2.01 sec 73.73 sec
6 3 6 1.35E+08 134250942.2 5.88E-03 1.93 sec 64.1 sec
7 4 9 1.67E+08 165620613.6 8.76E-03 2.22 sec 578.17 sec
8 4 9 1.85E+08 183824992.5 6.78E-03 2.22 sec 1472 sec
9 5 11 2.18E+08 217391385.8 2.91E-03 3.65 sec 36808.4 sec
10 5 11 2.20E+08 218733880.6 5.89E-03 3.45 sec 37778.5 sec
The levels of parameters are given as follows:
Initial population: 2 levels (40,50)
Crossover rate: 3 levels (0.2,0.3,0.4)
Mutation rate: 2 levels (0.1,0.2)
Max Generation: 2 levels (100,200)
Initial temperature: 3 levels (300,400,500)
Absorption Rate: 2 levels (0.955,0.99)
The test plans are implemented to determine a suitable level for each parameter. The test problems are given as follows:
One TBS and five consumers
Two TBS and seven consumers
Three TBS and six consumers
Four TBS and nine consumers
Each test plan is implemented for each defined test problem and the obtained results are saved using the following relation:
lg
*100
A orithm Optimal
GA P
Optimal
(44)
Figure 2. The results of large test problem (9 TBS & 39 CONS)
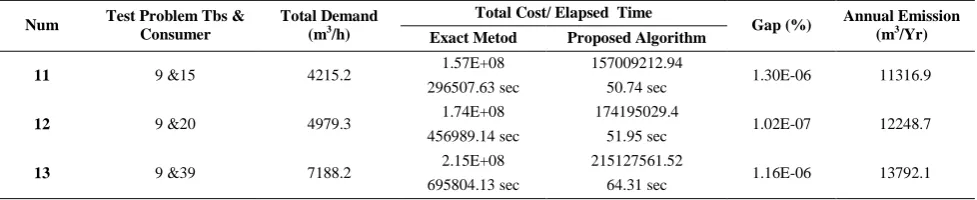
TABLE 4.The necessity of using proposed algorithm
Num Test Problem Tbs & Consumer
Total Demand (m3/h)
Total Cost/ Elapsed Time
Gap (%) Annual Emission (m3/Yr)
Exact Metod Proposed Algorithm
11 9 &15 4215.2 1.57E+08 157009212.94 1.30E-06 11316.9 296507.63 sec 50.74 sec
12 9 &20 4979.3 1.74E+08 174195029.4 1.02E-07 12248.7 456989.14 sec 51.95 sec
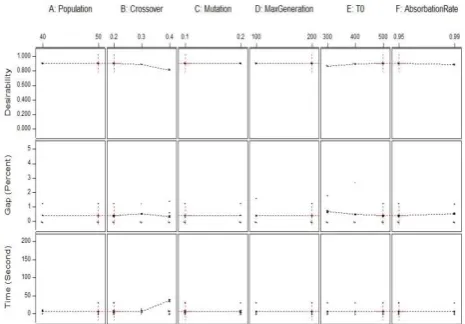
Design Expert10 software package is applied to analyze the impact of different parameters on gap value. The results are shown in Figure 3. Corresponding to the obtained results, levels 50, 0.2, 0.1, 200, 500 and 0.95 were selected for Initial population, Crossover rate, Mutation rate, Max Generation, Initial temperature and Absorption Rate, respectively.
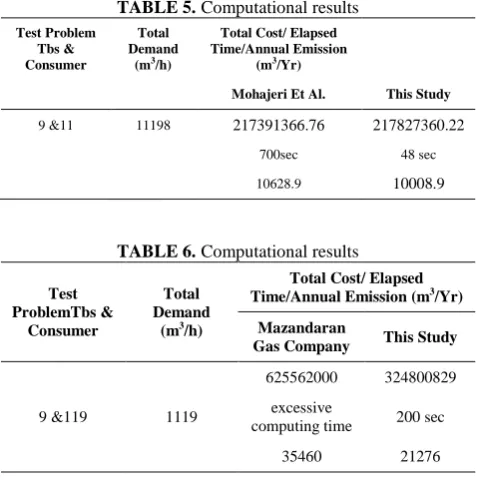
Here, we compare the results of our study with Mohajeri et al’s and Mazandaran Gas Co as we show in Figures 4 and 5.
The results of comparing this study with Mohajeri et al’s study:
The algorithm that proposed in this study is 15 times faster.
In this study Annual emissions is 6.3% less than Mohajeri et al
Total cost of this study is 0.2% more than Mohajeri et al, Due to In terms of the environmental restrictions.
Details are given in Table 5.
The results of comparing this study with Mazandaran Gas Co. study:
The algorithm that proposed in this study is extremely faster than Mazandaran Gas Co.
In this study, Annual emissions is 66% less than Mazandaran Gas Co.
Total cost of this study is 52% less than Mazandaran Gas Co.
Details are given in Table 6.
5. CONCLUSIONS
In this paper, an optimal mathematical green gas network was established based on the Mohajeri et al’s model. The model considered all factors influencing the total cost of a gas network such as pipe diameter, length of pipe, etc.
Figure 3. Impact of each parameter on mean of gap and time
Figure 4. The results of comparing this study with Mohajeri et al’s study
TABLE 5.Computational results
Test Problem Tbs & Consumer
Total Demand
(m3/h)
Total Cost/ Elapsed Time/Annual Emission
(m3/Yr)
Mohajeri Et Al. This Study
9 &11 11198 217391366.76 217827360.22
700sec 48 sec
10628.9 10008.9
TABLE 6.Computational results
Test ProblemTbs &
Consumer
Total Demand
(m3/h)
Total Cost/ Elapsed Time/Annual Emission (m3/Yr)
Mazandaran
Gas Company This Study
9 &119 1119
625562000 324800829
excessive
computing time 200 sec
35460 21276
We also considered environmental impact of our proposed gas distribution network to achieve sustainable development. For this, in addition to minimizing the total cost in the whole gas chain, we considered a regulation to reduce GHG emissions coming from gas flow. The proposed mechanism was a constraint on emissions. In this study, we pursued this scenario and developed problem formulation for it corresponding to the regulation. Overall, our main original contribution proposed in this paper was that we presented the linear model to construct an optimal green gas distribution network and proposed the Hybrid GA/SA algorithm to solve the large size problems. To our knowledge, this study is the first paper which decides on the emissions of GHG. We also used the actual data on Mazandaran Gas Company in Iran to conduct a case study. Optimal results were obtained applying GAMS 23.2 software package. Due to the inability of this software to provide solutions for large size problems in a reasonable time, the metaheuristic algorithm was proposed. As a result, with the proposed algorithm, we obtained excellent results. This will enable us to design a fast, effective and robust decision aid tool based on the suggested model.
There remain many open problems to be further investigated. We conclude this paper by discussing future research directions, which we hope will be a helpful guide to interested readers.
For future research, this problem can be presented in a multi-objective form. Because the computational time increases significantly when the size of the problem increases, developing an efficient exact or heuristic solution method is also a critical need in this area. Thus, it would be interesting to propose exact solution
methods, such as Benders’ decomposition method, to partition the structure of the model into small problems.
6. REFERENCES
1. Azadeh, A., Raoofi, Z. and Zarrin, M., "A multi-objective fuzzy linear programming model for optimization of natural gas supply chain through a greenhouse gas reduction approach", Journal of Natural Gas Science and Engineering, Vol. 26, No., (2015), 702-710.
2. Pishvaee, M.S. and Razmi, J., "Environmental supply chain network design using multi-objective fuzzy mathematical programming", Applied Mathematical Modelling, Vol. 36, No. 8, (2012), 3433-3446.
3. Jamshidi, R., Ghomi, S.F. and Karimi, B., "Multi-objective green supply chain optimization with a new hybrid memetic algorithm using the taguchi method", Scientia Iranica, Vol. 19, No. 6, (2012), 1876-1886.
4. Kashani, A.H.A. and Molaei, R., "Techno-economical and environmental optimization of natural gas network operation",
Chemical Engineering Research and Design, Vol. 92, No. 11,
(2014), 2106-2122.
5. Subramanian, R., Williams, L.L., Vaughn, T.L., Zimmerle, D., Roscioli, J.R., Herndon, S.C., Yacovitch, T.I., Floerchinger, C., Tkacik, D.S. and Mitchell, A.L., "Methane emissions from natural gas compressor stations in the transmission and storage sector: Measurements and comparisons with the epa greenhouse gas reporting program protocol", Environmental Science &
Technology, Vol. 49, No. 5, (2015), 3252-3261.
6. Hamedi, M., Farahani, R.Z., Husseini, M.M. and Esmaeilian, G.R., "A distribution planning model for natural gas supply chain: A case study", Energy Policy, Vol. 37, No. 3, (2009), 799-812.
7. Domschke, P., Kolb, O. and Lang, J., "An adaptive model switching and discretization algorithm for gas flow on networks", Procedia Computer Science, Vol. 1, No. 1, (2010), 1331-1340.
8. Borraz-Sanchez, C. and Haugland, D., "Minimizing fuel cost in gas transmission networks by dynamic programming and adaptive discretization", Computers & Industrial Engineering, Vol. 61, No. 2, (2011), 364-372.
9. Wu, S., Rios-Mercado, R.Z., Boyd, E.A. and Scott, L.R., "Model relaxations for the fuel cost minimization of steady-state gas pipeline networks", Mathematical and Computer Modelling, Vol. 31, No. 2-3, (2000), 197-220.
10. Taherinejad, M., Hosseinalipoor, S. and Madoliat, R., "Steady flow analysis and modeling of the gas distribution network using the electrical analogy (research note)", International Journal of
Engineering-Transactions B: Applications, Vol. 27, No. 8,
(2014), 1269.
11. Mozafari, A. and Lahroodi, M., "Modeling and control of gas turbine combustor with dynamic and adaptive neural networks", International Journal of Engineering-Transactions B: Applications, Vol. 21, No. 1, (2007), 71-80.
12. Aryanejad, M. and Ghavampour, S., "Two stage multiple attribute decision making problem in iranian gas distribution systems", International Journal Of Engineering Transactions A, Vol. 17, (2004), 135-144.
13. Mohajeri, A., Mahdavi, I., Mahdavi-Amiri, N. and Tafazzoli, R., "Optimization of tree-structured gas distribution network using ant colony optimization: A case study", International Journal
of Engineering Transactions A: Basics, Vol. 25, No. 2, (2012),
14. Mohajeri, A., Mahdavi, I. and Mahdavi-Amiri, N., "Optimal pipe diameter sizing in a tree-structured gas network: A case study", International Journal of Industrial and Systems
Engineering, Vol. 12, No. 3, (2012), 346-368.
15. Mahdavi, I., Arabmaghsudi, M., Taghipourian, F., Mohajeri, A., Yahyanejad, M. and Mahdavi-Amiri, N., "An optimal natural-gas network using minimum spanning tree", in Computers and Industrial Engineering (CIE), 40th International Conference on, IEEE., (2010), 1-5.
16. Eggleston, H., Buendia, L., Miwa, K., Ngara, T. and Tanabe, K., "Ipcc guidelines for national greenhouse gas inventories",
Institute for Global Environmental Strategies, Hayama, Japan,
Vol. 2, No., (2006), 48-56.
17. Garey, M.R., "Computers and intractability: A guide to the theory of np-completeness", Revista Da Escola De Enfermagem
Da USP, Vol. 44, No. 2, (1979), 340-348.
18. Rosenthal, E., "Gams-a user’s guide", in GAMS Development Corporation, Citeseer., (2008).
A New Mathematical Model To Optimize A Green Gas Network: A Case Study
Department of Industrial Engineering, Central Tehran Branch, Islamic Azad University, Tehran, Iran
P A P E R I N F O
Paper history:
Received 28 December 2016 Received in revised form 07 May 2017 Accepted 14 May 2017
Keywords: Green gas Network Hybrid GA/SA Algorithm Greenhouse Gas Emission Sustainable Development Electrical
ديكچ ه
هناخلگ یاهزاگ زا یدایز مجح طسوت هک نیمز هرک ندش مرگ رسارس رد ینارگن کی هب لیدبت ،تسا هدش داجیا هدش رشتنم یا
ههد رد یرتشیب هجوت هب زاین زبس یناسرزاگ هکبش هلاسم ،تلع نیمه هب .تسا هدش ناهج نیا رد .تسا هدرک ادیپ ریخا یاه
هناخلگ یاهزاگ راشتنا هلاسم لح شهوژپ یا
یم یشان زاگ هکبش زا هک تحت زاگ هکبش رد .تسا هتفرگ رارق یسررب دروم دوش
یم لقتنم هلول طوطخ متسیس طسوت نایرتشم هب هیوناث راشف لیلقت هاگتسیا زا زاگ نایرج یسررب ،طیحم نیا هب هجوت اب .ددرگ
هنیهب لدم کی هناخلگ یاهزاگ راشتنا نآ رد هک ،زاگ هکبش یارب یزاس
ناونعب یا رارقرظن دم یطیحم تسیز تیدودحم کی
هب ندیسر یارب یتسیز طیحم و یروآدوس فادها اب زبس یناسرزاگ هکبش کی شهوژپ نیا رد .تسا هدش هداد هعسوت ،هتفرگ مرن زا ،طسوتم و کچوک داعبا رد لااب تقد اب لدم لح تهج .تسا هدش هلومرف رادیاپ هعسوت رازفا
GAMS 23.2
هدافتسا
یم دیربت یزاس هیبش و کیتنژ متیروگلا زا یبیکرت هک یداهنشیپ یراکتباارف متیروگلا اب نآ جیاتن و هدرک .تسا هدش هسیاقم ،دشاب
یم ناشن جیاتن باوج هئارا هب رداق یداهنشیپ متیروگلا هک دهد
یم گرزب داعبا اب لئاسم یارب رتعیرس و رتهب یاه هعلاطم .دشاب
تکرش یدروم تسا هدش ماجنا یداهنشیپ شور یشخبرثا و رابتعا نداد ناشن تهج ناریا رد ناردنزام ناتسا زاگ
.