Please cite this article as: I. Snigdh, N. Gupta, Quasi Random Deployment Strategy for Reliable Communication Backbones in Wireless Sensor Networks, International Journal of Engineering (IJE), TRANSACTIONS A: Basics Vol. 28, No. 10, (October 2015) 1430-1438
International Journal of Engineering
J o u r n a l H o m e p a g e : w w w . i j e . i rQuasi Random Deployment Strategy for Reliable Communication Backbones in
Wireless Sensor Networks
I. Snigdha, N. Gupta*b
a Department of Computer Science and Engineering, BIT Mesra ,India b Department of Electronics and Communication Engineering, BIT Mesra, India
P A P E R I N F O
Paper history:
Received 11 November 2014
Received in revised form 21 September 2015 Accepted 16 October 2015
Keywords:
Wireless Sensor Network Minimum Spanning Tree Quasi-random Sequences Reliability
Backbone Networks ANOVA
A B S T R A C T
Topology construction and topology maintenance are significant sub-problems of topology control. Spanning tree based algorithms for topology control are basically transmission range based type construction algorithms. The construction of an effective backbone, however, is indirectly related to the placement of nodes. Also, the dependence of network reliability on the communication path undertaken by the message, subject to the place of event, remains unattended. To address this problem, we employ communication backbones (Prim’s algorithm and breadth first search (BFS)) and compute reliability based on the availability of paths for consistent message delivery from the place of event to the sink location in event driven wireless sensor networks. Our article analyses the communication reliability of a wireless sensor network in context to a topology governed by random and deterministic deployment methods. To comprehend the effect of topology on the communication reliability of a wireless network; “the within communication radii” constraint is satisfied. ANOVA is performed to validate the effect of node placement schemes on the reliability subject to varying radio ranges. It is observed that a ‘quasi’ random placement of nodes increases the communication reliability of the existing algorithms employed for analysis.
doi: 10.5829/idosi.ije.2015.28.10a.05
1. INTRODUCTION1
Wireless nodes measure some physical quantities in their vicinity and transmit the information (in single or multiple hops) to the base station [1]. Hence, if the base station receives the intended information, the communication is a ‘success’, else termed a ‘failure’. The viewpoint is that if there is a requirement for fault tolerance, then there is also a requirement for the network to maintain continuity of service in the presence of network failures. This continuity can be maintained if there are ample nodes within the communication area of the nodes in the route. In contrast to the routing algorithms employed for wireless networks that update the route in case of node failure, the sensor network is constrained by the limited communication range for inter node updation. Hence, route updation becomes possible only when there is an
*Corresponding Author’s Email: [email protected] (I. Snigdh)
the optimal rate-reliability lifetime tradeoff [8]. Others discuss and evaluate the reliability of backbone-assisted routing and dissemination in WSNs on the basis of gateway to node ratio [9]. Reliability and availability improvement has been suggested though fault aware routing algorithms for different networks and by design of K-out-of-N systems [10, 11].
From the existing literatures we can infer that the characteristics of large scale reliability are regularity and predictability in structure and communication and inherent data redundancy. The regularity in node availability is accentuated by adopting the proposed quasi based deployment pattern. The proposed deployment is based on quasi random number generator (QRNGs). QRNGs produce highly uniform samples of the unit hypercube. QRNGs minimize the discrepancy between the distribution of generated points and a distribution with equal proportions of points in each sub-cube of a uniform partition of the hypercube. We
intend to analyze the improvement in the
communication reliability with respect to the existing corresponding deterministic and random deployment methods [12, 13].
Our proposed strategy analyzes the effect of energy conservation for achievable communication reliability metrics. We try to observe the packet loss and packet delivery ratios in context to the deployment methods that govern the effective node placement. For this, we essentially consider an event driven sensor network for our analysis, as the real time constraints for accurate data delivery and effective response time are critical in such scenarios. We also emphasize that reliable communication infrastructure becomes mandatory for such type of systems [14, 15].
The article has been organized in Section 2 that discusses the system model outlining the adopted topology and the assumptions made. The reliability definitions and the formulae used are discussed in Section 2 followed by rigorous simulations and their results in Section 3. Section 4 presents the conclusions.
2. SYSTEM MODEL
An ad-hoc network is usually infrastructure-less where the ‘source’ node of a ‘course’ should traverse several intermediate nodes to reach a ‘destination’ node. This classification is subject to the criteria whether the coordinator node changes (due to the route changes, due to topology change or as per the protocol involved) or whether the backbone architecture is fixed for a single coordinator and does not include loops in the communication route. In either condition, the communication path used follows a hierarchical organization for one single message delivery or ‘n’ deliveries consistently to the sink.
This motivates our choice of using an event driven, tree based communication structure to evaluate reliability.
Reliability is ensured with at least one existing route from the leaf to the root node. The network fails whenever at least m routes fails, where ‘m’ is a subset of distinct forwarding links from sensors (sensing an event) to the base station. The effect on reliability is observed under the following set of constraints:
Different sink positions - this variation leads to generation of distinct backbones subject to the placement of sink initiating the backbone formation.
Different sensing range - this variation creates different connection links between nodes essential for defining the parent child association.
Different tree traversals (namely BFS and MST (Prim’s) - in order to analyze the variable routes available to the sink.
2. 1. Network Organization
Casez 1: The initial backbone construction generates an MST based tree considering the depth of a tree hierarchy and the number of nodes connected by the hierarchy. The tree backbone is static and does not employ redundant nodes and redeployment is not possible.
Case 2: An initial backbone is constructed on the basis of a BFS. BFS is further used to compute the route on the incidence of an event. Hence with this strategy we try to bring about the dynamics in the communication backbone and improve the reliability of the existing communication structure.
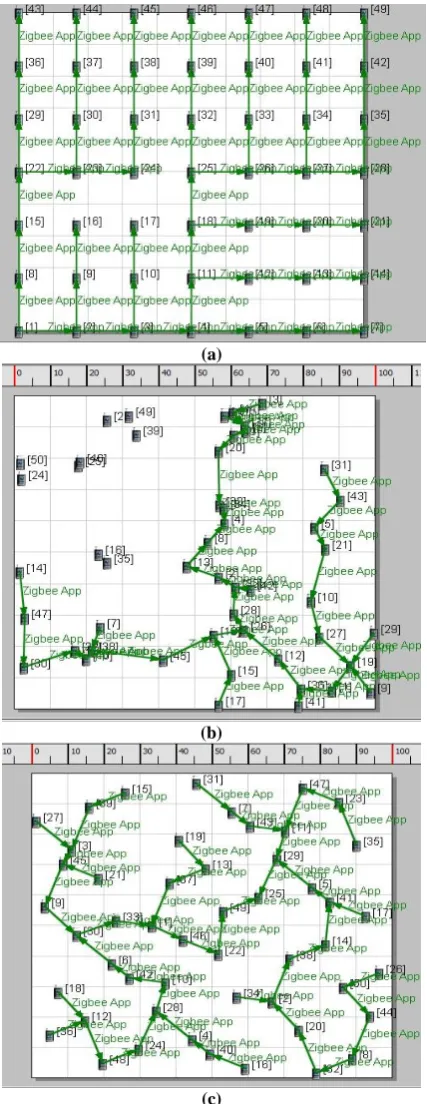
The Figures 1(a), 1(b) and 1(c) depict the minimum spanning tree backbones constructed. As we can see, the number of connections in a deterministic deployment is strictly uniform which cannot be practically achieved in natural environments monitored. On the other hand random deployments are highly irregular with unconnected nodes while in case of quasi random deployment the uniformity is maintained yet it is randomly arranged.
We analyze these arrangements in Figures 1 (a), 1(b) and 1(c) for computing reliability of routes and successful message deliveries. The simulations are performed in qualnet simulator using zigbee applications for wireless sensor networks [16].
2. 2. Assumptions
1. Reliability of the node is same for leaf and parent node and is proportional to the number of transmissions and receptions.
2. Spares are available for sensor leaf nodes and parent nodes.
3. More than one node can detect an event.
dead, so they do not participate in sensing or forwarding.
These failures can be directly associated with the nodes they affect.
(a)
(b)
(c)
Figure 1. (a) Deterministic deployment (b) Random
deployment (c) Quasi random deployment
The paths used for forwarding the sensed data depends on the sensors detecting the event, their hop distance and the selectivity of nodes for transmitting on the basis of availability of the communication links.
2. 3. Reliability Computations Let an event be detected by ‘n’ nodes at different levels of a tree (of ‘k’ levels). The communication reliability of an event is dependent on the reliability of the node in terms of activeness of the node that is proportional to the residual energy of the nodes, the reliability of the link that is determined by the commutative probability of the activeness of the leaf parent consecutive pair along with the link stability as given in Equation (3). For simplicity, we assume that the route failure due to link disruption because of environmental conditions is a constant ‘d’ and hence the link and route reliability converge.
Reliability of the node (NR) = probability of activeness of the node = remaining energy of the node/ initial energy of the node. Since the activeness of a node ‘i’ does not depend on the activeness of node ‘j’ the probability is computed as independent events.
Communication probability of events (CR) = Probability of sending of data from the sensed sensor to the base station.
CR = P (AK)*P (AK-1 / AK) * P (AK-2/AK-1)* . . .
*P (A1/A2)
(1)
If P(AK) is the probability that the node is active the
probability that the message reaches the base station successfully can be reframed in terms of the reliability of the nodes (inclusive of both child and parents) and the reliability of the link. The first term of equation (2) is the probability that both the parent and child have failed which renders the link useless. The second term is the probability that message delivery is successful due to either the parent or other nodes detecting the event redundantly and simultaneously.
If fc is the failure of the child node, fp is the failure
of the parent and fl is the failure of the connecting link,
for a single event detection scenario, the probability that the message reaches the sink is given by
P(AK/AK-1)=
1
1 1
1 1
( )
n n i
c p l c p l
i
i j
f f f f f f
(2)where, P(Ak) is the probability of the activeness of the
node at level ‘k’ and P(Ak-1/Ak) is the conditional
probability of activeness of node at level (k-1) subject to the condition that node at the Kth level is active. ‘n’ is the total number of nodes that detect an event and are candidates of distinct routes from the source of event to the sink. Also the link reliability (fl) between the parent
) 10 log( 2 log 10 1 2 1 ) ( r Link t r erf r
P (3)
where, ; 1.
r
r n t
Here, ‘r’ is the link length between two nodes and ‘tr‘ is
the transmitting range. The other parameters are standard deviation of shadowing and path loss exponent. At layer ‘k’, if AK is a parent of more than one nodes
(say ‘m’) ‘k+1’th layer nodes then
) ( ... ) ( ) ( ( )
(Ak P P A(k 1)1 P A(k 1)2 P A(k 1)m
P (4)
3. RESULTS
The results are analyzed for different communication ranges for different sink positions for 5000 events sampled over 500 events. The deployment that we consider is deterministic, random and our proposed approach quasi random. The quasi random sequence used for the simulation is the Halton sequence. The graphs given below illustrate the communication reliability and the node reliability averaged, for a set of five different sink positions encountering 5000 events. Each event generated is random and its detection by ‘n’ nodes follows a poisons distribution formula. Each event triggers at least one of the sensors that initiate the message communication. The event coordinates remain constant for the entire length of the simulation irrespective of the variable ranges and the sink positions. The algorithm follows the steps:
Step 1: Establish topology using either the BFS based or prim’s MST for the different deployment types as already mentioned in Section 2.
Step 2: The reliability is cumulatively computed using equation 1, 2 and 3 for ‘x’ random events until the first node in a route fails.
Step 3: If the child node to the failing node has a forwarding path it chooses the alternate route till there are no more forwarding parents in its neighbors set and the message cannot reach the sink, hence is termed as ‘failure’.
3. 1. Analyzing Effect of Node placement on Reliability The transmission range of nodes determine the length of one hop, hence transmission range also alters the number of hops. With increase in the hop count the total number of transmissions and receptions en route to the destination increases. This further increases the energy consumption and hence the degree of activeness of the nodes. The variance analysis (ANOVA) is done for the same scenario for different
communication ranges. The idea behind performing a variance analysis is to see the effect of varying deployments and radio range on the reliability of the network. We try to infer whether a ‘quasi’ based deployment strategy can produce significant changes in the overall reliability of the communication path as well as the individual node reliability. We test our strategy for the given hypothesis
H0= the range and deployment pattern of the nodes
have no effect on the communication reliability, the individual node activeness and the total number of transmissions and receptions.
H1= there is significant impact of the range and
deployment strategy on the individual node activeness and the total number of transmissions and receptions.
The effect of range on the deployment type for estimating the number of transmissions and receptions is given by Table 1. It is observed that at 95% confidence the sample distributions are significantly different for both factors; Range and Deployment type. The F-ratio indicates clearly that there is significant dependence of the range and node placement strategy on the overall reliability of the network thus invalidating the null hypothesis H0. Hence, we can state the alternate
hypothesis to true that states that there is significant effect of the range and placement strategy owing to the deployment pattern employed.
On analysis of the level of interaction between the two factors namely the radio range and the placement of nodes, we see that the number of transmissions and receptions are significantly different for all the deployments as obvious. Also, the quasi deterministic and the random deterministic transmissions and receptions are significantly different. Moreover, the number of transmissions and receptions of quasi and random are almost similar and are not affected by the transmission range as shown in Table 2.
The column ‘Sig’ takes two values either 1 or 0. The value ‘1’ indicates that the samples are distinctively different. We invalidate the null hypothesis that claims that the range and deployment have no effect on the reliability of the communication path and the individual node reliability. Further, the ‘sig’ column in Table 3 takes a value 0 in case of quasi random deployments for the two ranges. This proves that quasi is more similar to the random placement and is not affected significantly by the change in the radio range of the individual nodes.
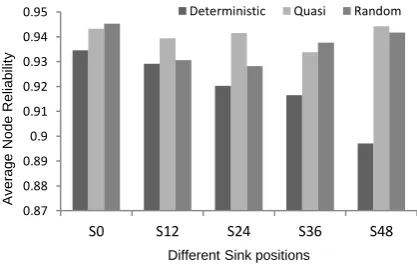
the possibilities of uniformity in energy depletion. The Figures 2 (a), 2 (b), 3 (a) and 3 (b) depict the average node reliability of 50 nodes at the end of 5000 events
for different sink positions employing an MST backbones using Prim’s and BFS algorithms.
TABLE 1.ANOVA Results: Dependence of deployment and range over reliability
stateraraP DF Sum of Squares Mean Square F Value P Value
Range 1 2.13277E6 2.13277E6 76.72875 6.10963E-9 Deployment type 2 993041.83099 496520.91549 17.86287 1.77254E-5 Interaction 2 11396.45962 5698.22981 0.205 0.81606 Model 5 3.13721E6 627442.12807 22.5729 2.35259E-8
Error 24 667110.26936 27796.26122 -- --
Corrected Total 29 3.80432E6 -- -- --
TABLE 2. Analyzing reliability over different communication radii
etnar Mean Diff SEM q Value Prob Alpha Sig LCL UCL
R=30: R=20 533.26321 60.87831 12.3878 7.33127E-8 0.05 1 407.6159 658.91051
TABLE 3. Analyzing reliability over different deployment schemes
drhtemernamerapeD Mean Diff SEM q Value Prob Alpha Sig LCL UCL
Quasi Deterministic -422.17424 74.5603 8.00753 2.27061E-5 0.05 1 -608.37286 -235.97561 Random Deterministic -334.71139 74.5603 6.34859 4.32348E-4 0.05 1 -520.91002 -148.51277 Random Quasi 87.46284 74.5603 1.65894 0.4802 0.05 0 -98.73578 273.66147
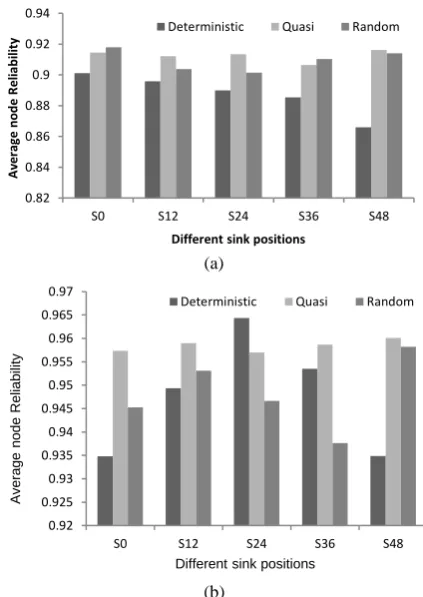
Here, we see that the node energy depletion in quasi deployment is more uniform and very less as compared to both deterministic and random based communication structures. There is a slight decrease in the node reliabilities when we increase the communication radii in case of quasi based structure. This decrement is due to the fact that many nodes are able to connect to each other and results in increased communication between nodes.
(a)
(b)
Figure 2. Average node reliability for range: 20m, different
sink positions (a) MST (Prim’s based) (b) MST (BFS based)
3. 3. Communication Reliability Figures 4 (a) and 4 (b) depict the communication reliability aggregated for 5000 events when the sink positions change, keeping the place of events constant. From these figures we can see that the performance of the quasi based communication backbone is better, on an average, than the deterministic and random deployments, and their corresponding tree structures under similar simulation conditions.
0.87 0.88 0.89 0.9 0.91 0.92 0.93 0.94 0.95
S0 S12 S24 S36 S48
A
ve
ra
g
e
Nod
e
Reliab
ility
Different Sink positions
Deterministic Quasi Random
0.82 0.84 0.86 0.88 0.9 0.92 0.94 0.96
S0 S12 S24 S36 S48
A
verag
e
n
o
d
e
rel
ia
b
ili
ty
Different sink positions
(a)
(b)
Figure 3. Average node Reliability for range: 30m for
different sink positions (a) MST (Prim’s based) (b) MST (BFS based)
Figure 4 (a) shows the performance on the quasi based communication backbone based on a minimum spanning tree. The total Communication reliability for a quasi based arrangement is 85 to 100 %, whereas at the end of 4999 events both random and deterministic deployment based MST’s have a sharp decrease and fall below 50%. This is so because the deterministic pattern forces a strongly organized structure and the edges are nearly equal. Hence depletion is faster due to longer transmission distances.
On the other hand the random deployment structure many nodes do not form a part of the backbone as they do not fall in the vicinity of the communication radius of the neighboring nodes. Hence the availability of routes is limited. Also due to the highly random placement of the nodes, the depletion of the nodes is non-uniform. Since the parent nodes in this case experience more load, they tend to deplete energy faster. As specified in the above equations the aggregate communication reliability is dependent on the individual node activeness, which is directly related to their residual energy, the communication reliability decreases manifold.
This reliability improves as shown in 4(b), in case of random and quasi random deployments using a BFS
based mechanism due to the availability of redundant routes.
Figures 5 (a) and 5(b) depict the communication reliability of the established backbones averaged over the entire 5000 events for different sink positions. Here, the reliability of the quasi based topology structure lies between the statistics collected for random and deterministic topologies. This is so because at the end of 5000 iterations the reliability is more dependent on the place of occurrence of the 5000th event than the cumulative energy depletion. This reliability is seen to drastically improve and stabilize in Figure 5 (b) where the communication backbone is based on BFS.
Since we observe that in case of the backbone constructed for a random deployment, there are a number of nodes that fail to connect to the network. This disallows us to monitor the actual performance of the network under similar conditions. Thereby, we increased the communication range of the nodes for all the three types of deployments from 20 to 30m. At a range of 30 m more number of nodes get connected to the communication backbone for random based structures. The following graphs depict the performance analysis for range 30.
(a)
(b)
Figure 4. Communication Reliability for range: 20m, fixed
sink position, different number of events (a) MST (Prim’s based) (b) MST (BFS based)
0.82 0.84 0.86 0.88 0.9 0.92 0.94
S0 S12 S24 S36 S48
Av
e
ra
ge
no
de
R
e
lia
bi
lity
Different sink positions
Deterministic Quasi Random
0.92 0.925 0.93 0.935 0.94 0.945 0.95 0.955 0.96 0.965 0.97
S0 S12 S24 S36 S48
A
ve
ra
g
e
n
o
d
e
Reliab
ility
Different sink positions
Deterministic Quasi Random
0 0.2 0.4 0.6 0.8 1 1.2
499 999 1499 1999 2499 2999 3499 3999 4499 4999
Com
m
u
n
icat
ion
Reliab
ility
Different number of events
Deterministic Random Quasi
0 0.2 0.4 0.6 0.8 1 1.2
499 999 1499 1999 2499 2999 3499 3999 4499 4999
Com
m
u
n
icat
ion
r
e
lia
b
ility
Different number of events
(a)
(b)
Figure 5. Communication Reliability for different sink
positions, range: 20m (a) MST (Prim’s) (b) MST (BFS based)
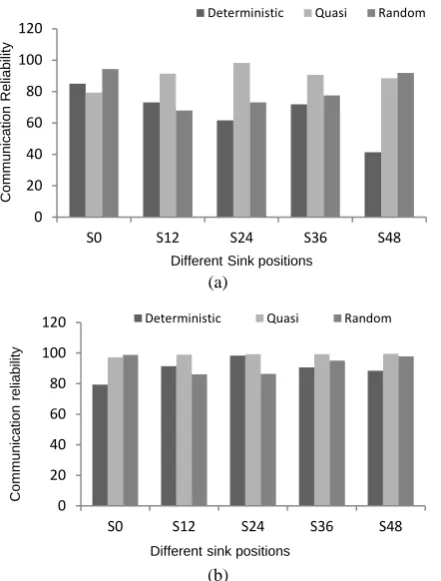
On observing the graphs 6 (a) and 6 (b), we see that the average communication reliability becomes better for random structures but still lags far behind the performance of a quasi based backbone structure. The BFS based backbone achieves nearly 99% reliability for all the sink positions and needs no further improvement. Figures 7 (a) and 7 (b) show the corresponding communication reliabilities averaged at the 5000th event.
(a)
(b)
Figure 6. Communication Reliability for different sink
positions, range: 30m (a) MST (Prim’s) (b) MST (BFS based)
We see that there is not much change in the values when considering an MST based communication mechanism. The performance of quasi random deployment based backbone depicted is however, remarkably better with respect to random deployments.
(a)
(b)
Figure 7. Average Communication Reliability, different sink
positions, consecutive 5000 events, range: 20m (a) MST (Prim’s) (b) MST (BFS based)
0 20 40 60 80 100 120
S0 S12 S24 S36 S48
Com
m
u
n
icat
ion
Reliab
ility
Different Sink positions
Deterministic Quasi Random
0 20 40 60 80 100 120
S0 S12 S24 S36 S48
Com
m
u
n
icat
ion
r
e
lia
b
ility
Different sink positions
Deterministic Quasi Random
0 20 40 60 80 100 120
S0 S12 S24 S36 S48
Com
m
u
n
icat
ion
Reliab
ility
Different sink positions
Deterministic Quasi Random
75 80 85 90 95 100 105
S0 S12 S24 S36 S48
Com
m
u
n
icat
ion
Reliab
ility
Different sink positions
Deterministic Quasi Random
0 0.2 0.4 0.6 0.8 1 1.2
S0 S12 S24 S36 S48
A
ve
ra
g
e
Com
m
u
n
icat
ion
r
e
lia
b
ility
Different sink positions
Deterministic Quasi Random
0 0.2 0.4 0.6 0.8 1 1.2
S0 S12 S24 S36 S48
A
ve
ra
g
e
Com
m
u
n
icat
ion
r
e
lia
b
ility
Different sink positions
4. CONCLUDING REMARKS
The results depict that the number of events that were successfully transmitted to the sink is 4941 for random deployments. This is comparatively less than 5000 successful event deliveries in case of the corresponding quasi and deterministic deployment based topologies. For larger simulation times, the disparity eventually would increase. We can now infer that the structure of the backbone does affect the reliability of the network as a whole. If the sinks are placed at the positions generated by a quasi-random sequence the performance in terms of network reliability increases. We see that the quasi based deployment approach achieves more than 95% reliability in all the analyzed cases irrespective of the changing backbone structures. Since the quasi based deployment generates the same set of points in a defined dimension, the increase in node density does not affect the original points in a dimension. Unlike random deployments that exhibit erratic patterns in deployments, quasi always generates the same points which are uniform. Hence the reliability remains unaltered. The node reliability and communication reliabilities of the messages under different network conditions due to the varying the sink positions or varying sensing ranges confirm the robustness of the backbone structure. Hence, a quasi-based deployment strategy can be adopted in applications that essentially require random placement and a fixed structure. Analyzing the impact of quasi random deployment topology for other advanced networks can be exploited in future.
5. REFERENCES
1. Lewis, F.L., "Wireless sensor networks", Smart Environments:
Technologies, Protocols, and Applications, (2004), 11-46.
2. Dulman, S., Rossi, M., Havinga, P. and Zorzi, M., "On the hop count statistics for randomly deployed wireless sensor networks", International Journal of Sensor Networks, Vol. 1, No. 1-2, (2006), 89-102.
3. Wategaonkar, D.N. and Deshpande, V.S., "Characterization of reliability in wsn", in Information and Communication Technologies (WICT), World Congress on, IEEE., (2012), 970-975.
4. Pouyan, A. and Tabari, M.Y., "Estimating reliability in mobile ad-hoc networks based on monte carlo simulation (technical
note)", International Journal of Engineering-Transactions B: Applications, Vol. 27, No. 5, (2014), 739.
5. Bhardwaj, D., Jain, S. and Singh, M.P., "Estimation of network reliability for a fully connected network with unreliable nodes and unreliable edges using neuro optimization", International
Journal of Engineering-Transactions A: Basics, Vol. 22, No.
4, (2009), 317.
6. Esseghir, M. and Perros, H., "Optimizing the wireless sensor network lifetime under reliability constraint", in Wireless Days,. WD'08. 1st IFIP, IEEE., (2008), 1-5.
7. Xu, W., Shi, Q., Wei, X. and Wang, Y., "Distributed optimal rate-reliability-lifetime tradeoff in wireless sensor networks",
arXiv preprint arXiv:1303.3624, ., (2013).
8. Tufail, A., Khayam, S.A., Ali, A., Baig, W.A., Anwar, F.M., Kim, K.-H. and Yoo, S.-W., "On the reliability of backbone-assisted end-to-end transmissions in wsns", in Ubiquitous and Future Networks,. ICUFN. First International Conference on, IEEE., (2009), 22-27.
9. Valinataj, M., "Reliability and performance evaluation of fault-aware routing methods for network-on-chip architectures (research note)", International Journal of
Engineering-Transactions A: Basics, Vol. 27, No. 4, (2013), 509-518.
10. Balister, P. and Kumar, S., "Random vs. Deterministic deployment of sensors in the presence of failures and placement errors", in INFOCOM, IEEE., (2009), 2896-2900.
11. Mishra, A. and Jain, M., "Availability of k-out-of-n: F secondary subsystem with general repair time distribution", International
Journal of Engineering-Transactions A: Basics, Vol. 26, No.
7, (2013), 743-752.
12. Wu, L., Yi, L., Xue-qin, G. and Deng-hai, W., "Monte-carlo simulation for the reliability analysis of multi-status network system based on breadth first search", in Information and Computing Science,. ICIC'09. Second International Conference on, IEEE. Vol. 3, (2009), 280-283.
13. Taghizadeh, S. and Mohammadi, S., "Lebrp-a lightweight and energy balancing routing protocol for energy-constrained wireless ad hoc networks", International Journal of Engineering-Transactions A: Basics, Vol. 27, No. 1, (2013), 33-45.
14. Chakrabarty, K., Iyengar, S.S., Qi, H. and Cho, E., "Grid coverage for surveillance and target location in distributed sensor networks", Computers, IEEE Transactions on, Vol. 51, No. 12, (2002), 1448-1453.
15. Zonouz, A.E., Xing, L., Vokkarane, V.M. and Sun, Y., "Application communication reliability of wireless sensor networks supporting k-coverage", in Distributed Computing in Sensor Systems (DCOSS), IEEE International Conference on, IEEE., (2013), 430-435.
16. Simulator, Q.N., "Scalable network technologies", Inc.[Online].
Available: www. qualnet. com, , (2011).
Quasi Random Deployment Strategy for Reliable Communication Backbones in
Wireless Sensor Networks
I. Snigdha, N. Guptab
a Department of Computer Science and Engineering, BIT Mesra, India b Department of Electronics and Communication Engineering, BIT Mesra, India
P A P E R I N F O
Paper history:
Received 11 November 2014
Received in revised form 21 September 2015 Accepted 16 October 2015
Keywords:
Wireless Sensor Network Minimum Spanning Tree Quasi-Random Sequences Reliability
Backbone Networks ANOVA
ديكچ ه
یژولوپوت لرتنک هجوت لباق تلاکشم ریز یژولوپوت یرادهگن و ریمعت و تخاس متیروگلا .دنتسه
رب ینتبم یشخرچ یاه
هرتسگ زاس و تخاس یاه متیروگلا ساسا رب ًلاوصا یژولوپوت لرتنک یارب تخرد تخاس ،هتبلا .دنتسه لاقتنا ی
نوتس
هرگ رارقتسا هب میقتسم ریغ روط هب رثوم یزکرم ریسم هب هکبش نانیمطا تیلباق یگتسباو هب ،نینچمه .تسا طبترم اه
هرباخم یمن هجوت دادیور لحم هب هجوت اب مایپ ی و میرپ متیروگلا( تاطابترا یزکرم نوتس زا ام ،لکشم نیا لح یارب .دوش
راب نیلوا یارب وجتسج تعسو (BFS)
سا ) لیوحت یارب ریسم ندوب سرتسد رد ساسا رب ار نانیمطا تیلباق و هدرک هدافت
هکبش رد لحم هب دادیور لحم زا راگزاس مایپ یم هبساحم میس یب رگسح یاه
نانیمطا تیلباق ام ،هلاقم نیا رد .مینک
هکبش زا ار تاطابترا ا یاه شور اب هدش هرادا یژولوپوت کی هب هنیمز رد میس یب رگسح یاه
یعطق و یفداصت رارقتس
یم هبساحم ؛میس یب هکبش کی زا تاطابترا نانیمطا تیلباق یور رب یژولوپوت رثا کرد یارب .مینک "
عاعش لخاد رد یاه
تاطابترا " یم ءاضرا تیدودحم شور رثا یجنسرابتعا یارب تسا .مینک
_ هرگ رارقتسا یاه اهریغتم یارب نانیمطا تیلباق رب اه
هدودحم رد یویدار ی لیلحت زا ی ANOVA
یم هدافتسا هرگ یفداصت هبش رارقتسا هک تسا هدش هدهاشم .مینک تیلباق اه
یم شیازفا ار تاطابترا لیلحت راک یارب دوجوم یاه متیروگلا نانیمطا .دهد