Please cite this article as: M. Rezaye Abbasi Charkhi, M. Aminnayeri, A. Amiri, Process Capability Index for Logistic Regression Profile Based onSpmk Index, International Journal of Engineering (IJE), TRANSACTIONS B: Applications Vol. 28, No. 8, (August 2015) 1186-1192
International Journal of Engineering
J o u r n a l H o m e p a g e : w w w . i j e . i r
Process Capability Index for Logistic Regression Profile Based on
S
pmkIndex
M. Rezaye Abbasi Charkhia, M. Aminnayeri*a, A. Amirib
aIndustrial Engineering Department, Faculty of Engineering, Amirkabir University of Technology Tehran Polytechnic, Tehran, Iran bIndustrial Engineering Department, Faculty of Engineering, Shahed University, Tehran, Iran
P A P E R I N F O
Paper history:
Received 27April 2015
Received in revised form 29 June 2015 Accepted 30 July2015
Keywords: Profile Monitoring Logistic Profile Processes Capability Index
A B S T R A C T
A profile is a relationship between a response variable and one or more independent variables that can describe the quality of a process or product. On the other hand, for an in-control process, capability indices are criteria for process quality improvement that allows meeting customer expectations. Although a considerable number of applications and monitoring methods have been already proposed for profiles, a few researches have focused on the process capability index of profiles. In this paper, we propose a new Spmk index to measure process capability when the quality of process is characterized by
a logistic regression profile. In addition, we present an approximate (1-)100% confidence interval based on percentile bootstrap method. The performance of the proposed index and corresponding confidence interval is evaluated through simulation studies. The result shows that when the number of observations in each level increases the index performs better. Furthermore, increasing number of levels leads to improving precision of the proposed index. Also, the coverage rates of the confidence intervals are greater than 93.6% lower limit of the stated nominal in most cases. Finally, the application of the proposed index is illustrated through a real case.
doi: 10.5829/idosi.ije.2015.28.08b.11
1. INTRODUCTION1
In statistical process control (SPC), control charts are recognized as powerful tools to monitor the quality of process or product with one or more quality characteristics. Sometimes, process quality is characterized better via the relationship between a response variable and one or more explanatory variables. This relation is known as profiles [1]. Since there are different types of profiles in the literature, selecting the appropriate model among them is very significant [2]. The model should not only be simple but also describe the profile data as well. Furthermore, for each model a monitoring method must be designed which could effectively detect changes and be proper for interpretation of out-of-control warning. A review of the existing literature reveals that profiles could be classified into categories such as simple linear, multiple
1
*Corresponding Author’s Email: [email protected] (M. Aminnayeri)
linear, polynomial, multivariate, logistic, non-linear, spline, wave-shaped and non-parametric profiles. Several studies have been done for profile monitoring by many researchers (see Mestek et al. [3], Stover and Brill [4], Kang and Albin [1], Kim et al. [5], Mahmoud et al. [6], Zou et al. [7], Croakin and Varner [8], Wang and Tsung [9], Gupta et al. [10], Kermanpour et al. [11], Niaki et al. [12], Abdella et al. [13]). A comprehensive review on this topic could be found in Noorosana et al. [14].
mentioned, there has been no research on evaluating the process capability in profiles up to the year 2007. The first attempt at presenting the PCI of simple linear profile was done by Shahriari and Sarafian [16]. Their method could distinguish efficient and inefficient response variables at different levels of the independent variable. Determining the capability of simple linear profiles was attempted by Razavi et al. [17]. Hosseinifard and Abbasi [18] proposed a method to estimate the PCI of linear profiles based on nonconforming items. These authors [19] also estimated the process capability index of linear profiles under non-normal conditions by using gamma distribution as well as Burr distribution. They proposed five methods of estimating PCI of non-normal linear profiles where the three proposed methods need an estimation of a cumulative distribution function of the process. A Burr XII distribution was used to estimate the cumulative distribution function. Since the PCIs calculated by estimating cumulative distribution functions are inconsistent with the true value, the artificial neural networks are applied for specifying PCI of non-normal linear profiles. Ebadi and Shahriari [20] introduced a method to estimate PCI of linear profiles. Three methods for measuring PCI of multivariate linear profiles were introduced by Ebadi and Amiri [21]. These three methods are based on three different approaches. The first method is based on the average percentage of nonconforming items. The second one is based on introducing a multivariate capability vector that separates the process dispersion and its centrality to measure process capability index, and the third is based on principal component analysis. Simulation results showed that the simultaneous application of these three methods could provide comprehensive information about the process capability index of multivariate linear profiles. Wang [22] proposed a method for circular profiles. In another attempt, Wang [23] proposed a method to measure the exact value of PCI for simple linear profiles. Subsequently, Wang [24] introduced two new methods to measure the PCI of simple linear profiles with a one-sided specification limit. Wang et al. [25] presented a method to estimate PCI of simple linear profiles with AR(1) auto correlated data. Wang et al. [26] suggested a method to measure the PCI of non-linear profiles. Guevara et al. [27] presented a method to evaluate PCI of non-linear profiles based on depth function. Nemati Keshteli et al. [28] explained a functional approach to measure PCI of circular profiles. Karimi Ghartemani et al. [29] introduced a new method to determine PCI of simple linear profiles.
In some situations in real world such as biology, environment and services, the response variable may follow binary or binomial distribution and the relationship between response and explanatory variables is well modeled by a logistic regression profile.
Evaluating the capability of such processes has not been studied in the literature. Hence, in this paper, we introduced a method to measure PCI of logistic regression profiles based on Spmk index. The new index takes into account process variability, departure of the profile mean from target value and proportion of nonconforming items.
The paper is organized as follows: section 2 gives a brief description of logistic regression profiles. In section 3, an index to estimate the process capability of logistic regression profiles is presented. In section 4, performance of the proposed method is evaluated through simulation studies. In the next section, the performance of the proposed index is presented by a real case, and finally conclusions and remarks for future research are provided.
2. LOGISTIC REGRESSION PROFILE
The logistic regression model is an important member of generalized linear model in which the response variable follows binomial distribution.
Consider the set of observation{xi, zij}ni1which in
1 2 3
xi (xi , xi , xi ,..., xip)T and zij , are the jth binary response variables in the thi level of the explanatory variable. The probability of success in zijis equal to
, 1, 2,..., , i
π i n j 1, 2,..,m where m is the number
of bernoulli variable in each level and E(zij)i πi, V ar(zij)πi(1πi). We denote πi π(xi) as the probability of a bernoulli process as a function of xi . In the logistic regression model there are different kinds of link functions which represent the relationship between the response variable and independent variable(s). Usually the link function of logitg π( i)is used for logistic regression as follows:
1 1 2 2
( ) log ...
1 ,
i
i i i p ip
i
g x x x
(1)
where β , β ,..., β1 2 p T
β ( ) is the parameters vector of the
model in which i ’s are real. When the response variable is binary, empirical observations reveal that the response function is a non-linear, s-shaped form. This function is called logistic regression and is defined as follows:
exp( )
1 exp( )
x β
x β
T i
i T
i
π
. (2)
likelihood estimation parameters method. Several studies have been carried out on estimating logistic regression parameters. For more information about parameter estimation in the logistic regression model see (Myers et al. [30] McCullagh and Nelder [31], Yeh et al. [32]).
In the following section, a method is proposed to determine the process capability index of logistic regression profiles.
3. DETERMINING PROCESS CAPABILITY INDEX FOR LOGISTIC REGRESSION PROFILE
Chen et al. [33] proposed a new capability index under non-normal distribution. The proposed index is as follows:
1 1
2 2
1 ( ) ( )
( ) (1 )
2 2
3 1 ( ) 3 1 ( )
,
pmk
F USL F LSL P
S
T T
(3)
where F x( ) denotes cumulative distribution of the process, and are the mean and standard deviation of the process respectively, and T is Target value. USL and LSL are upper and lower specification limits, respectively. Besides,
1 is inverse of cumulative distribution of standardized normal distribution and P the percentage of nonconforming items.Accordingly, based on Equation (3), in this section a method to calculate PCI of logistic regression profile is introduced. Consider a process in which the relationship between response variable and explanatory variables are described by logistic regression profile. The percentage of nonconforming items in each level which is equal to the mean of the profile, is calculated by using Equation (2).Suppose that response values follow binomial distribution. As a result, we have:
( )
( i),
i Py
(4)
( )
( ) ( )
E( ) ,
i
i i y
y mP (5)
( ) ( ) ( )
Var(yi )mP y( i )(1-P y( i )), (6)
where
( )
(yi )
P denotes the percentage of nonconforming
items in each level. A new process capability index Spmk for each level is proposed as follows:
( )
(( ))
( ) ( )
( ) ( )
( ) 1
2 ( ) ( ) ( ) ( )
(1 )
2 .
( )
3 1
(1 )
i
y i
i i
i i
y
pmk
y y
y y
P
S
mP T
mP P
(7)
After computing PCI in each level, the total percentage of nonconforming items should be calculated. According to the literature (Wang [23] and Wang et al. [26]), the total percentage of nonconforming items is calculated by the following equation:
( )
( )
1
Pr .
i
n y i ofile
P P
n
(8)Now, overall PCI is determined by the following equation using the total percentage of nonconforming items:
( )
( )
1
2
( ) ( )
( ) ( )
(1 )
2 ,
( )
3 1
(1 )
profile
profile
pmk
profile profile profile profile
P
S
mP T
mP P
(9)
where P(profile) is the total percentage of nonconforming items, mP(profile),mP(profile)(1P(profile)) are the mean and variance of the profile respectively, and T(profile) is target value of the profile which is the average number of nonconforming items based on customer expectations.
On the other hand, in most situations engineers are interested in evaluating confidence interval of process yield. Note that in constructing a confidence interval for process capability, an initial assumption about the distribution of a given population is required. Since the distribution of Spmk index is unknown, we have to use a method for computing confidence intervals which does not need any assumptions about the distribution of given population. For this purpose, nonparametric methods should be used. Afron [34] proposed a nonparametric computer based method known as bootstrap. The bootstrap is data based simulation method for statistical inference which is classified into parametric and nonparametric bootstrap methods. In nonparametric bootstrap method when the distribution of given population is unknown, resampling with replacement in main sample is done. Hence, in computing bootstrap confidence interval no initial assumption about given population is required. In this paper, we use percentile bootstrap confidence interval method to calculate a confidence interval of process capability index.
Suppose that is parameter of interest, ˆan
estimate of based on observed data and ˆ*a bootstrap estimator which is calculated based on bootstrap sample. Resampling is replicated B times and
B bootstrap estimators as
ˆ ˆ1*, 2*,...,
ˆB* are generated.* *
( ) ((1 ) )
2 2
ˆ ˆ
[ , ].
B B
(10)
As a result, based on Equation (10), confidence interval of Spmk index is calculated as
( ) ((1 ) )
2 2
* *
ˆ ˆ
[ , ].
B B
pmk pmk
S S
(11)
In practice, a process is called capable to meet customer expectations if Spmk 1 , marginally capable if Spmk 1 and incapable if 0Spmk 1.
4. PERFORMANCE OF THE PROPOSED INDEX
In this section, we evaluate the performance of the proposed method outlined in Section 3, using MATLAB software through simulation studies. For this purpose, we consider a logistic profile from Yeh et al. [32]. The underlying in-control logistic profile model, includes 9 levels of the explanatory variables, and the fixed values of explanatory variables are set as log(0.1), log(0.2), log(0.3),…, log(0.9) where the logistic regression profile is defines as:
(3 2 )
(3 2 ). 1
i
i
x
i x
e π
e
(12)
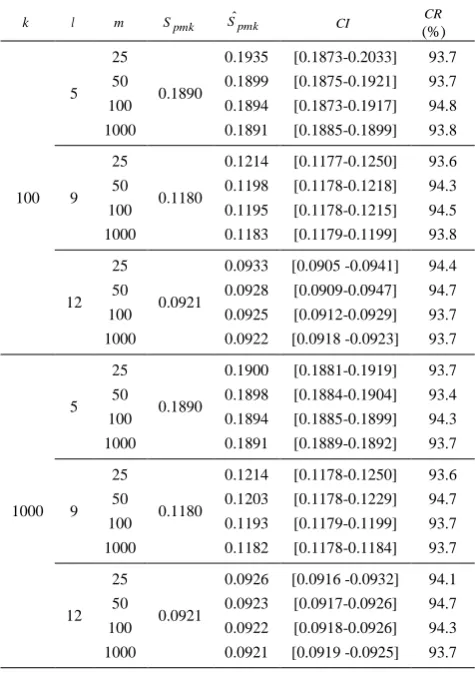
Number of observations in each level (m) is set equal to 25, 50, 100, and 1000 in the simulation runs. Furthermore, several number levels (l ) and several number of profiles (k ) have been considered. 1000 simulation runs are used to estimate PCI. The results of computed process capability are summarized in Table 1. The simulation algorithm is briefly explained as follows:
1. First, the percentage of nonconforming items in each level is calculated. Since the target value is not determined in the example, we suppose that the target value is calculated by multiplying of average percentage of nonconforming items obtained by Equation (12) and number of observations in each level. In fact, the target value is calculated as follows:
9
1
TargetValue .
9 i i
m
, (13)where i is calculated by Equation (12), mnumber of
observation in each level and i the number of levels.
2. Next, the binomial random numbers are generated with the parameter obtained from the previous step (This step is repeated 1000 times.).
3. Further, a logistic regression is fitted on the dataset, includingy
’s
and x’s which results would be 1000profiles.
4. Then, in this step, the percentage of nonconforming items is calculated in each level for each profile.
5. Following that, the total percentage of nonconforming items of each profile is determined (based on Equation (8)).
6. At the end of simulation procedure, the overall PCI of each profile is calculated and the average is reported.
ˆ pmk
S is calculated on the basis of the six mentioned
steps. However, Spmkis calculated by using Equation
(9).
7. In this step, 95% confidence interval and coverage rate are calculated. For a confidence level of 95%, lower limits of stated nominal value for coverage rate is equal to 93.6% which is computed as:
(0.95 1.96 0.05 (0.95 / replication) ) 100% .
As the results in Table 1 show, the coverage rates in most cases are above 93.64%.
On the basis of results in Table 1, proposed method for computing process capability index can effectively estimate PCI of the logistic regression profile. When the number of observations in each level increases, the performance of the proposed index improves. Hence, we conclude that the number of observations in each level affects the estimation of PCI. In addition when the number of levels increases, the value of the proposed index decreases. Note that when the number of levels enhance, the total percentage of nonconforming items becomes larger, and as a result, the value of process capability index naturally decreases. Generally, increasing number of levels leads to improving precision of the proposed index. As the results show, since the values of process capability indices are less than 1 for the considered example, the process is incapable of meeting customer expectations.
5. A REAL CASE
relationship between the percentage of defective products and the speed of the press is modeled by a logistic regression profile. The observations of the example are presented in the Table 2 in which the probability of defective items is the mean long-term probability at each level based on 100 samples.
TABLE 1. Simulation results of estimated process capability index and corresponding confidence interval
k l m Spmk Sˆpmk CI CR
(%) 100 5 25 50 100 1000 0.1890 0.1935 0.1899 0.1894 0.1891 [0.1873-0.2033] [0.1875-0.1921] [0.1873-0.1917] [0.1885-0.1899] 93.7 93.7 94.8 93.8 9 25 50 100 1000 0.1180 0.1214 0.1198 0.1195 0.1183 [0.1177-0.1250] [0.1178-0.1218] [0.1178-0.1215] [0.1179-0.1199] 93.6 94.3 94.5 93.8 12 25 50 100 1000 0.0921 0.0933 0.0928 0.0925 0.0922 [0.0905 -0.0941] [0.0909-0.0947] [0.0912-0.0929] [0.0918 -0.0923] 94.4 94.7 93.7 93.7 1000 5 25 50 100 1000 0.1890 0.1900 0.1898 0.1894 0.1891 [0.1881-0.1919] [0.1884-0.1904] [0.1885-0.1899] [0.1889-0.1892] 93.7 93.4 94.3 93.7 9 25 50 100 1000 0.1180 0.1214 0.1203 0.1193 0.1182 [0.1178-0.1250] [0.1178-0.1229] [0.1179-0.1199] [0.1178-0.1184] 93.6 94.7 93.7 93.7 12 25 50 100 1000 0.0921 0.0926 0.0923 0.0922 0.0921 [0.0916 -0.0932] [0.0917-0.0926] [0.0918-0.0926] [0.0919 -0.0925] 94.1 94.7 94.3 93.7
TABLE 2. The probability of defective products at different levels of the speed
Speed of machine press Probability of defective products
0.25 0.005
0.50 0.006
0.75 0.008
1.00 0.010
1.30 0.015
1.50 0.019
1.80 0.026
2.00 0.035
The underlying logistic regression model in which the parameters are estimated using the data presented in the Table 2 and based on the Newton-Raphson method, is as follows.
(5.702 1.174 )
(5.702 1.174 ). 1 i i x i x e π e (14)
The results obtained for calculating the process capability index of the example are demonstrated in Table 3. The result shows the suitable performance of the proposed index in real application. We conclude that this process is incapable of meeting customer expectations.
TABLE 3. Results of the estimated process capability index and the corresponding confidence interval
m Spmk CI
100 0.0065 [0.0040-0.0095]
6. CONCLUSION AND FURTHER RESEARCHES
There are many real cases in which the generalized linear regression models such as logistic regression are used to describe profiles. Considering intense competitiveness between industries, cost minimization and quality improvement are recognized as significant points which must be certainly considered. Hence, providing a process which meets customer expectations is extremely valuable.
statistical properties of the proposed process capability index could be fruitful area for future study.
7. REFERENCES
1. Kang, L. and Albin, SL."On-line monitoring when the process yields a linear profile" Journal of Quality Technology, Vol. 32, No. 4, (2000), 418–426.
2. Woodall, W.H., Spitzner, D.J., Montgomery, D.C., and Gupta, S."Using control charts to monitor process and product quality profiles." Journal of Quality Technology,Vol. 36, No. 3, (2004), 309–320.
3. Mestek, O., Pavlík, J., and Suchánek, M."Multivariate control charts: Control charts for calibration curves." Fresenius’
Journal of Analytical Chemistry,Vol. 350, No. 6, (1994), 344–
351.
4. Stover, F.S. and Brill, R. V."Statistical quality control applied to ion chromatography calibrations." Journal of Chromatography A, Vol. 804, No. 1, (1998), 37–43.
5. Kim, K., Mahmoud, M.A., and Woodall, W.H."On the monitoring of linear profiles." Journal of Quality Technology,
Vol. 35, No. 3, (2003), 317–328.
6. Mahmoud, M.A., Parker, P.A., Woodall, W.H., and Hawkins, D.M."A change point method for linear profile data." Quality
and Reliability Engineering International,Vol. 23, No. 2,
(2007), 247–268.
7. Zou, C., Zhang, Y., and Wang, Z."A control chart based on a change-point model for monitoring linear profiles." IIE
Transactions,Vol. 38, No. 12, (2006), 1093–1103.
8. Croarkin, M.C. and Varner, R.N."Measurement assurance for dimensional measurements on integrated-circuit photomasks." NBS Technical Note 1164, U.S. Department of Commerce, Washington, DC, (1982).
9. Wang, K. and Tsung, F."Using profile monitoring techniques for a data-rich environment with huge sample size." Quality and
Reliability Engineering International,Vol. 21, No. 7, (2005),
677–688.
10. Gupta, S., Montgomery, D.C., and Woodall, W.H."Performance evaluation of two methods for online monitoring of linear calibration profiles." International Journal of Production
Research, Vol. 44, No. 10, (2006), 1927–1942.
11. Keramatpour, M., Niaki, S., Khedmati, M., and Soleymanian, M."Monitoring and change point estimation of AR (1) autocorrelated polynomial profiles." International Journal of
Engineering-Transactions C: Aspects,Vol. 26, No. 9, (2013),
933–942.
12. Niaki, S.T.A., Abbasi, B., and Arkat, J."A generalized linear statistical model approach to monitor profiles." International
Journal of Engineering Transactions A Basics, Vol. 20, No. 3,
(2007), 233–242.
13. Abdella, G., Yang, K., and Alaeddini, A."Effect of location of explanatory variable on monitoring polynomial quality profiles."
International Journal of Engineering-Transactions A:
Basics,Vol. 25, No. 2, (2012), 131.
14. Noorossana, R., Saghaei, A., and Amiri, A."Statistical analysis of profile monitoring." John Wiley & Sons,Inc, Hoboken,New Jersey, (2011).
15. Woodall, W.H."Current research on profile monitoring." Revista
Produção,Vol. 17, No. 3, (2007), 420–425.
16. Shahriari, H. and Sarrafian, M."Assessment of process capability in linear profiles." Proceedings of the 6th International Industrial Engineering Conference, Tehran, Iran (in Farsi), (2009).
17. Razavi, H., Asadzadeh, A., and Naseri, Z."Determination of process capability indices for the slope parameter of a single variable linear profile." International Journal of Industrial
Engineering and Production Management,Vol. 21, No. 3,
(2010), 33–43.
18. Hosseinifard, S.Z. and Abbasi, B."Evaluation of process capability indices of linear profiles." International Journal of
Quality & Reliability Management, Vol. 29, No. 2, (2012),
162–176.
19. Hosseinifard, S.Z. and Abbasi, B."Process capability analysis in non normal linear regression profiles." Communications in
Statistics-Simulation and Computation, Vol. 41, No. 10,
(2012), 1761–1784.
20. Ebadi, M. and Shahriari, H."A process capability index for simple linear profile." The International Journal of Advanced
Manufacturing Technology,Vol. 64, No. 5-8, (2013), 857–865.
21. Ebadi, M. and Amiri, A."Evaluation of process capability in multivariate simple linear profiles." Scientia
Iranica-Transaction E:Industrial Engineering,Vol. 19, No. 6, (2012),
1960–1968.
22. Wang, F.K."Measuring the process yield for circular profiles." Published online in Quality and Reliability Engineering International,(2014).
23. Wang, F.-K."A process yield for simple linear profiles." Quality
Engineering,Vol. 26, No. 3, (2014), 311–318.
24. Wang, F."Measuring the process yield for simple linear profiles with one-sided specification." Quality and Reliability
Engineering International,Vol. 30, No. 8, (2014), 1145–1151.
25. Wang, F. and Tamirat, Y."Process yield analysis for linear within-profile autocorrelation." Published online in Quality and Reliability Engineering International,(2014).
26. Wang, F. and Guo, Y."Measuring process yield for nonlinear profiles." Quality and Reliability Engineering International, Vol. 30, No. 8, (2014), 1333–1339.
27. Guevara, R.D. and Vargas, J.A."Process capability analysis for nonlinear profiles using depth functions." Quality and
Reliability Engineering International,Vol. 31, No. 3, (2015),
465–487.
28. Nemati Keshteli, R., Kazemzadeh, R.B., Amiri, A., and Noorossana, R."Functional process capability indices for circular profile." Quality and Reliability Engineering International,
Vol. 30, No. 5, (2014), 633–644.
29. Ghartemani, M.K., Noorossana, R., and Niaki, S.T.A."A new approach in capability analysis of process monitored by a simple linear regression profile." Published online in Quality and Reliability Engineering International,(2014).
30. Myers, R.H., Montgomery, D.C., Vining, G.G., and Robinson, T.J."Generalized linear models: with applications in engineering and the sciences." John Wiley & Sons, (2012).
31. McCullagh, P., Nelder, J.A., and McCullagh, P."Generalized linear models." Chapman and Hall London, (1989).
32. Yeh, A.B., Huwang, L., and Li, Y.-M."Profile monitoring for a binary response." IIE Transactions,Vol. 41, No. 11, (2009), 931–941.
33. Chen, J.-P. and Ding, C.G."A new process capability index for non-normal distributions." International Journal of Quality &
Reliability Management, Vol. 18, No. 7, (2001), 762–770.
34. Efron, B."The jackknife, the bootstrap and other resampling plans." SIAM-NFS, Philadelphia, (1982).
35. Saghaei, A., Rezazadeh-Saghaei, M., Noorossana, R., and Dorri, M."Phase II logistic profile monitoring." International Journal
of Industrial Engineering and Production Management,Vol.
Process Capability Index for Logistic Regression Profile Based on
S
pmkIndex
M. Rezaye Abbasi Charkhia, M. Aminnayeria, A. Amirib
aIndustrial Engineering Department, Faculty of Engineering, Amirkabir University of Technology Tehran Polytechnic, Tehran, Iran bIndustrial Engineering Department, Faculty of Engineering, Shahed University, Tehran, Iran
P A P E R I N F O
Paper history:
Received 27April 2015
Received in revised form 29 June 2015 Accepted 30 July2015
Keywords: Profile Monitoring Logistic Profile Processes Capability Index
ديكچ ه
هطبار لیافورپ دنیآرف درکلمع ای لوصحم تیفیک رگنایب هک تسا لقتسم ریغتم دنچ ای کی و خساپ ریغتم کی نایم یا
یم
-دشاب رگید فرط زا . ،
صخاش .دنتسه یرتشم تاراظتنا هب لین تهج دنیارف تیفیک دوبهب یارب یرایعم دنیآرف ییاناوت یاه
لیافورپ یارب یدایز یدربراک دراوم نونک ات هچرگا شور و حرطم اه
لیافورپ یارب یفلتخم یاه اما ،تسا هدش هئارا اه
رد ینادنچ تاقیقحت هنیمز
لیافورپ یاهدنیآرف ییاناوت صخاش نییعت صخاش کی هلاقم نیا رد .تسا هدشن ماجنا ی
Spmk
هولاع هب .تسا هدش داهنشیپ کیتسجل لیافورپ دنیآرف تیلباق شیاپ یارب دیدج ،
نانیمطا هلصاف
(1)100%
صخاش
Spmk رظانتم نانیمطا هلصاف و صخاش نیا درکلمع.تسا هدش هبساحم یکدص پرتسا توب شور ساسارب نآ اب
هلیسو هب
هیبش تاعلاطم یم ناشن جیاتن .تسا هدش یبایزرا یزاس
دشاب رتشیب حطس ره رد تادهاشم دادعت هچ ره هک دهد ،
صخاش
یم ناشن ار یرتهب نیمخت نینچمه .دهد
، هولاع هب .دش دهاوخ صخاش تقد شیازفا هب رجنم حوطس دادعت شیازفا ،
جیاتن
یم ناشن ا یرایسب رد یهد ششوپ خرن هک دهد یمسا دح زا دراوم ز
6 / 39 ًاتیاهن .تسا رتگرزب هدش نییعت% ،
صخاش درکلمع
.تسا هدش هداد ناشن یعقاو لاثم کی اب