*Corresponding author:Rehan, SA
Civil Engineering Section, University Polytechnic (Boys), AMU, Aligarh ISSN: 0976-3031
Research Article
AN EXPERIMENTAL STUDY OF ANGLE OF REPOSE OF AGGREGATES AND ITS
CORRELATION WITH THE SHAPE PARAMETERS
Rehan, SA*
Civil Engineering Section, University Polytechnic (Boys), AMU, Aligarh
DOI: http://dx.doi.org/10.24327/ijrsr.2017.0812.1349
ARTICLE INFO ABSTRACT
In the present work aggregates from a single source is used. The angularity levels of the aggregates are changed by crushing or polishing. The angle of repose values of crushed, natural and polished aggregates for different sizes are estimated. Subsequently an improvement in the method of measurement of angle of repose is suggested. Shape parameters of aggregates (Shape factor and Sphericity) are computed using Image processing the method given by MoraandKwan (2000). Finally dependency of angle of repose of aggregate heap on shape of aggregate has been found out.
INTRODUCTION
One of the important properties of non-cohesive granular material is angle of repose. Angle of repose the maximum slope angle at which the material at rest. Some early researchers referred angle of repose as angle of internal friction but Stewart (1968) experimentally shown that the two angles are different. The angle of repose is of two types static and dynamic. According to Chukwu and Akande (2007)
Static angle of repose: This is the angle of friction taken up by a granular material about to slide upon it.
Dynamic angle of repose: This is related to a situation where a bulk of the materials is in motion such as movement of solid discharging from a bin and hopper.
Burkalow (1945) performed a lot of experiments to find out the dependency of angle of repose on physical and geometrical properties of fragments (particles of granular media). He concluded that the angle of repose varies:
Inversely with size of fragments in perfectly sorted materials, but directly in those imperfectly sorted. Inversely with density of fragments.
Directly with their angularity, roughness, and degree of compaction.
Inversely with height of fall of material on free cones.
Directly with increase of moisture up to the saturation point but inversely beyond that.
The theoretical studies primarily involved simulation through Discrete Element Method (DEM). Leeand Herrmann (1993) showed that a linear relationship exists between angle of repose and static coefficient of friction.
Zhou et al. (2001) presented a numerical study on mono-sized spheres. They showed that angle of repose is dependent on coefficient of sliding, rolling friction and size of particle. They concluded that coefficient of sliding and rolling frictions are prime factors for stabilizing piles. They observed that the angle of repose increases with increase of coefficients of sliding and rolling frictions, and the angle of repose decreases with the increase in size (this effect is due to effect of size in on rolling coefficient of friction).
Salah et al. (2005) performed simulations on two-dimensional non-elongated and elongated polygonp articles. They showed that particle shape and coefficient of friction are crucial factors that affect angle of repose. They found that angle of repose (i)increases with increase in coefficient of friction and (ii)decreases with increase in number of corners of polygon particles.
Recent Scientific
Research
International Journal of Recent Scientific Research
Vol. 8, Issue, 12, pp. 22851-22855, December, 2017
Copyright © Rehan, SA, 2017, this is an open-access article distributed under the terms of the Creative Commons Attribution License, which permits unrestricted use, distribution and reproduction in any medium, provided the original work is properly cited.
DOI: 10.24327/IJRSR CODEN: IJRSFP (USA)
Article History:
Received 16th September, 2017 Received in revised form 25th October, 2017
Accepted 23rd November, 2017 Published online 28th December, 2017
Key Words:
Correlation With The Shape Parameters
Mora and Kwan (2000) proposed a method of finding the dimensions Length, Width and Thickness of a particle using Digital Image Processing. From digital image two dimensions length and width are computed. He proposed a method of calculating thickness with an assumption that aggregate particle from same source have more or less same shape characteristics.
ℎ = × ℎ
Where λ is a parameter dependent on the flakiness of the aggregate
He showed method to calculate λ and then Sphericity and shape factor is calculated as
ℎ = ℎ
ℎ
ℎ = × ℎ
ℎ
Thus, simulation studies show the angle of repose of aggregates is influenced by coefficients of sliding and rolling friction of the particles. It can be hypothesized that sliding friction is possibly due to small-amplitude variations, like, texture of the aggregate surface, and rolling friction is possibly due to large-amplitude variations, like angularity.
Fowler and Chodziesner (1958) carried out experiments on dry wheat, rice and different types of sand to determine the variable affecting angle of friction. They found the angle of friction (θ) depends on shape factor (fs), specific gravity (S1), diameter of particle (D) and roughness (ε) of the surface.
µ= =0.2110+ 0.3436 .
− 0.0171 + 0.1834
The equation predicts sliding angle of dry material within the ranges fs = 067 to 160, S1 = 1.103 to 11340, D = 0.0272 cm to 04026 cm and ε = 0.02’72 cm to 0.3134 cm.
Experimental Study
Material used
Aggregate from Single source Jhansi is taken and divided in three categories.
1. Crushed - freshly crushed in laboratory 2. Normal - as taken from market
3. Polished - polished in Los-Angeles apparatus
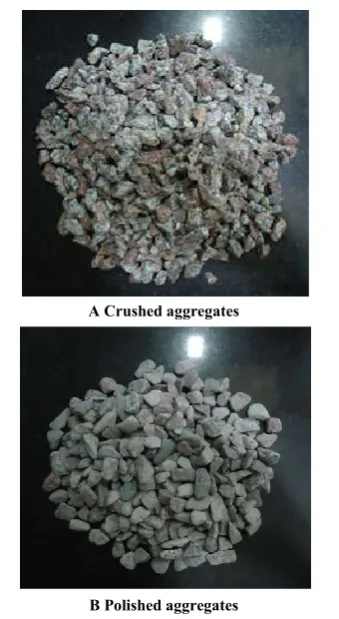
Crushed aggregates has been prepared by crushing the aggregates in the laboratory and polished aggregates are prepared by polishing the aggregates in in Los-Angeles apparatus. Freshly crushed aggregates and polished aggregates are shown in Figure 1
A Crushed aggregates
B Polished aggregates
Figure 1 Figure showing Crushed and polished aggregates
Four sizes of all the three categories of aggregates are taken and the notation used for the sizes and types are shown in Table 1.
Table 1 Notations used for referring aggregates
size (mm) Type of aggregates
Crushed Normal Polished
19.0-13.2 C13.2r N13.2r P13.2r
13.2-9.5 C9.5r N9.5r P9.5r
9.5-4.75 C4.75r N4.75r P4.75r
4.75-2.36 C2.36r N2.36r P2.36r
Proposed method for measurement of angle of repose
In this study a new method of angle of repose measurement is proposed in which a circular raised pedestal of different diameters are used to make the heap of aggregates. The height of the heap is measured and angle of repose is calculated as.
= (2 × ℎ)
22853 |
P a g e
Figure 2 Figure showing the heap of aggregates on raised pedestal
Table 2 Angle of repose of aggregates determined by proposed method
size Aggregate type
Crushed Normal Polished
19.0-13.2 47.14 44.21 43.76
13.2-9.5 45.03 43.46 42.35
9.5-4.75 44.05 41.71 40.74
4.75-2.36 41.62 40.94 40.73
Computation of shape parameters
Two shape parameters Shape factor and Sphericity for 12 set of aggregate (C13.2r, C9.5r, C4.75r, C2.36r, N13.2r, N9.5r, N4.75r, N2.36r, P13.2r, P9.5r, P4.75r and P2.36r) are computed using Digital Image Processing (DIP).
50 aggregate sample randomly taken from each set. The image of each set of aggregates is taken from laboratory camera and is processed in Imagej software to remove noise. Method proposed by Mora and Kwan in…. is used to find out Shape factor and Sphericity. Code in Matlab is written to find the length, width and thickness of each aggregate. Length and width is determined by bounding aggregates with the minimum area rectangle as shown in Figure 3 and the thickness is computed taking the assumption that the aggregate form same source have more or less same shape characteristics.
ℎ = × ℎ
Where λ is a parameter dependent on the flakiness of the aggregate
The image of 50 samples of C13.2r and P13.2r are shown in Figure 4 and Figure 5 receptively.
Figure 3 Computation of length and breadth
a C13.2r aggregate
b Processed image of C13.2r aggregate
Figure 4 Figure showing C13.2r aggregate and its processed image
A P13.2r aggregate
b Processed image of P13.2 aggregate
Figure 5 Figure showing P13.2r aggregate and its processed image
Correlation With The Shape Parameters
= × × ( ℎ × )
The parameter λ is computed as
= ℎ × = × ℎ ×
Adding the volume of all the particles and multiplying by density ρ, the total mass M is given as
= × × ( ℎ × )
Where n is the total number of particles in this case n is 50. From the above equation λ is computed as.
=
× ∑ ( ℎ × )
Now shape factor and sphericity of each aggregate is calculated as.
ℎ = ℎ
ℎ
ℎ = × ℎ
ℎ
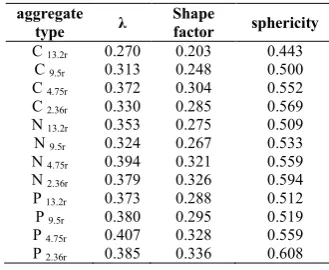
The average of 50 Shape factor and Sphericity values give the Shape factor and Sphericity for the 12 set of aggregates and the values are shown in Table 3.
Table 3 Shape factor and sphericity values computed from Matlab
aggregate
type λ
Shape
factor sphericity
C 13.2r 0.270 0.203 0.443
C 9.5r 0.313 0.248 0.500
C 4.75r 0.372 0.304 0.552
C 2.36r 0.330 0.285 0.569
N 13.2r 0.353 0.275 0.509
N 9.5r 0.324 0.267 0.533
N 4.75r 0.394 0.321 0.559
N 2.36r 0.379 0.326 0.594
P 13.2r 0.373 0.288 0.512
P 9.5r 0.380 0.295 0.519
P 4.75r 0.407 0.328 0.559
P 2.36r 0.385 0.336 0.608
RESULTS
The angle of repose of all the three categories for four sizes has been found and correlated with the shape parameters sphericity and shape factor. The results are shown in Table and Figure and Figure.
Table 4 Angle of repose for different types with its shape parameters
Type AOR Shape
Factor Sphericity
P 2.36 40.73 0.3358 0.6077
P 4.75 40.74 0.3283 0.5590
N 2.36 40.94 0.3264 0.5944
C 2.36 41.62 0.2848 0.5685
N 4.75 41.71 0.3207 0.5591
P 9.5 42.35 0.2955 0.5193
N 9.5 43.46 0.2671 0.5333
P 13.2 43.76 0.2878 0.5121
C 4.75 44.05 0.3040 0.5520
N 13.2 44.21 0.2745 0.5089
C 9.5 45.03 0.2483 0.5001
C 13.2 47.14 0.2030 0.4430
Figure 6 Chart showing correlation between angle of Repose and shape factor
Figure 7 Chart showing correlation between Angle of Repose and Sphericity
DISCUSSION
The method proposed by Mora and Kwan found quite suitable for finding the shape properties of aggregates. The results of Shape parameters shows that as the angularity of the aggregates increases the interlocking between the aggregates get enhanced, as a result the stable piles make steeper angle with the horizontal and angle of repose is increased. Also as the size of aggregate decreases the shape is tending towards the sphere and hence angle of repose decreases.
CONCLUSION
Angle of repose of a pile is found to strongly dependent of the shape of aggregates. As the Shape became more angular the angle of repose of the pile increases and as the shape tends to spherical by polishing the angle of repose decreases. The following conclusions have been made from the present study.
Proposed method for the measurement of angle of repose is found to be more realistic and accurate Shape factor is observed to decrease with the increase
of angle of repose.
Sphericity is also observed to decrease with the increase of angle of repose.
References
Burk low, A. V. (1945). "Angle of repose and angle of sliding: an experimental study. “Bulletin of the Geological Society of America, 56, 669-708.
Chukwu, O., and Akande, F. B. (2007). "Development of an apparatus for measuring angle of repose of granular materials." AU Journal, 62-66., http://www.journal.au.edu/
0.0000 0.0500 0.1000 0.1500 0.2000 0.2500 0.3000 0.3500 0.4000
40.00 42.00 44.00 46.00 48.00
Sh
a
pe
Fa
ctor
Angle of Repose
0.0000 0.1000 0.2000 0.3000 0.4000 0.5000 0.6000 0.7000
40.00 42.00 44.00 46.00 48.00
Sp
heri
ci
ty
22855 |
P a g e
au_techno/2007/Jul07/auJournalTech_article10.pdf, last accessed November 30, 2014.
Fowler, R. T., and Chodziesner, W. B. (1985). “The influence of variables upon the angle of friction of granular materials.” Chemical Engineering Science, Vol 10, 157-162.
Mora, C. F., and Kwan, A. K. (2000). "Sphericity, shape factor, and convexity measurement of coarse aggregate for concrete using digital image processing." Cement and Concrete Research 30, 351-358.
Salah, A. M., EL, S., and Hans-Georg, M. (2005). “Dependence of the angle of repose of heaps on the particle shape.” Kyoto University.<http://hdl.handle.net/ 2433/2620>.
Stewart, B. R. (1968). "Effect of moisture content and specific weight on internal angle of friction of sorghum grains." American Society of Agricultural and Biological Engineers, 11(2), 0260-262.
Zhou, Y. C., Xu, B. H., and Yu, A. B. (2001). "Numerical investigation of the angle of repose of monosized spheres." Physical Review E, 64, 021301.
*******
How to cite this article: