A b s t r a c t. Processes of compaction of granular materials were described using selected models. The analysis of their accuracy on the example of wheat was the basis for the discussion on their applicability to the processing of plant-origin materials. Parameters of the model equations for wheat, com-pressed at 10-18% moisture content were calculated, and the relations between these parameters and wheat moisture were determined. It was found that the analyzed models described the pressure compaction of granular plant material with different accuracy, and were highly dependent on moisture. The study also indicated that the model of Ferrero et al.fits the experimental results well. The parameters of this model reflected very well the physical phenomena which occur during compression.
K e y w o r d s: pressure compaction models, wheat meal, moisture
INTRODUCTION
Processes such as extrusion or granulation require knowledge about the agglomeration of plant raw materials (Obidziñski, 2012). Much of the research to determine the compaction properties of these types of plant materials have been conducted in a closed compartment (Laskowskiet al., 2005). Experiments reveal that the pressure compaction of biological materials in closed compartments can be the basis for describing the phenomena associated with the granula-tion process and makes it possible to fully characterize both the process and the product. At the same time, determining the dependence between material density and load used for compaction (pressure - density relationship), along with the material behaviour after taking it out of the matrix, is also important. Materials of plant origin show a large variability in their physical features with the change in moisture content (Barnwalet al., 2012; Wi¹cek and Molenda, 2011). This is a cause for considerable difficulties when modelling the compaction process. Numerous references in the literature
relate to modelling of metals, ceramic or pharmaceutical powders, or chemical materials (Chevanan et al., 2010; Fenget al., 2007; Hawareet al., 2009; Paneli and Filho, 2001; Souriou et al., 2009). Equations have often been presented which set the dependencies between the load used (pressure) and the physical properties of powder, pressure vs. specific volume, and internal stressvs. material deforma-tion. Uniaxial confined compression has been applied to describe the elastic properties of food powders (Molenda and Stasiak, 2002; Molendaet al., 2006). The process was de-scribed using both elastic and plastic models,ie Drucker-Prager, Di Maggio-Sandler, and Cam-Clay. They are dis-cussed in numerous works (Chenet al., 2001; Cocks, 2001; Michrafyet al., 2002; Rolland et al., 2012; Sinkaet al., 2003; Wuet al., 2005).
Previous publications (Laskowskiet al., 2005; Laskow-ski and Skonecki, 2001) have presented results concerning the influence of moisture content and material temperature on the compaction parameters and susceptibility of cereal and legume grains to the agglomeration process. The study pre-sented herein deals with the analysis of the compaction pro-cess. While an earlier work by Skonecki (2004) reported on the details of compaction analysis, this paper aims at eva-luating the applicability of models (equations) applied for describing the compaction course for processing plant materials.
MATERIALS AND METHODS
Wheat meal was used in this study. The mean particle size of the samples ground at 10+/-0.2% moisture content was 1.02 mm.
Research on the compaction processes was performed at moisture contents ranging from 10 to 18% (every 2±0.2%). The compaction tests were performed using a ZD40 hydraulic Int. Agrophys., 2014, 28, 125-130
doi: 10.2478/intag-2013-0035
Models of pressure compaction and their application for wheat meal
Stanis³aw Skonecki, Ryszard Kulig, and Grzegorz £ysiak
Department of Machine Operation in Food Industry, University of Life Sciences, Doœwiadczalna 44, 20-280 Lublin, Poland Received June 25, 2012; accepted February 19, 2013
© 2014 Institute of Agrophysics, Polish Academy of Sciences *Corresponding author e-mail: [email protected]
www.international-agrophysics.org
press (VEB WPM Leipzig, Germany). The press was equipped with a pressing assembly with a closed matrix (the diameter of the trial compartment was 25 mm). Values of the compression force and piston displacement were monitored by computer recording. A detailed description of the press and pressing assembly has been presented in previous publications (Laskowskiet al., 2005; Skonecki, 2004). The following conditions were maintained during the compaction testing: sample weight 0.02 kg, sample temperature 293 K, piston speed 0.3 mm s-1, maximum pressure 200 MPa.
The compaction curves (relating the force to piston displacement) (Laskowski et al., 2005; Skonecki, 2004) were registered during every measurement. In the study the values of forces and displacements for five wheat grain moisture levels were registered, which made it possible to calculate the parameters applied in compaction equations, eg specific pressure (being the quotient of the force and cross-section area of the compaction compartment), in re-lation to the features of processed material (density, specific volumeetc).
The results of experiments done were used to determine the parameters associated with each compaction model. All computations were made using Statistica (StatSoft, Inc. 2003). The non-linear estimation was applied using a quasi-Newtonian method.
Models used in the present paper are quoted and described below.
Faborode and O’Callaghan (1986) achieved the depen-dence between loadPand densityrof the material in the form:
P a
b b
o
o
= æ
-è
çç öø ÷÷-é
ë
ê ù
û ú
r r
r
exp 1 1 , (1)
where:ro– initial density,a,b – experimental constants,
wherearo=Ko– compression bulk modulus,a– expresses
ma-terial incompressibility,b– is the material porosity index. Ferrero et al. (1991) described the relation for com-paction of fibrous plant materials in the form:
r r= o+ +(A BP)[1-exp(-CP)]. (2)
The parametersA,B,Cpresented in the equation have the following physical meaning:
A(g cm-3) – maximum hypothetical increase in density (in relation to the initial one) during unloading (decompression of agglomerate). In fact, studies revealed that real density of agglomerate is slightly lower thanro+A;
B(g cm-3MPa-1) – apparent elasticity of material. TermB
ro-1is related to material compressibility;
C (MPa-1) – expresses mainly the proportion of density increase during the compaction phase; it decreases along with an increase in pressure. TheACproduct illustrates the slope of curve for unit load P= 0 (ACro-1– initial
com-pressibility).
Kawakita and Ludde (1971) presented the dependence between change of relative material volume and pressure; the equation is of the following form:
V V
V
abP bP
o
o
-=
+1 or P
c ab P a
= 1+ , (3)
where:V V
V c
o
o
-= – change in volume of material,a,b–
con-stants with their physical meaning,a– refers to the initial porosity,b– represents deformation of particular particles, b-1– defines the qualitative associations with the limit of plasticity.
Heckel (1961), having focused on metal powders, pre-sented the dependence that is applicable for high pressures (400 MPa). The Eq. (4) illustrates proportional dependence of the logarithm of reciprocal porosity of a material on pressure:
ln1
ekP+A or ln 1
1-D=kP+A, (4) where:D– compression coefficient; (1-D) = e– powder porosity; k, A – experimental constants. The constant A defines the compaction degree reached at low pressure by rearrangement and displacement of particles (first com-paction phase), while the constant k – ability to change the density by means of plastic deformation, k-1– reciprocal of k equals approximately to 3so(so– limit of plasticity).
Denny (2002), when comparing Heckel model with Kawakita-and-Ludde, claims that both of them have the same form at low pressures.
Lordiet al.(1997) developed a compaction equation on the basis of pressureP vs. specific volumeV,determined for various materials (sodium chloride, polyethylene, starch, etc.) at different loads, up to 400 MPa. Thus, the compaction equation takes the following form:
PV=k[1-exp(bP)]+V Pd , (5) where:k,b– parameters dependent on loading conditions (displacements, compression speed) and characteristics of material,Vd– dynamic limiting specific volume.
The authors distinguish three compaction phases within the framework of this model:
– At pressuresP<10 MPa, rearrangement of particles and their interactions dominate, calculated threshold – load Po= 1/b,
– At increased pressure toPd– mainly compaction. LoadPd
defines the minimum load necessary to form agglomerate with sufficient durability,
– At pressures higher thanPd, decrease of specific volume
V-Vd is proportional to 1/P.
Advantages of Lordiet al.model comprise of: – Excellent compliance with experimental data during
compaction phase forP>Po(data fitting forP<10 MPa is
– Calculated parameters of the dependence (5) ofPVonP are:
k– unit compaction work (J g-1); Po=1/b– initial compaction load (MPa);
Vd– dynamic limiting specific volume of material (cm3g-1).
RESULTS AND DISCUSSION
The calculated parameters of selected models (equa-tions) for variations in moisture content of wheat are psented in Tables 1-5. Some exemplary dependencies re-sulting from measured values (observed values) and those from fitted function (model) are presented for the selected wheat moistureie w=10% in Figs 1-5. The dependence of these parameters on grain moisture was described by means of linear regression and the results are included in Table 6. The parametersaandbof the Faborode and O’Calla-ghan model, for various wheat moisture contents, are listed in Tables 1 and 6. Utilizing this model (Eq. (1)), deter-mination coefficients over the range of moisture contents tested varied from 0.998 to 0.984 (Table 1), which indicates that the model fits well to the experimental data. The deter-mination coefficient decreases slightly for higher moisture content samples ie the model fits the experimental data better at lower moisture levels than at higher moisture levels. Figure 1 demonstrates the small differences between values calculated from the equation and the experiments.
The variation in the parameters within the model as a function of moisture content are shown in Table 6. The constant a which describes the material incompressibility and the calculated bulk compression modulusKo (propor-tional dependence ofKoon a) decreased with an increase in
moisture content. These parameters reached their minimum at the peak moisture (18%). Therefore, wheat demonstrates the greatest susceptibility to compaction (concentration) at higher moisture levels. The bulk compression modulus ranged from 4.4 to 0.3 MPa. The parameterb, which is an indicator of material porosity, increased with an increase in grain moisture content (Table 6). This indicator varied from 4.923 at 10% moisture content up to 7.978 at 18% moisture (Table 1).
The parameters (A,B,C) used in the model proposed by Ferreroet al.(Eq. (2)) for wheat at various moisture contents are presented in Table 2. The determination coefficients over the range of moisture contents tested varied from 0.947 to 0.929. The lowest value was achieved for wheat at mois-ture content of 14%, while the highest occurred at 18% moisture. Experimental and predicted values described by this model are presented in Fig. 2 for wheat moisture ofw= 10%. The relations between parametersA,B,andCas a fun-ction of wheat moisture content are described using linear regression equations (Table 6). The coefficientAincreases with a rise in moisture content. The measurements of the agglomerate density (after taking out of the matrix) revealed that this density increased with moisture increase up to 16%. The true density of the agglomerate varied from 1.18 to 1.23 g cm-3. The value of the calculated sum for constantAand initial densityro amounted to 1.26-1.34 g cm-3iehigher than that of the agglomerate, which is consistent with the findings of Ferreroet al.(1991).
An increase in wheat moisture content causes a decrease in parameterBwhich defines material elasticity. This re-veals that as the moisture content increases the wheat be-comes more plastic. Wheat at a moisture content of 18%, was characterized by low elasticity. Studies by Laskowskiet al.(2005), and by Laskowski and Skonecki (1999), on the influence of moisture on compaction parameters and the susceptibility to compaction are consistent with the results achieved from the compaction model.
Moisture content (w, %)
a
(MPa cm3g-1) b R
2
10 5.529 4.923 0.998
12 2.141 5.739 0.996
14 1.965 5.823 0.992
16 0.517 7.228 0.986
18 0.309 7.978 0.984
T a b l e 1.Parameters of Eq. (1) for compaction of wheat with various moisture contents as well as determination coefficients R2
Moisture content (w, %)
A (g cm-3)
B (g cm-3MPa-1)
C
(MPa-1) R
2
10 0.408 0.0029 0.628 0.940
12 0.443 0.0027 0.719 0.937
14 0.435 0.0024 0.729 0.929
16 0.487 0.0021 0.751 0.941
18 0.515 0.0020 0.833 0.947
The parameter C (Tables 2 and 6) in this model in-creased with an increase in moisture content. This reveals that material at higher moisture levels demonstrates a higher increase in density at the first compaction phase. And similarly, the productAC(slope of the curve for unit pres-sureP= 0) varies with an increase in moisture content.
The parameters used in the model proposed by Kawakita-and-Ludde (Eq. (3)) are listed in Table 3. The coefficienta,which is used to describe the initial porosity, is almost stable across the range of moisture contents used in this study (it varies from 0.434 to 0.461) (Table 6). The
Moisture content
(w, %)
a b
(MPa-1) R
2
10 0.434 1.110 0.899
12 0.446 1.274 0.912
14 0.440 1.328 0.899
16 0.458 1.421 0.947
18 0.461 1.498 0.951
T a b l e 3.Parameters of Eq. (3) for compaction of wheat with various moisture contents as well as determination coefficients R2
Moisture content
(w, %)
k
(MPa-1) A R
2
10 0.022 0.912 0.945
12 0.030 0.921 0.949
14 0.031 0.925 0.956
16 0.036 0.931 0.947
18 0.039 0.959 0.912
T a b l e 4.Parameters of Eq. (4) for compaction of wheat with various moisture contents as well as determination coef- ficients R2
Moisture content (w, %)
k (J g-1)
b (MPa-1)
Vd (cm3g-1)
R2
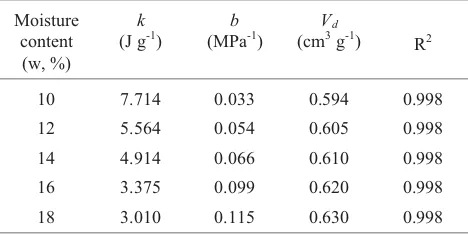
10 7.714 0.033 0.594 0.998
12 5.564 0.054 0.605 0.998
14 4.914 0.066 0.610 0.998
16 3.375 0.099 0.620 0.998
18 3.010 0.115 0.630 0.998
T a b l e 5.Parameters of Eq. (5) for compaction of wheat with various moisture contents as well as determination coefficients R2
Densityr(g cm-3)
Pressure
P
(MPa)
Density
r
(g
cm
-3)
PressureP(MPa)
Change
of
re
lative
volum
e
(
Vo
-V
)/V
o
PressureP(MPa)
ln
(1/(1-D
))
PressureP(MPa)
Fig. 1.Fitting the models of: a – Faborode and O’Callaghan, b – Ferreroet al., c – Kawakita-and-Ludde, d – Heckel, e – Lordiet al. (Eq. (1)-(5), respectively) to experimental data from compaction of wheat grain at moisture content 10%.¾Fitted model, experi-mental data.
PV
(MPa
cm
3 g -1 )
PressureP(MPa) a
b
c
d
constant b, which is used to describe the particle deforma-tions, is the highest at 18% moisture. Experimental and pre-dicted values using this model are shown in Fig. 3. Consi-derable differences were observed between values calcula-ted from the model and the experimental data. Based on these results the applicability of this model for testing bio-logical materials appears to be limited.
The values of the Heckel model parameters (Eq. (4)) kandAfor different wheat moisture levels are presented in Table 4. The determination coefficients over the range of moisture contents tested varied from 0.912 to 0.956. Over the range from 10 to 16% moisture content the model fits the data well. However, for more moist (more plastic) materials, the fitting of values calculated from the model to the experimental data was worse. Experimental and predicted values using this model are shown in Fig. 4 for moisture content ofw= 10%.
The regression equations relating the parameterskand Ato variations in wheat moisture are shown in Table 6. The parameterkincreases with an increase in moisture content. This indicates that when moisture increases, the value ofk-1 (3so) decreases causing the material susceptibility to com-paction to be enhanced. The parameterk-1varied from 45.7 to 25.8 MPa (for the moisture range 10-18%). Moisture also affected the compaction process by means of particle re-arrangement (higher value of indicatorA, Table 4).
The parameters used in the Lordiet al.model (Eq. (5)), k,b,andVd, for a given moisture content are presented in
Table 5. The determination coefficients described by Eq. (5)
over the range of moisture contents studied reached the value of 0.998. This indicates that this is a very good fitting model to the experimental data. The exemplary dependence achieved from measurements (experimental data) and fitted function according to Eq. (5) for moisture levelw= 10% is shown in Fig. 5. It confirmed very good conformity of experimental results with those achieved from the model.
The relationships of the model parameters to wheat moisture content are shown in Table 6. The coefficientk de-creased with an increase in moisture content. Hence, in-creased moisture causes a decrease in the specific com-paction work (k), which is invoked by the lubricating effect of a liquid and the change in material mechanical properties (it becomes more plastic). Values ofkvaried from 7.7 to 3.01 J g-1. The experimental data revealed that specific com-paction work varied from 15.2 to 9.5 J g-1, which was larger than the values of kestablished from the model.
The parameterb(Tables 5 and 6) increased(ieinitial pres-surePo=b-1decreased) along with wheat moisture. Its va-lues varied from 0.033 to 0.115 MPa-1. Over the range of moisture contents tested, pressurePovaried from 30 to 8.7 MPa, demonstrating that particle rearrangement as described by this model takes place at relatively low loads. These results indicate that higher compaction work occurred at values of higher pressurePo. The dependence between pressurePo and workkis linear.
Similarly, the limiting specific volumeVdas described by the model increased with an increase in the moisture con-tent of wheat (Tables 5 and 6),iethe limiting densityrd de-creased. For these values of moisture (10-18%), the limiting density of wheat varied from 1.68 to 1.59 g cm-3. This density is greater than the maximum density of the material observed in the compartment during compaction, which was 1.58-1.50 g cm-3. The pressurePd(upper limit) determined from the model varied from 86 to 18 MPa. Those values are too low to achieve agglomerate with sufficient strength (the pressure determined from experimental data on the basis of compaction curve for moisture contents of 10-18% ranged from 143 to 82 MPa).
Despite the very good fit of this model to the empirical data, the constants in this model, such as compaction work and limiting specific volume, differed significantly from experimental results and characterized the change in the material properties with respect to moisture in a biased way. Therefore, this model can be used to describe the compac-tion of granular biological materials only to a limited degree.
CONCLUSIONS
1. Evaluation of the influence of wheat moisture on the parameters of compaction equations indicates that the effect can be described by linear equations. The degree of fit of the models to the experimental data depends on the moisture content.
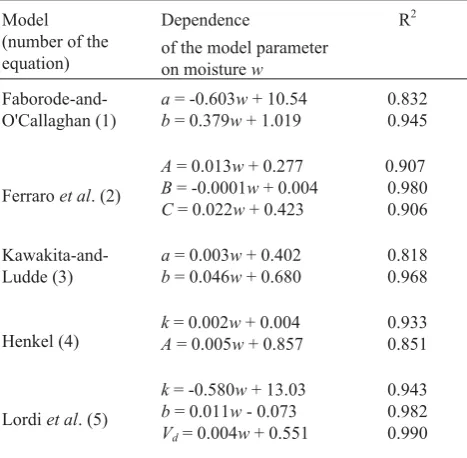
Model (number of the equation)
Dependence
of the model parameter on moisturew
R2
Faborode-and-O'Callaghan (1)
a= -0.603w+ 10.54 b= 0.379w+ 1.019
0.832 0.945
Ferraroet al. (2)
A= 0.013w+ 0.277 B= -0.0001w+ 0.004 C= 0.022w+ 0.423
0.907 0.980 0.906
Kawakita-and-Ludde (3)
a= 0.003w+ 0.402 b= 0.046w+ 0.680
0.818 0.968
Henkel (4)
k= 0.002w+ 0.004 A= 0.005w+ 0.857
0.933 0.851
Lordiet al. (5)
k= -0.580w+ 13.03 b= 0.011w- 0.073 Vd= 0.004w+ 0.551
0.943 0.982 0.990
2. Lordi et al., Heckel, as well as Faborode and O’Callaghan models describe the experimental data with a high degree of accuracy (high determination coefficients). However, some parameters in these equations, characteri-zing material features, differ from those experimentally determined. The largest differences between calculated and experimental results were observed for the Kawakita-and-Ludne model.
3. The Ferrero et al.model describes well the experi-mental data. Moreover, the parametersA,B,andCreflect the physical phenomena occurring within compressed material. The compaction of granular plant-origin material according
to Ferrero et al. model can be divided into three
charac-teristic phases revealing changes in the structure of com-pressed material. The increase of moisture invokes higher rise in the material density within the first two phases (initial deformation and main compaction). A slight density increa-se at high pressure increaincrea-se (linear dependence) was record-ed in the third phase of compaction.
REFERENCES
Barnwal P., Kadam D.M., and Singh K.K., 2012.Influence of moisture content on physical properties of maize. Int. Agrophys., 26, 331-334.
Chen B., Cheng A.H.-D., and Chou T.-W., 2001.A nonlinear compaction model for fibrous preforms. Composites-Part A: Appl. Sci. Manufacturing, 32(5), 701-707.
Chevanan N., Womac A.R., Bitra V.S.P., Igathinathane C., Yang Y.T., Miu P.I., and Sokhansanj S., 2010.Bulk density and compaction behavior of knife mill chopped switchgrass, wheat straw, and corn stover. Bioresor. Technol., 101, 207-214.
Cocks A.C.F., 2001. Constitutive modelling of powder com-paction and sintering. Progress Materials Sci., 46, 201-229. Denny P.J., 2002.Compaction equations: a comparison of the
Heckel and Kawakita equations. Powder Technol., 127, 162-172.
Faborode M.O. and O'Callaghan J.R., 1986.Theoretical analysis of the compression of fibrous agricultural materials. J. Agric. Eng. Res., 35, 175-191.
Feng Y., Grant D.J.W., and Sun C.C., 2007.Influence of crystal structure on the tableting properties of n-alkyl 4-hydroxyben-zoate esters (parabens). J. Pharmaceutical Sci., 96(12), 3324-3333.
Ferrero A., Horabik J., and Molenda M., 1991.Density-pressure relationships in compaction of straw. Canadian Agric. Eng., 33, 107-111.
Haware R.V., Tho I., and Bauer-Brandl A., 2009.Multivariate analysis of relationships between material properties, pro-cess parameters and tablet tensile strength for alpha-lactose
monohydrates. European J. Pharmaceutics Biopharmaceu-tics, 73, 424-431.
Heckel R.W., 1961.Density – pressure relationships in powder compaction. Trans. Met. Soc., AIME, 221, 671-675. Kawakita K. and Ludde K.H., 1971.Some considerations of
powder compression equations. Powder Technol., 4, 61-68. Laskowski J., £ysiak G., and Skonecki S., 2005.Mechanical
properties of granular agro-materials and food powders for industrial practice. Part II. Material properties in grinding and agglomeration. Centre of Excellence for Applied Physics in Sustainable Agriculture AGROPHYSICS. Institute of Agrophysics PAS, Lublin, Poland.
Laskowski J. and Skonecki S., 2001.Influence of material's temperature on compression parameters of ground barley grains. Int. Agrophysics, 15, 173-179.
Lordi N. G., Cocolas H., and Yamasaki H., 1997.Analytical interpretation of powder compaction during the loading phase. Powder Technol., 90, 173-178.
Michrafy A., Ringenbacher D., and Tchoreloff P., 2002. Model-ling the compaction behaviour of powders: application to pharmaceutical powders. Powder Technol., 127, 257-266. Molenda M. and Stasiak M., 2002. Determination of elastic
constants of cereal grain in uniaxial compression. Int. Agrophysics, 16, 61-65.
Molenda M., Stasiak M., Moya M., Ramirez A., Horabik J., and Ayuga F., 2006.Testing mechanical properties of food powders in two laboratories-degree of consistency of re-sults. Int. Agrophysics, 20, 37-45.
Obidziñski S., 2012.Pelletization process of postproduction plant waste. Int. Agrophys., 26, 279-284.
Paneli R. and Filho F.A., 2001.A study of a new phenomenolo-gical compacting equation. Powder Technol., 114, 255-261. Rolland S.A., Mosbah P., Gethin D.T., and Lewis R.W., 2012.
Lode dependency in the cold die powder compaction process. Powder Technol., 221, 123-136.
Sinka I.C., Cunningham J.C., and Zavaliangos A., 2003.The effect of wall friction in the compaction of pharmaceutical tablets with curved faces: a validation study of the Drucker-Prager Cap model. Powder Technol., 133, 33-43.
Skonecki S., 2004.Modeling of pressure compaction plant ma-terials (in Polish). Scientific Letters of Agricultural Univer-sity in Lublin, 279, 1-99.
Souriou D., Goeuriot P., Bonnefoy O., Thomas G., and Doré F., 2009.Influence of the formulation of an alumina powder on compaction. Powder Technol., 190, 152-159.
Wi¹cek J. and Molenda M., 2011.Moisture-dependent physical properties of rapeseed - experimental and DEM modeling. Int. Agrophys., 25, 59-65.