Relationship between moisture content and electrical impedance
of carrot slices during drying**
Ákos Kertész1, Zuzana Hlaváčová1*, Eszter Vozáry2, and Lenka Staroňová3 1Department of Physics, Slovak University of Agriculture in Nitra, Tr. A Hlinku 2, SK-949 76 Nitra, Slovakia 2Department of Physics and Control, Corvinus University of Budapest, Somlói út 14-16, H-1118 Budapest, Hungary 3Department of Production Engineering, Slovak University of Agriculture in Nitra, Tr. A. Hlinku 2, SK-949 76 Nitra, Slovakia
Received September 2, 2014; accepted December 15, 2014
*Corresponding author e-mail: zuzana.hlavacova@uniag.sk **This work was co-funded by the European Community under the project No 26220220180: Building the Research Centre AgroBioTech., 2013-2015.
A b s t r a c t. Electrical properties of food materials can give information about the inner structure and physiological state of biological tissues. Generally, the process of drying of fruits and vegetables is followed by weight loss. The aim of this study was to measure the impedance spectra of carrot slices during drying and to correlate impedance parameters to moisture content in different drying periods. Cylindrical slices were cut out from the carrot root along the axis. The slices were dried in a Venticell 111 air oven at 50°C. The weight of the slices was measured with a Denver SI-603 electronic analytical and precision balance. The weigh-ing of the samples was performed every 30 min at the beginnweigh-ing of drying and every 60 min after the process. The moisture con-tent of the samples was calculated on wet basis. The magnitude and phase angle of electrical impedance of the slices were mea- sured with HP 4284A and 4285A precision LCR meters in the frequency range from 30 Hz to 1 MHz and from 75 kHz to 30 MHz, respectively, at voltage 1 V. The impedance measurement was per- formed after weighting. The change in the magnitude of impe- dance during drying showed a good correlation with the change in the moisture content.
K e y w o r d s: carrot slice, drying, moisture content, electrical impedance spectroscopy, LCR meter
INTRODUCTION
Electrical properties of biological materials can give information about the inner structure and physiological sta- te of biological tissues. The requirements of the user indus-try in terms of the quality of purchased vegetables are growing. In addition, vegetables must meet national quality standards and obviously the rules of the European Union. Therefore, we need to constantly monitor and control their quality from producer to consumer. Alternatively, the
pos-sibility of carrot preservation can be enhanced by drying and subsequent storage. Drying operations are important steps in the food processing industry. Drying is one of the oldest methods of food preservation, and it represents a very important aspect of food processing. In this case, we need knowledge about thermophysical properties of mate-rials (Božiková and Hlaváč, 2013; Vozárová et al., 2011).
When studying the physical properties of tissue, it is necessary to consider its non-homogeneity from the mac-roscopic and micmac-roscopic points of view. When testing the electrical properties from the microscopic point of view, it is apparent that the interior of the cell is conductive because there is conductivity of ion type in the content of the organic and inorganic matter solutions. Cell membranes are not conductors. From the macroscopic point of view, it is possible to regard biological materials as non-homo-geneous semi-conductors or dielectrics. The density and structural arrangement of the cells therein and the proper-ties of each type of tissue influence the electrical properproper-ties of these materials. For porous materials, the following can be regarded as influential factors: the size and distribution of pores, porosity, and bulk density. Other factors are the temperature of the material, but the most significant is the influence of the presence of water, its uneven deployment in the material, different binding energy in each water bond in the material, and sorption properties (Hlaváčová, 2003). The electric properties of biological materials can be mea- sured by various methods and can be utilized in a wide range of disciplines and industries (Jha et al., 2011; Kovalyshyn et al., 2013; Miclaus and Morega, 2010; Paszkowski et al., 2014; Venkatesh and Raghavan, 2005).
In plant materials, dielectric measurements have been used for determining mechanical damage and biological changes in fruit or vegetable tissues. The results of these measurements may also be used for evaluating the qua- lity and physical state of fruit during ripening and storage (Bauchot et al., 2000; Harker and Maindonald, 1994).
Frequency, temperature, salt content, moisture content, and the state of moisture (frozen, free or bound) are the major factors that influence dielectric properties of agricul -tural and biological materials. Many studies on dielectric properties of vegetables and fruits have been reported for different frequency ranges, temperatures, and moisture contents (Garcia and Barret, 2002; Nelson, 2005).
Some authors studied also the dielectric properties of vegetable and fruit flour in relation to dielectric heating (Guo et al., 2010). Sosa-Morales et al. (2010) described dielectric properties of foodstuff, which have gained great importance and applications for food that are subjected to micro-wave or radio frequency (RF) heating treatments. Alfaifi et al. (2013), Marra et al. (2009), and Wang et al. (2010) described the use of RF treatments also at post-harvest dis-infestations and insect control in fruits and vegetables.
The instantaneous controlled pressure drop treatment is used for creation of a porous structure during the drying of fruits and vegetables. This treatment is based on high-tem-perature short-time heating followed by an abrupt pressure drop into a vacuum. Treated products exhibited slightly lower dielectric properties than raw products (Kristiawan et al., 2011). Information on the dielectric properties of com-modities and insect pests is needed in developing thermal treatments for post-harvest insect control based on radio frequency and microwave energy.
Many authors use mathematical models for describing the drying process. The effects of air temperature, air-flow rate, and sample thickness on the kinetics of drying of car-rot cubes were investigated by Doymaz (2004). The Page model gave better prediction than the Henderson and Pabis model and satisfactorily described the drying characteristics of carrot cubes. The drying of Maitake mushroom (Grifola frondosa), which has a high initial moisture content, was analyzed by Cao et al. (2003), who used the modified plate drying model. Results indicated that the model fitted rea -sonably well with experimental results for different drying conditions. To simulate the dynamics of soya bean thin-layer drying, a two-thin-layer grain model has been proposed by Khatchatourian (2012). The model consists of two ordi-nary differential equations and includes the influence of all studied parameters. The study of Birla et al. (2008) showed that dissimilarity in the peel and pulp dielectric properties greatly influenced the RF heating behaviour of fruits. They used a computer model, which was an effective tool in characterizing and explaining the heating patterns in fruits based on dielectric properties.
The experimental results of the moisture content of material undergoing microwave drying were in good agree-ment with the moisture content of a sample predicted by
the coupled mathematical model (Hemis et al., 2012). The three numerical methods used in the mathematical model for low-temperature natural-air drying allow the system of drying equations to be solved by Martinello et al. (2013). The comparison of models and methods for simulating the microwave heating of moist foodstuffs was described by Budd and Hill (2011).
The aim of this study was to determine the relationship between the impedance parameters and moisture content and moisture ratio of carrot slices during drying.
MATERIAL AND METHODS
Our experiments were done on carrots (Daucus carota L.) from a local market. The samples were stored in an open polyethylene bag in a refrigerator at 5-7°C. The samples were stored for a shorter period (ca. a day), or a longer period (ca. a week). At the beginning of each experiment, the carrots were washed and cut into cylindrical slices, which consisted of both the orange exterior and the yellow core, having variable dimensions, using a kitchen shear.
The carrot slices were dried in a Venticell 111 dryer at 50°C installed at the Department of Physics and Control, Corvinus University of Budapest. Since biological mate- rials can absorb humidity from the air, the samples were wrapped immediately after drying in a thin film to stabi -lize its moisture. Just before the measurement, the thin film was removed and the samples were weighted. The initial moisture content (wet basis) of carrots was about 87.5% (AOAC, 1990). The weight of the slices was mea- sured with a Denver SI-603 electronic analytical and preci- sion balance. The weighing of the samples was performed every 30 min at the beginning of drying (30, 60, 90 min) and afterwards every 60 min till 990 min. The moisture content of the samples was calculated on wet basis. The magnitude and phase angle of electrical impedance of the slices were measured with HP 4284A and 4285A precision LCR meters in the frequency range from 30 to 1 MHz and from 75 to 30 MHz, respectively, at voltage 1 V. A spe-cial electrode with clips hp16451 B dielectric test fixture, intended for the LCR meters hp4284A and hp4285A for measuring dielectric properties of materials, was used as a sensor. The dried slices of carrots were located between two plates of the dielectric test fixture. The impedance measurement was executed after weighing.
RESULTS AND DISCUSSION
In most studies carried out with drying, diffusion is gene- rally accepted to be the main mechanism during the trans-port of moisture to the surface to be evaporated. Moisture ratio is defined as:
.
0 e
e R uu uu M
− − =
(1)
where: MR is moisture ratio, u, u0 , and ue are local, initial, and equilibrium moisture contents, respectively.
The solution of Fick equation, with the assumptions of moisture migration being by diffusion, negligible shrink-age, constant diffusion coefficients, and temperature, and for a sphere:
. exp
1 6
1 2
2 2
2
2
∑
∞
=
− =
n
eff
R r
t D n n
M π π
(2)
where: r is radius (m), t is time (s), and Deff is effective dif-fusivity (m2 s-1).
The model of Henderson and Pabis is the first term of general series solution of Fick second law. Moisture ratio:
. exp
6
2 2
2
0
− =
− − =
r t D u
u u u
M eff
e e R
π π
(3)
Equation (3) can also be written in a more simplified form as:
(
t)
MR =kexp−c (4)
where: c is constant (s-1), k is constant (-).
Another widely applied empirical equation is the Page equation. The Page model has been widely advocated for thin-layer drying of solids under constant drying con-ditions. This model has produced good fits in predicting the drying of sweet potato, garlic, apricot, seedless grapes, and mint leaves (Doymaz, 2004; Sharma and Prasad, 2002). It is written in the following form:
(
N)
0
z
exp t
u u
u u M
e e
R − = −
−
= (5)
where: z is constant (s-N) and N is constant (-).
The values of the equilibrium moisture content, ue, are relatively low compared to u or u0. Thus (u – ue)/(u0 - ue) is simplified to u/u0 (Doymaz, 2004):
) c exp( k 0
t u
u
MR = = −
(6)
) z
exp( N
0
t u
u
MR= = − (7)
No constant rate-drying period was observed in any of the experiments of this study. The time of drying (from 0 to 990 min), weight of samples (Nos 1, 3, 5), and mois-ture ratio are given in Table 1. The moismois-ture ratio versus time of drying curves for the samples Nos 2, and 5 as in- fluenced by temperature 50°C are shown in Fig. 1. The effect of air temperature is reflected in the drying rate. At a temperature higher than 70°C, the dried product partially
T a b l e 1. Drying time, weight, and moisture ratio of samples Nos 1, 3, and 5 during drying at 50°C
Sample Slice 1 Slice 3 Slice 5
Drying time (min) Mass
(g) MR Mass(g) MR Mass(g) MR
0 7.888 1 8.195 1 7.985 1
30 7.019 0.878 7.266 0.874 7.115 0.879
60 6.305 0.778 6.481 0.768 6.392 0.779
90 5.600 0.679 5.712 0.665 5.589 0.668
150 4.423 0.514 4.453 0.495 4.350 0.496
210 3.460 0.379 3.399 0.353 3.347 0.358
270 2.871 0.297 2.802 0.272 2.742 0.274
990 0.821 0.010 0.865 0.011 0.861 0.014
Fig. 1. Drying time dependence of the moisture ratio for carrot slices Nos 2 – r, 5 – Ü.
,
,
.
lost its fresh product characteristics (Mulet et al., 1987). The moisture ratio decreased with the drying time, and after drying, the moisture content (w.b.) ranged from ca. 7 to 8%. As we can see, the change in the moisture ratio at the beginning of the drying period is significant, compared to the final stage of drying where very small changes in the moisture ratio were reported. These illustrated curves can be approximated by an exponential function:
t R
R M e
M c
0 −
= (8)
where MR0 is a reference value of the moisture ratio (-). The coefficients of regression equation Eq. (8) and the coefficient of determination are presented in Table 2. The values of the coefficient of determination range from 0.9865 to 0.9983. Our measurement confirmed the reliabil -ity of Eq. (6) for thin slices of carrot.
The moisture content ω versus time curves for the thin layers of carrots Nos 1, 2, 3, and 6 are shown in Fig. 2. These curves can be approximated with a polynomial (quadratic) function:
0
2 b
a ω
ω= t + t+ (9) where: a is constant (s-2), b is constant (s-1), and ω
0 is the reference value of the moisture content.
Comparing the curve shapes in Fig. 2, it can be seen that the curves have a similar time behaviour, and it is evi-dent that during drying the moisture content of the samples decreases. The coefficients of regression equation Eq. (9) and coefficient of determination are mentioned in Table 3. The coefficient of determination has high values, ie from 0.9986 to 0.9992.
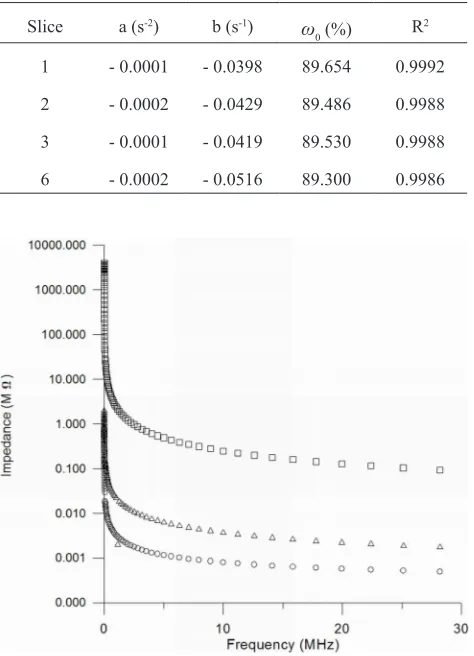
Figure 3 illustrates the frequency dependence of imped-ance for the samples of carrot slices Nos 21, 24, and 25. The samples were measured after different drying time; sample Nos 21, 24, and 25 was dried for 570, 630, and 1 440 min, respectively. The following charts are shown by the power function:
x
=
o o
f f Z
Z (10)
where: Z is impedance (Ω), Zo is the reference value of impedance (Ω), f is frequency (Hz), fo = 1 Hz, and x is con-stant (-).
T a b l e 2. Coefficient of regression equation Eq. (8) and coef
-ficients of determination
Slice MR0 c (s-1) R2
2 0.8637 - 0.0045 0.9865
5 0.9611 - 0.0043 0.9983
Fig. 2. Drying time dependence ofthe moisture content (w. b.) for samples Nos: 1 – u, 2 – ■, 3 – ▲, 6 – ●.
T a b l e 3. Coefficient of regression equation Eq. (9) and coef
-ficients of determination
Slice a (s-2) b (s-1) ω
0 (%) R
2
1 - 0.0001 - 0.0398 89.654 0.9992
2 - 0.0002 - 0.0429 89.486 0.9988
3 - 0.0001 - 0.0419 89.530 0.9988
6 - 0.0002 - 0.0516 89.300 0.9986
Fig. 3. Frequency dependence of impedance forslices Nos 21 – ○
Impedance depending on the frequency has a down ward tendency. The same dependence was found by Jha et al., (2011), and Vozáry and Kertész (2011). Table 4 contains
the coefficients of regression equation Eq. (10) and coef
-ficients of determination for the aforementioned samples. The coefficients of determination have high values. The displacement of the curves in Fig. 3 confirms that after
alonger time of drying the moisture content is lower and the frequency dependence of sample impedance is situated higher on the chart.
Figure 4 illustrates the frequency dependence of imped -ance for the sample of dried carrot slice No. 16 after drying for 660 and 780 min. The following charts are described
by the power function Eq. (10). The impedance of samples
with the same dimensions is increasing with the drying time
because the moisture content of the samples also
decreas-es with the drying time. In the final stage of drying, we recorded a very slight change in the values of the moisture
content of the samples. The impedance of these samples at this stage does not differ greatly from each other, as shown
in Fig. 4. Table 5 contains the coefficients of regression equation Eq. (10) and coefficients of determination.
CONCLUSIONS
Study of the most important characteristics (moisture content and moisture ratio) of carrot required for simulation and optimization of the drying process showed that:
1. The moisture ratio of the samples decreases with time.
2. Time dependence of the moisture ratio is valid for
thin slices of carrot.
3. During drying, the moisture content of the samples
decreases according to the polynomial (quadratic) function. 4. The impedance of the measured samples decreases in this frequency range according to the power function.
5. The impedance of carrot samples at the end of the
drying process reached higher values in comparison with
the beginning of drying when the samples had higher mois-ture content.
6. The coefficients of determination of all regression equations reached high values for all measured quantities
and samples.
7. The change of impedance in drying time showed cor-relation with the change in the moisture content.
REFERENCES
Alfaifi B., Wang S., Tang J., Rasco B., Sablani S., and Jiao Y., 2013. Radio frequency disinfestation treatments for dried
fruit: Dielectric properties. LWT – Food Sci. Technol.,
50(2), 746-754.
AOAC, 1990. Official Method of Analysis. Association of Official Analytical Chemists (AOAC), Washington, DC, USA.
Bauchot A.D., Harker F.R., and Arnold A.M., 2000. The using of electrical impedance spectroscopy to assess the
physio-logical condition of kiwifruit. Postharvest Biol. Technol.,
18, 9-18.
Birla S.L., Wang S., Tang J., and Tiwari G., 2008. Characteri-
zation of radio frequency heating of fresh fruits influenced by dielectric properties. J. Food Eng., 89, 4, 390-398.
Božiková M. and Hlaváč P., 2013. Thermophysical measure-ment methods and their usage for detection of selected food materials thermophysical parameters, Proc. 5th Int. Conf.
TAE, September 3-6,Prague, Czech Republic.
Budd C.J. and Hill A.D.C., 2011. A comparison of models and
methods for simulating the microwave heating of moist foodstuffs. Int. J. Heat and Mass Transfer, 54(4), 807-817.
Cao W., Nishiyama Y., and Koide S., 2003. Thin-layer drying of
Maitake mushroom analysed with a simplified model. Biosystems Eng., 85(3), 331-337.
Doymaz I., 2004. Convective air-drying characteristics of thin layer carrots. J. Food Eng., 61, 359-364.
Fig. 4. Frequency dependence of impedance for carrot slice No. 16 ○ – 660 min, □ – 780 min.
T a b l e 4. Coefficient of regression equation Eq. (10) and coef
-ficients of determination for samples Nos 21, 24, and 25
Sample Z0 (MΩ) x R2
Slice 21 – 570 min 20 - 0.6104 0.9820
Slice 24 – 630 min 30 - 0.5154 0.9621
Slice 25 – 1 440 min 400 000 - 0.8617 0.9706
T a b l e 5. Coefficient of regression equation Eq. (10) and coef
-ficients of determination for sample No. 16
Sample Z0 (MΩ) x R
2
Slice 16 – 660 min 300 000 - 0.926 0.9931
Slice 16 – 780 min 200 000 - 0.9056 0.9893
0.001
0 0.010 0.100 1 10
Impedance (M
Ω
)
Garcia E.L. and Barret D.M., 2002. Preservative treatments for fresh-cut fruits and vegetables. In: Fresh-cut fruits and vege- table. Science, Technology and Market (Ed. O. Lamikanra). CRC Press, Boca Raton, FL, USA.
Guo W., Wang S., Tiwari G., Johnson J.A., and Tang J., 2010. Temperature and moisture dependent dielectric properties
of legume flour associated with dielectric heating. LWT -
Food Sci. Technol., 43(2), 193-201.
Harker F.R. and Maindonald J.H., 1994. Ripening of nectarine fruit: changes in the cell wall, vacuole and membranes detected using electrical impedance measurement. Plant Physiol., 106, 165-171.
Hemis M., Choudhary R., and Watson D.G., 2012. A coupled mathematical model for simultaneous microwave and con-vective drying of wheat seeds. Biosys. Eng., 112, 202-209. Hlaváčová Z., 2003. Low frequency electric properties utilization in agriculture and food treatment. Res. Agr. Eng., 49(4), 125-136.
Jha S.N., Narsaiah K., Basediya A.L., Sharma R., Jaiswal P., Kumar R., and Bhardwaj R., 2011. Measurement tech-niques and application of electrical properties for non- destructive quality evaluation of foods – a review. J. Food Sci. Technol., 48(4), 387-411.
Khatchatourian O.A., 2012. Experimental study and mathemati-cal model for soya bean drying in thin layer. Biosys. Eng., 113, 54-64.
Kovalyshyn J., Shvets O.P., Grundas S., and Tys J., 2013. Use of the electro-separation method for improvement of the utility value of winter rapeseeds. Int. Agrophys., 27, 419-424.
Kristiawan M., Sobolik V., Klíma L., and Allaf K., 2011. Effect of expansion by instantaneous controlled pressure drop on dielectric properties of fruits and vegetables. J. Food Eng., 102(4), 361-368.
Marra F., Zhang L., and Lyng J.G., 2009. Radio frequency treatment of foods: Review of recent advances. J. Food Eng., 91(4), 497-508.
Martinello M.A., Muñoz D.J, and Giner S.A., 2013. Mathema- tical modelling of low temperature drying of maize: Comparison of numerical methods for solving the differen-tial equations. Biosys. Eng., 114, 187-194.
Miclaus S. and Morega M., 2010. Characterisation of the elec-tromagnetic environment in a TEM cell for exposure of small biological samples in the UHF band. Romanian J. Physics, 55(1-2), 195-204.
Mulet A., Berna A., Borras M., and Pinaga F., 1987. Effect of
air flow rate on carrot drying. Drying Technol., 5(2),
245-258.
Nelson S.O., 2005. Dielectric spectroscopy in agriculture. J. Non-Crystalline Solids, 351(33-36), 2940-2944.
Paszkowski B., Wilczek A., Szypłowska A., Nakonieczna A., and Skierucha W., 2014. A low-frequency sensor for determination of honey electrical properties in varying tem-perature conditions. J. Food Eng., 138, 17-22.
Sharma G.P. and Prasad S., 2002. Dielectric properties of garlic (Allium sativum L.) at 2450 MHz as function of tempera-ture and moistempera-ture content. J. Food Eng., 52(4), 343-348. Sosa-Morales M.E., Valerio-Junco L., López-Malo A., and
García H.S., 2010. Dielectric properties of foods: Reported data in the 21st century and their potential applications. LWT – Food Sci. Technol., 43(8), 1169-1179.
Venkatesh M.S. and Raghavan G.S.V., 2005. An overview of dielectric properties measuring techniques. Canadian Biosys. Eng., 47, 7.15-7.30.
Vozárová V., Hlaváčová Z., and Tkáč Z., 2011. Methods for moisture content, electrical properties and thermal beha-
viour of food materials investigation. Scientific Monograph
Modern Methods of Agricultural Raw Materials Analysis (Eds G. Bartosz, C. Puchalski), Rzeszów, University of Rzeszów, Poland.
Vozáry E. and Kertész Á., 2011. Impedance parameters of carrot slices during drying. Proc. 9th Int. Conf. Electromagnetic Wave Interaction with Water and Moist Substances ISEMA, May 31 - June 3, Kansas City, MI, USA.