March, 2020 AgricEngInt: CIGR Journal Open access at http://www.cigrjournal.org Vol. 22, No. 1 9
A simulated effect of wetting and drying periods for two textural
soils amended with biochar at a catchment scale
Karolina Villagra-Mendoza
1*, Dorian Carvajal-Vanegas
2, Steffen Beck-Broichsitter
3,
Rainer Horn
3(1. School of Agricultural Engineering, Instituto Tecnológico de Costa Rica, 159-7050 Cartago, Costa Rica;2. School of Forestry, Instituto Tecnológico de Costa Rica, 159-7050 Cartago, Costa Rica;3. Institute for Plant Nutrition and Soil Science, Christian-Albrechts University Kiel,
Hermann Rodewaldstr. 2, 24118 Kiel, Germany)
Abstract: Biochar is considered as an option to ameliorate soil functions, by improving soil physical and hydraulic soil properties. This study investigated the effect of biochar and of wetting and drying cycles on the water infiltration at laboratory and at a hypothetical watershed scenario. In the laboratory, test samples with 2.5% and 5% (by dry mass) of a mango-wood biochar were added to a sandy and sandy loam soil material. Cumulative infiltration was determined after simulated intense wetting and drying cycles, by drying the samples at 30°C for three consecutive days. Additionally, biochar amended soil hydraulic parameters, obtained at the laboratory, were used to simulate the water discharge of a hypothetical watershed, with the Soil and Water Assessment Tool (SWAT). It was established that biochar addition and repeated wetting and drying cycles decreased cumulative infiltration and enhanced soil rigidity. At watershed scale, pore size distribution, in terms of hydraulic conductivity, played a key role to predict surface runoff and subsurface flow under fully and partially saturated conditions. These results contribute to understand better the effect of biochar amendments as a soil conservation management option on the watershed hydrology.
Keywords: infiltration, watershed, biochar, surface runoff, wetting, drying
Citation: Villagra-Mendoza,K., D. Carvajal-Vanegas, S. Beck-Broichsitter, and R. Horn. 2020. A simulated effect of wetting and drying periods for two textural soils amended with biochar at a catchment scale. Agricultural Engineering International: CIGR Journal, 22 (1):9-21.
1 Introduction
Changes in the distribution, frequency and intensity of rainfall in combination with intensified soil degradation become a challenge to look for new forms of water management locally and at macro scale level. In agriculture, there is a need to look for new irrigation system
Received date: 2019-01-04 Accepted date: 2019-10-06 *
Corresponding author: Karolina Villagra-Mendoza, Associate Professor of Department of Agricultural Engineering, Instituto Tecnológico de Costa Rica, 30101 Costa Rica. Email:
kvillagra@tec.ac.cr. Tel: +506-2550-2876, Fax: +506-2550-2271.
designs able to supply the crop water needs using less amount of water. On the other hand, drainage systems must be able to evacuate water properly under water excess and retain it under water scarcity. Regarding water scarcity, biochar has shown to enhance soil physicochemical and hydraulic characteristics (Abel et al., 2013; Ajayi et al., 2016) that may ameliorate soil water retention, nutrient and pollutant lixiviation and water transmissivity under adverse weather conditions.
Infiltration is an important function of the soil and acts as a control mechanism for surface runoff and groundwater recharge. Two forces matric as well as gravitational
10 March, 2020 AgricEngInt: CIGR Journal Open access at http://www.cigrjournal.org Vol. 22, No. 1
potentials– are in charge of moving the water flux from the surface into the soil profile. These forces produce, besides a downward movement, an upward and lateral movement (Baver et al., 1972) depending on the topographical conditions and the given anisotropy of the hydraulic functions. Initially, the water infiltration is high. When the soil is initially dry the hydraulic gradient as the sum of matric and gravitational potential dominates. At this stage, water infiltrates into the soil by capillary attraction as well as being pulled down by gravity but it fades off with time until it reaches a steady rate. As water penetrates deeper, it moves as a wetting front through the soil profile, the matric potential gradient decreases and the gravitational gradient becomes the only force that moves the water downward (Hillel, 1998; Jury and Horton, 2004). At this moment the flux tends to approach the hydraulic conductivity as a limiting value and the slope of the infiltration curve becomes flat. This steady condition is considered the maximum depth of water that can infiltrate the soil in a unit of time (Hillel, 1998). In the unsaturated zone, besides the main forces capillary and gravitational there are different mechanisms like absorption that helps to bind the water molecules to the soil bulk reducing the drainage of water into deeper layers.
Infiltration is influenced by many factors. Rainfall intensity and amount, drop diameter and drop size distribution may induce surface sealing, especially due to the raindrop impact, reducing permeability and slowing down infiltration (Assouline and Mualem, 1997). Soil texture, organic matter, structure and initial soil moisture content may alter the velocity at which infiltration occurs. Coarse soil textures are associated with high infiltration rates due to their larger pores and clay-rich soils are associated with lower infiltration (Chartier et al., 2011). For instance, studies such as from Adeniji et al. (2013) associated the soil fine fraction (< 500 µm) as a key factor to estimate infiltration. The latter soils however can also have a very high infiltration rate if they are well structured and if they have continuous coarse pores in the vertical direction. Organic matter, swell shrink processes amongst
others, all enhance soil structure and its strength and provide pores that are important for infiltration and water retention (Bens et al., 2007). High initial soil moisture may cause an early constant infiltration rate (Hillel, 1998). Vegetation stabilizes soil aggregates and is associated to nutrient conservation which is a positive effect for infiltration (Chartier et al., 2011). Finally, management practices such as tillage vary the composition of the top soil (Adeniji et al., 2013) enabling preferential flow (Hillel, 1998) or destroying macro pores (Nimmo, 2004) reducing water transmissivity.
Pore characteristics such as pore size distribution and connectivity, hydraulic conductivity and sorptivity are the most important parameters that influence infiltration capacity (Elrick and Reynolds, 1992; Jačka et al., 2016). Pore connectivity plays a key role by enabling the infiltrated water and solutes to reach deeper soil depths (Bens et al., 2007). Soils with high saturated hydraulic conductivity are associated with high infiltration rates (Hillel, 1998). Soil water repellency may delay initial infiltration rates with a later increase over time, due to air entrapment and flow instabilities (Bens et al., 2007; Carrick et al., 2011; and Dohnal et al., 2009).
Repetitive wetting and drying (WD) facilitate the formation of preferential flow paths (Peng et al., 2007) making the soil matrix sensitive to soil deformation and changing the configuration of structural pores which affect the transport of water and air (Dörner, 2005).
March, 2020 A simulated effect of wetting and drying periods for two textural soils Vol. 22, No. 1 11
holding capacity or increasing infiltration capacity of the top soil. Hardie et al. (2011) and Doerr and Thomas (2000) suggested that hydrophobic soils affected the soil hydrology by producing a lower response in time to infiltration and accelerating time to runoff generation. Li et al. (2017) agreed on the benefits of agricultural and forest residues, in the form of biochar, on the decrease of surface runoff and its time of occurrence. Abrol et al. (2016) demonstrated that biochar is also useful as a soil conservation measure by ameliorating infiltration and controlling soil erosion.
Although many studies have pointed out the positive effects of biochar amendments on soil hydrology it still remains unclear what is the potential contribution of biochar as an agricultural management practice, especially under extreme weather conditions. The objective of this study is to investigate the effect of simulated WD on a hypothetical watershed assuming that the agricultural land is managed with only biochar application as an option for soil conservation. For the modeling of these hypothetical scenarios the soil hydraulic parameters of different biochar amendments, obtained at laboratory scale, were used as input parameters.
2 Material and methods
The present study was carried out in two parts: 1) Determining the water infiltration behavior at laboratory scale for different soil amendments applying simulated WD cycles; and 2) Evaluating a hypothetical watershed hydrological response, assuming the soil hydraulic parameters obtained at the laboratory scale for the same six
biochar amendment treatments.
2.1 Measurement of infiltration at laboratory scale
For the sampling preparation material from the A– horizon of two soils were used: a medium sand (S) from a Podsol derived from sandy outwash (99% sand) and a sandy loam (54% sand, 13% clay and 33% silt) from a stagnic Luvisol derived from glacial till (SL) collected in Schleswig-Holstein, in the northern part of Germany. The soil materials were air dried, homogenized and passed through a 2 mm sieve. As biochar, we added a pyrolyzed mango wood (600°C), with a mean particle size of 63 µm. at rates of 2.5% and 5% by dry mass. Six treatments were studied: S0 (control), S2.5 (sand + 2.5% biochar), S5 (sand + 5% biochar), SL0 (control), SL2.5 (sandy loam + 2.5% biochar) and SL5 (sandy loam + 5% biochar).
Soil cores of 100 cm3 with the homogenized soil were compacted to obtain average soil densities of 1.51 g cm-3 for the sandy mixtures and 1.39 g cm-3 for the loamy sand. Each treatment was prepared with three replicates. Infiltration capacity was first measured after sampling preparation (WD0), then oven-dried at 30°C for 72 h. Thereafter, infiltration capacity was measured again followed by an oven-dry period at 30°C for 72 h (WD1, WD2 WD3 and WD4). After each drying period, height changes were registered in order to quantify changes in bulk density. Moreover, weight of each sample was obtained to determine the initial soil water content. The sequence used for each WD cycle is depicted in Figure 1. All infiltration tests were performed under similar initial moisture conditions (~2 vol%). A WD cycle consisted of saturation during infiltration and thereafter oven-dry at 30°C for 72 h.
12 March, 2020 AgricEngInt: CIGR Journal Open access at http://www.cigrjournal.org Vol. 22, No. 1
Infiltration rate was measured with a disk infiltrometer with an internal diameter (Øi) of 23 mm. Time and water volume changes in the graduated disk infiltrometer were registered until volume changes reached a steady flow.
2.2 Macroscale modeling scenario with biochar
amendments
2.2.1 Set of the geometry of the watershed
The geometry of the hypothetical macroscale scenarios was determined based on an elongated and sub-catchment
and youthful sub-catchment. The area of the watershed was set to 83.5 km2 and occupied by 30% agriculture (crops) 39% cattle raising (grass land), 27% forest and 4% other uses such as residential areas and roads (Figure 2). It was assumed an average hillslope of 17% and a drainage system of order 4. With these characteristics we built a catchment with a quick response to rain events. Average annual precipitation was set to 2325 mm, a mean daily temperature value of 13°C and an average relative humidity of 88%.
(a) drainage system (b) landuse map (c) digital elevation model Figure 2 Hypothetical watershed
2.2.2 Modelling main input parameters
The Soil and Water Assessment Tool (SWAT) version 1.5 (Dile et al., 2016) was used to model the catchment hydrology and to obtain the differences in surface runoff and water discharge at the outlet, for each treatment studied. SWAT is a physically based, long term yield model; and is used to predict the impact of land management practices on water, sediment and chemical yields (Neitsch et al., 2009).
Six scenarios were identified, sharing the same climate and land use data and differentiating only on the soil input
data (biochar amendments) for the areas occupied by Crops and Grassland, while in the other land use types (forest, residential and roads) soils were not amended with biochar. Thus, for these specific land use types six different soil conditions were set (based on the treatment sets for this study in Section 2.1) S0, S2.5, S5, SL0, SL2.5 and SL5. Six output scenarios, in terms of water discharge and surface runoff volume were obtained and discussed. Table 1 shows the main input model parameters based on the laboratory tests for layer 1 of the land use Crops and Grassland.
Table 1 Input model parameters, based on laboratory experiments, used to model the hydrological response of a hypothetical watershed
Land use
type Layer Soil depth Treatment
Hydrological
group (CN) Ksat ρd AWC
Biochar amount
cm mm h-1 g cm-3 % ton ha-1
Crops and Grassland
1 30
S0
A
613.33 1.50 30.00 -
S2.5 143.33 1.50 53.00 112
S5 70.00 1.50 69.83 225
SL0
B
14.56 1.37 97.57 -
S2.5 9.63 1.37 103.30 102
SL5 5.28 1.36 108.87 204
2 70
Clay loam 3.75 1.60 43.33
3 120 2.64 1.60 62.00
March, 2020 A simulated effect of wetting and drying periods for two textural soils Vol. 22, No. 1 13
Forest
1 30
A,B
16.88 1.05 55.50
2 100 4.17 1.45 90.15
3 133 4.48 1.65 42.09
Residential and roads
1 16
C,D
6.08 1.75 18.11
2 46 2.21 1.80 32.68
3 78 3.33 1.75 35.53
Note: CN: curve number; Ksat: saturated hydraulic conductivity; ρd: bulk density; AWC: available water content.
3 Results
3.1 Effect of wetting and drying (WD) cycles on water
infiltration
Table 2 shows the cumulative infiltration at 45 minutes for all treatments, after applying the simulated (oven-dry) WD cycles. In all treatments, cumulative infiltration (Icum) decreased as the biochar dosage increased. Data of Icum for the unamended sand (S0) is not shown in this
table, since the infiltration test ran in a time shorter than 45 minutes. However, data from a shorter time (not shown in this paper) confirmed the same Icum and pattern. For a same treatment, as the WD cycle was applied, Icum tended, in all cases, to decrease. In the sandy treatments (S) the changes were more significant than in the sandy loam treatments (SL).
Table 2 Cumulative infiltration (cm) at 45 minutes for all treatments after applying different wetting and drying periods
Treatment Wetting and Drying Period (WD)
0 1 2 4
S0 ND. ND. ND. ND.
S2.5 32.72 ± 4.81 24.10 ± 1.68 18.38 ± 0.24 16.38 ± 4.57
S5 14.51 ± 2.46 12.50 ± 0.87 11.86 ± 0.16 11.01 ± 0.83
SL0 17.38 ± 1.14 13.52 ± 2.70 13.18 ± 0.59 12.45 ± 0.51
SL2.5 13.32 ± 1.10 10.64 ± 0.61 11.16 ± 0.62 10.34 ± 1.22
SL5 10.38 ± 0.28 9.63 ± 0.07 9.77 ± 0.31 9.59 ± 0.22
Note: S: sand; SL: sandy loam; ND.: not determined.
Table 3 presents the effect of the simulated WD cycles on the bulk density. As the WD cycles occurred, bulk density increased considerably in the unamended sand (S0) whereas in the sandy mixtures (S2.5 and S5) the opposite occurred. As biochar dosage increased, it was determined, by visual observation, that the amendments were able to swell during wetting (reducing bulk density) and during drying, the amendments did not shrink enough to produce the opposite effect. Thus, the net bulk density, of the sandy mixtures, along the WD cycles, tended to decrease but not
considerably. In the sandy loam mixtures (SL), bulk density did not vary as significantly as in the sandy mixtures and it oscillated along the different WD cycles.
Although bulk density decreased (especially in the sandy treatments) as the WD cycles occurred, cumulative infiltration decreased, too. Initial soil moisture was kept constant, about 2 vol%, for all treatments along the WD cycles, with the exception of WD0, which corresponded to the soil moisture content before applying any wetting/drying condition.
Table 3 Bulk density (ρd) and soil water content (θ) on the sandy (S) and sandy loam (SL) mixtures after each wetting and drying cycle (from Villagra-Mendoza and Horn, 2019)
Treatment Wetting/Drying Cycle (WD)
WD0 WD1 WD2 WD4
ρd θ ρd Θ ρd θ ρd θ
S0 1.55 1.3±0.54 1.54±0.03 1.1±0.45 1.61±0.07 1.2±0.46 1.71 1.0±0.43
S2.5 1.52±0.03 2.0±1.32 1.49±0.03 1.7±1.14 1.47±0.03 1.1±0.31 1.48 0.7±0.07
S5 1.48±0.01 1.7±0.31 1.46±0.02 1.1±0.28 1.46±0.02 1.1±0.21 1.43 0.8±0.09
SL0 1.38±0.02 4.6±0.72 1.36±0.02 1.8±0.10 1.37±0.01 2.1±0.17 1.38 1.9±0.05
SL2.5 1.40±0.05 5.5±0.86 1.39±0.06 1.9±0.04 1.38±0.05 2.4±0.12 1.35 1.6±0.08
SL5 1.40±0.04 5.2±0.79 1.36±0.05 1.9±0.11 1.35±0.02 2.3±0.11 1.37 1.9±0.07
14 March, 2020 AgricEngInt: CIGR Journal Open access at http://www.cigrjournal.org Vol. 22, No. 1
3.2 Hydrological response of a catchment with
different biochar dosages
Because SWAT is a long-term hydrological model, the simulations referred to the response of the catchment to daily and monthly cumulative precipitation. Figure 3 illustrates the time series of the water discharge at the outlet of the model catchment for a period of 7 years. It is observed that the dry-season events (from November to April) produced significant smaller runoff peaks than the rainy-season events (from May to October). Figure 3a shows the time series of the water discharge (Q) for the
sandy amendments (S) and Figure 3b the time series corresponding to the sandy loam amendments (SL). The high peaks occurred during the rainy season and the low outflows during the dry season. For the sandy (Figure 3a) and sandy loam mixtures (Figure 3b) the catchment had the same water discharge shape, but the magnitude of Q varied, occurring a higher discharge in the sandy mixtures (S), mainly during the rainy season. Four high peaks during the rainy season (numbered from 1 to 4) and three low outflows during the dry season (numbered from 5 to 7) were chosen to compare the flow patterns.
(a) water discharge of the sandy treatments (b) water discharge of the sandy loam treatments
Figure 3 Simulated water discharge (Q) applying six scenarios (S0, S2.5, S5, SL0, SL2.5 and SL5) for the land occupied by Crops and Grassland
The circled high and low peaks are taken as examples for further analysis in Figure 4 and 5. Figure 4 shows the four examples of high peaks corresponding to the sandy mixtures (left) and sandy loam mixtures (right), during the rainy season (these discharge peaks are labeled as 1 to 4 in Figure 3). The unamended soils (S0 and SL0) had the highest discharge peaks with respect to their amendments. The sandy loam mixtures (SL) showed lower outflow peaks in comparison with the sandy treatments (S) for the same
rainfall conditions. The sandy loam mixtures produced, on average, 10% less discharge (Q) than the sandy mixtures at the peak discharge events during the rainy season. This suggests that the sandy loam (SL) substrates were able to retain more water in the soil and transport less water within the soil bulk than the sandy (S) amendments, although they produced in general more surface runoff (Table 4). In the sandy treatments, the water discharge differences between the unamended sand (S0) and the amendments (S2.5 and
a)
March, 2020 A simulated effect of wetting and drying periods for two textural soils Vol. 22, No. 1 15
S5) were more significant than the differences between the unamended sandy loam (SL0) and the sandy loam amendments (SL2.5 and SL5). Treatments S2.5 and S5 generated up to 7% and 20%, respectively, less water
discharge than the unamended sand, whereas, SL2.5 and SL5 produced up to 6% and 12% less water discharge than the unamended sandy loam (SL0).
(a) high peaks of water discharge of the sandy mixtures (S) (b) high peaks of the water discharge of the sandy loam mixtures (SL) Figure 4 Comparison of four high outflow peaks Q for six scenarios (S0, S2.5, S5, SL0, SL2.5 and SL5) during the rainy season, for the land
occupied by Crops and Grassland. Numbers follow the order in Figure 3
During the dry season (Figure 5), contrarily to the rainy season, the low outflows were higher in the sandy loam amendments (SL) than in the sandy treatments (S). On average, in the dry season the sandy loam mixtures (SL)
generated 21%, 18% and 14% more discharge with respect to the unamended sand (S0), and the sandy amendments with 2.5 (S2.5) and 5% (S5) biochar, respectively. This suggests that during the dry season, although precipitation
1a
1b
2a
2b
3a
3b
16 March, 2020 AgricEngInt: CIGR Journal Open access at http://www.cigrjournal.org Vol. 22, No. 1
is low, the sandy loam mixtures continue contributing to the drainage system greater than the sandy amendments.
(a) low outflow of the sandy mixtures (S) (b) low outflow of the sandy loam mixtures (SL)
Figure 5 Comparison of four low outflow peaks Q for six scenarios (S0, S2.5, S5, SL0, SL2.5 and SL5) during the dry season, for the land occupied by Crops and Grassland. Note: Numbers follow the order in Figure 3
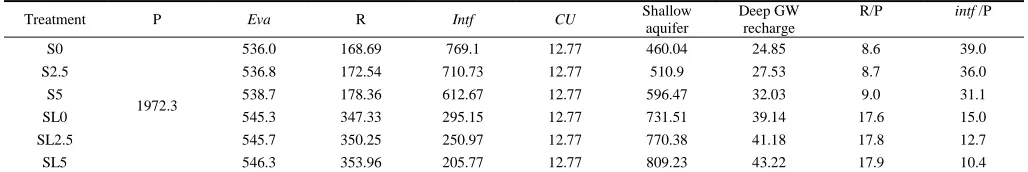
Table 4 provides the average output values of the 1-D water balance parameters for the six soil scenarios. In overall, the sandy loam (SL) treatments produced more surface runoff than the sandy (S) treatments, whereas interflow (sub surface flow) was higher in the sandy treatments. The runoff coefficient (ratio of surface runoff
volume with respect to precipitation) was higher for the sandy loam mixtures (SL) reflecting high soil moisture conditions, whereas the interflow coefficient (ratio of interflow with respect to precipitation) was double the higher in the sandy treatments (S) than in the sandy loam substrates (SL). In average, the sandy substrates (S)
1a
1b
2a
2b
March, 2020 A simulated effect of wetting and drying periods for two textural soils Vol. 22, No. 1 17
produced between 40% and 47% surface runoff volume from the total precipitation, whereas the sandy loam
mixtures (SL) produced between 28% and 33%.
Table 4 One-dimensional soil balance parameter values obtained from the simulated hydrological cycle using SWAT model, for six scenarios
Treatment P Eva R Intf CU Shallow
aquifer
Deep GW recharge
R/P intf /P
S0
1972.3
536.0 168.69 769.1 12.77 460.04 24.85 8.6 39.0
S2.5 536.8 172.54 710.73 12.77 510.9 27.53 8.7 36.0
S5 538.7 178.36 612.67 12.77 596.47 32.03 9.0 31.1
SL0 545.3 347.33 295.15 12.77 731.51 39.14 17.6 15.0
SL2.5 545.7 350.25 250.97 12.77 770.38 41.18 17.8 12.7
SL5 546.3 353.96 205.77 12.77 809.23 43.22 17.9 10.4
Note: P: precipitation; Eva: evapotranspiration; R: surface runoff; intf: interflow CU: capillary uprise; GW: groundwater. All parameters are in mm. R/P: runoff coefficient (%);intf /P: interflow coefficient (%).
4 Discussion
4.1 Effect of wetting and drying cycles on water
infiltration
Bulk density and cumulative infiltration decreased for all treatments, except for S0. Usually, these two parameters show an opposite trend; however, bulk density as a capacity parameter may not be sufficient to explain the infiltration behavior (intensity parameter) and may lead to misunderstanding of the real mechanisms influencing water infiltration. If only bulk density is considered, only the changes on the mass per volume would be included, but not the effect of the connectivity nor the distribution of the pores that may also influence the water transmissivity within the bulk soil (Horn and Kutilek, 2009). Under these circumstances, intensity parameters such as hydraulic conductivity may explain better the decrease of Icum over time. Saturated hydraulic conductivity values of the treatments studied for the different WD cycles (Villagra-Mendoza and Horn, 2018a) proved the pattern ofIcum, where a decrease of saturated hydraulic conductivity (Ksat), due to blockage of pores by biochar particles (Esmaeelnejad et al., 2016; Masiello et al., 2014; and Novak et al., 2016), may cause a decrease of water infiltration, too. Porosity and the pore size distribution might have influenced the decrease ofIcum. Larger pores in the unamended sand (S0) were able to transport more water than narrow and medium pores, which were more frequent in the amended sandy soils and sandy loam mixtures (Villagra-Mendoza and Horn, 2018a) and the more frequent the narrow pores the lower the saturated hydraulic
conductivity was and the lower the cumulative infiltration. These results partially agree with findings of Ayodele et al. (2009) that reported that cumulative infiltration increased with a decreased bulk density, increased total porosity, sand fraction and saturated hydraulic conductivity. These findings are also contrary to the observations by Novak et al. (2016) of a packed sandy loam soil where biochar addition (pine chips) improved water infiltration but decreased after several infiltration events. It was suggested that water infiltration was affected by bulk density changes. Githinji (2014) concluded that an increasing rate of biochar application produced a decreasing trend of cumulative infiltration in a sandy loam soil, and attributed this trend to biochar hydrophobicity. It was observed a linear decrease of Ksat with increasing biochar dosage, which also caused the reduction of the cumulative infiltration. Brockhoff et al. (2010) also described the decrease of Ksat as biochar dosage increased on a coarse-textured soil.
Wetting and drying cycles may also alter Ksat by changing the soil pore size distribution. Larger pores, in the unamended sandy soil, were more sensitive to deformation as shrinkage occurred and biochar ameliorated pore rigidity of the sand amendments. Soil rigidity may be interpreted as an enhancement of soil aggregation or greater void ratio values by means of narrower pores (Bodner et al., 2013; Horn et al., 2017; and Zong et al., 2014). The latter would be the result of macro pore instabilities, which decrease the ability of soil to transport water under saturated soil conditions. Ajayi et al. (2016) noted that in a sandy soil,
18 March, 2020 AgricEngInt: CIGR Journal Open access at http://www.cigrjournal.org Vol. 22, No. 1
number of WD cycles increased, attributing it to a micro-structural collapse of the soil bulk. Peng et al. (2007) reported that continuous intense WD cycles tended to decrease the void radio of organic-rich soils, while in inorganic soils the void ratio increased. Zhao et al. (2015) observed that infiltration rate oscillated with different wet-dry cycles. It was reasoned that changes on macro porosity and near-saturated hydraulic conductivity were responsible for the same oscillation trend of water infiltration.
4.2 Effect of biochar amendments on the watershed
hydrology
The unamended soils (S0 and SL0) discharged a higher water volume (Q) than the amended soils, with an increasing surface runoff and a decreasing subsurface flow (interflow) as biochar dosage increased. The increasing surface runoff was due to the decrease of the water infiltration as the biochar dosage increased. The processes behind these phenomena can be explained both by the reduced pore diameter due to the added biochar as well as by the increased water saturation or stronger menisci forces due to the smaller pore diameter (Hartge and Horn, 2016). Zhang and Hartge (1995) carried out infilling experiments and could prove the more pronounced strength but also altered water uptake rates. Thus, this study confirms the results of an increased field capacity and the range of the air entry value (Villagra-Mendoza and Horn, 2018b).
The decrease of interflow with the biochar addition may be related to the decrease of saturated hydraulic conductivity in the amendments. These results agree with findings of Lee et al. (2015) that observed a significant increase of runoff on biochar soil amendments compared to the unamended treatments. Others, such as Hamidreza et al. (2016) reported an amelioration of water infiltration in biochar amendments. Thus, the controversy results concerning the infiltration behavior maybe attributed and explained by the ageing effects for soils amended with biochar and the formation of soil aggregates which changes the infiltration capacity.
Under soil saturation conditions during the rainy season, the sandy loam mixtures (SL) showed less water discharge (Q) than the sandy mixtures (S). The runoff coefficient
(R/P) of the sandy loam treatments was higher than the coefficient of the sandy mixtures (S). In contrast, the interflow coefficient, in the sandy substrates, was approximately two times higher than the interflow coefficient of the sandy loam materials. This is explained by the effect of a multidimensional flow in the subsurface hillslope under in situ conditions, and a higher hydraulic conductivity in the sandy mixtures due to a greater amount of wider pores than in the sandy loam substrates (Villagra-Mendoza and Horn, 2018a). These findings also agree with observations of Imhoff and Akbar (2017), that reported a decrease of saturated hydraulic conductivity in an amended silt loam (30%) and sandy loam (54%) and an increase in a loamy sand (17%). They associated it with changes on the inter-pore volume, because small biochar particles filled the large pores between the sand particles, increasing the portion of finer pores.
Under partially saturated soil conditions (dry season) the sandy loam mixtures generated more water discharge (Q) than the sandy mixtures. When the soil is not completely dry the movement of water in the sandy loam is higher than in the sandy mixtures. This may be due to the higher available water content and more formation of narrow and medium pores in the sandy loam mixtures that increased the unsaturated hydraulic conductivity, enhancing the water flux under unsaturated soil conditions. After drainage of large pores and inter-particle pores occurs, water is retained in small pores and biochar intra-particle pore spaces. Thus, biochar increases water retention in the capillary region, which enhances the water transport under partially saturated soil conditions (Imhoff and Akbar, 2017). The more narrow and medium pores are formed due to biochar addition, the higher the unsaturated hydraulic conductivity (Villagra-Mendoza and Horn, 2018b). Imhoff and Akbar (2017) observed that when soil was not fully saturated, the unsaturated hydraulic conductivity was higher, due to an increase of the available water content in the loamy sand (70%) and sandy loam (20%), resulting in a less surface runoff.
March, 2020 A simulated effect of wetting and drying periods for two textural soils Vol. 22, No. 1 19
1. Cumulative infiltration is not ameliorated with repetitive wetting and drying cycles.
2. The increase on unsaturated hydraulic conductivity of the amendments enhances the water transport during dry periods, although cumulative infiltration decreases.
3. Under dry soil conditions, biochar amendments are able to transport more water than the unamended soils, due to their higher unsaturated hydraulic conductivity.
4. Biochar amendment, as an option for soil conservation management, may help to improve water soil capacity under long dry conditions.
Acknowledgments
The first author is grateful to the Institute of Plant Nutrition and Soil Science of the Christian Albrechts Universität zu Kiel for giving her the space to carry out the experimental work, to the IPSWaT Program supported by the Ministry of Education and Research (BMBF) of Germany for the financial aid, and to the Academic Affairs Vice-presidency of the Costa Rica Institute of Technology (Instituto Tecnológico de Costa Rica) for the partial financial support. Special thanks to Fernando Watson for the map preprocessing.
References
Abel, S., A. Peters, S. Trinks, H. Schonsky, M. Facklam, and G. Wessolek. 2013. Impact of biochar and hydrochar addition on water retention and water repellency of sandy soil. Geoderma, 202-203: 183-191.
Abrol, V., M. Ben-Hur, F. G. A. Verheijen, J. J. Keizer, M. A. S. Martins, H. Tenaw, L. Tchehanskyand, and E. R. Graber. 2016. Biochar effects on soil water infiltration and erosion under seal formation conditions: rainfall simulation experiment. Journal of
Soils and Sediments, 16(12): 2709-2719.
Adeniji, F. A., B. G. Umara, J. M. Dibal, and A. A. Amali. 2013. Variation of infiltration rates with soil texture.
International Journal of Engineering and Technology
Innovation, 3(2): 454–459.
Ajayi, A. E., D. Holthusen, and R. Horn. 2016. Changes in
microstructural behaviour and hydraulic functions of biochar amended soils. Soil and Tillage Research,
155(1): 166-175.
Ajayi, A. E., and R. Horn. 2016. Modification of chemical and hydrophysical properties of two texturally differentiated soils due to varying magnitudes of added biochar. Soil and Tillage Research, 164(1): 34– 44.
Assouline, S., and Y. Mualem. 1997. Modeling the dynamics of seal formation and its effect on infiltration as related to soil and rainfall characteristics. Water Resource Research, 33(7): 1527-1536.
Ayodele, A., P. Oguntunde, A. Joseph, and M. D. S. D. Junios. 2009. Numerical analysis of the impact of charcoal production on soil hydrological behavior, runoff response and erosion susceptibility. Revista
Brasileira de Ciência do Solo, 33(1): 137-145.
Baver, L. D., W. H. Gardner, and W. R. Gardner. 1972. Soil
Physics, 4th ed. USA: John Wiley & Sons.
Bens, O., N. A. Wahl, H. Fisher, and R. F. Hüttl. 2007. Water infiltration and hydraulic conductivity in sandy cambisols: impacts of forest transformation on soil hydrological properties. European Journal of Forest
Research, 126(1): 101-109.
Bodner, G., P. Scholl, and H. Kaul. 2013. Field
quantification of wetting-drying cycles to predict temporal changes of soil pore size distribution. Soil Tillage
Research, 133(1): 1-9.
Brockhoff, S. R., N. E. Christians, R. J. Killorn, R. Horton, and D. D. Davis. 2010. Physical and mineral-nutrition properties of sand-based Turfgrass root zones amended with biochar. Agronomy Journal, 102(6): 1627-1631.
Carrick, S., G. Buchan, P. Almond, and N. Smith. 2011. A typical early-time infiltration into a structured soil near field capacity: the dynamic interplay between sorptivity, hydrophobicity, and air encapsulation.
Geoderma, 160(3-4): 579-589.
20 March, 2020 AgricEngInt: CIGR Journal Open access at http://www.cigrjournal.org Vol. 22, No. 1
grazed semiarid rangelands of northeastern Patagonia, Argentina. Journal of Arid Environment, 75(7): 656-661.
Dile, Y. T., P. Daggupati, C. George, R. Srinivasan, and J. Arnold. 2016. Environmental modelling & software introducing a new open source GIS user interface for the SWAT model. Environment Modelling and
Software, 85(nov): 129-138.
Doerr, S. H., and A. D. Thomas. 2000. The role of soil moisture in controlling water repellency: new evidence from forest soils in Portugal. Journal of
Hydrology, 231-232(1): 134-147.
Dohnal, M., J. Dušek, T. Vogel, M. Císlerová, L. Lichner, and Š. Vlasta. 2009. Ponded infiltration into soil with biopores-field experiment and modeling. Biologia
(Bratislava), 64(3): 580-584.
Dörner, J. M. 2005. Anisotropie von bodenstrukturen und porenfunktionen in böden und deren auswirkungen auf transportprozesse im gesättigten und ungesättigten zustand. Ph.D. diss., Institut für Bodenkunde, Christian-Albrechts-Universität zu Kiel.
Elrick, D. E., and W. D. Reynolds. 1992. Infiltration from constant-head well permeameters and infiltrometers.
In Advances in Measurement of Soil Physical
Properties: Bringing Theory into Practice, eds. G.C.
Topp, W.D. Reynolds, and R.E. Green, 1-24. Texas: Soil Science Society of America.
Esmaeelnejad, L., M. Shrorafa, M. Gorji, and S. M. Hosseini. 2016. Enhancement of physical and hydrological properties of a sandy loam soil via application of different biochar particle sizes dururing incubation period. Spanish Journal Agriculture
Research, 14(e1103): 1-14.
Githinji, L. 2014. Effect of biochar application rate on soil physical and hydraulic properties of a sandy loam.
Archives of Agronomy and Soil Science, 60(4):
457-470.
Hamidreza, S. S., Z. Hazbavi, and M. K. Harchegani. 2016. Controllability of runoff and soil loss from small plots treated by vinasse-produced biochar. Science of Total
Environment, 541(1): 483-490.
Hardie, M. A., W. E. Cotching, R. B. Doyle, G. Holz, S. Lisson, and K. Mattern. 2011. Effect of antecedent soil moisture on preferential flow in a texture-contrast soil. Journal of Hydrology, 398(3-4): 191–201. Hartge, K. H., and R. Horn. 2016. Essential Soil Physics.
Stuttgart: Schweizerbart Science Publishers.
Hillel, D. 1998. Environmental Soil Physics. USA: Academic Press.
Horn, R., and M. Kutilek. 2009. The intensity-capacity concept-How far is it possible to predict intensity values with capacity parameters. Soil Tillage
Research, 103(1): 1-3.
Horn, R., X. Peng, H. Fleige, and J. Dörner. 2017. Pore rigidity in structured soils-only a theoretical boundary condition for hydraulic properties? Soil Science and
Plant Nutrition, 60(1): 3-14.
Igbadun, H. E., M. K. Othman, and A. S. Ajayi. 2016. Infiltration characteristics of organic amended soils.
Global Journal of Research in Engineering, 16(4):
35-39.
Imhoff, P. T., and A. A. A. Nakhli. 2017. Reducing stormwater runoff and pollutant loading with biochar addition to highway greenways. Final Report for NCHRP IDEA Project 182, University of Delaware, Washington, DC.
Itsukushima, R., K. Ideta, Y. Anaga, T. Sato, and Y. Shumatani. 2016. Evaluation of infiltration capacity and water retention potential of amended soil using bamboo charcoal and humus for urban flood prevention. In 11th International Symposium on
Ecohydraulics, 1-8. Melbourne, Australia, 7-12
February.
Jačka, L., J. Pavlásek, P. Pech, and V. Kuráz. 2016. Assessment of evaluation methods using infiltration data measured in heterogeneous mountain soils.
Geoderma, 276(1): 74-83.
Jury, W. A., and R. Horton. 2004. Soil Physics.sixth ed. USA: John Wiley & Sons.
March, 2020 A simulated effect of wetting and drying periods for two textural soils Vol. 22, No. 1 21
control. Environment Earth Science, 74(3): 2463-2473.
Li, Z., Gu, C., Zhang, R., Ibrahim, M., Zhang, G., Wang, L.,Zhang, R., Chen, F. and Liu, Y., 2017. The benefic effect induced by biochar on soil erosion and nutrient loss of slopping land under natural rainfall conditions in central China. Agricultural Water Management,
185(1): 145-150.
Masiello, C. A., B. Dugan, C. E. Brewer, K. Spokas, J. M. Novak, Z. Liu, and G. Sorrenti. 2014. Biochar effects on soil hydrology. In Biochar for Environmental Management Science, Technology and
Implementation, eds. J. Lehmann, and S. Joseph,
541-560. London: Routledge.
Neitsch, S. L., J. G. Arnold, J. R. Kiniry, and J. R. Williams. 2009. Soil and Water Assessment Tool.
version 2009. Texas: Texas Water Resources Institute
Tech.
Nimmo, J. R. 2004. Porosity and pore size distribution. In
Encyclopedia of Soils in the Environment, ed. D.
Hillel, 295-303, London: Elsevier, v.3.
Novak, J., G. Sigua, D. Watts, K. Cantrell, P. Shumaker, A. Szogi, M. G. Johnson, and K. Spokas. 2016. Biochars impact on water infiltration and water quality through a compacted subsoil layer. Chemosphere, 142(1): 160-167.
Peng, X., R. Horn, and A. Smucker. 2007. Pore shrinkage
dependency of inorganic and organic soils on wetting and drying cycles. Soil Science Society of America
Journal, 71(4): 1095-1104.
Villagra-Mendoza, K., and R. Horn. 2018a. Effect of biochar addition on hydraulic functions of two textural soils. Geoderma, 326(1): 88-95.
Villagra-Mendoza, K., and R. Horn. 2018b. Effect of biochar on the unsaturated hydraulic conductivity of two amended soils. International Agrophysics, 32(3): 373–378.
Villagra-Mendoza, K., and R. Horn. 2019. Changes in water infiltration after simulated wetting and drying periods in two biochar amendments. Soil Systems, 3(4), 63.
Zhang, Q., and K. H. Hartge. 1995. Mechanical properties of soils as influenced by the incorporated organic matter. In Advances in Soil Science: Soil Structure, Its
Development and Function, eds. K. H. Hartge, and B.
A. Stewart, 93-108. Boca Raton, FL.: CRC Press Inc. Zhao, Y., M. De Maio, F. Vidotto, and D. Sacco. 2015.
Influence of wet-dry cycles on the temporal infiltration dynamic in temperate rice paddies. Soil
Tillage Research, 154(1): 14-21.
Zong, Y., D. Chen, and S. Lu. 2014. Impact of biochars on swell-shrinkage behavior, mechanical strength, and surface cracking of clayey soil. Journal of Plant