Estimation of head rice yield by measuring the bending strength
of kernels after drying by different drying methods
Seyed Mehdi Nassiri
*, Seyed Mohammad Etesami
(Department of Biosystems Engineering, Shiraz University, Shiraz, Iran)
Abstract: In this study, two local rough rice cultivars (long and medium grain) were dried by three different drying methods including indirect and mixed-mode active solar dryers, and continuous dryer at three temperature levels of 35°C, 45°C and 55°C. Bending strength of brown rice kernels, percentage of fissured kernels and head rice yield were measured and evaluated. No significant difference between bending strength of dried rough rice kernels by indirect and mixed-mode active solar drying methods was observed. Drying by continuous dryer improved the mechanical strength of kernels by providing tempering periods. Medium size kernels depicted more strength than longer ones. Strong relationships were established between the bending strength of the brown rice kernels and percentage of fissured kernels and as well as head rice yield.
Keywords: bending strength, drying, head rice yield, fissured kernels, rough rice
Citation: Nassiri, S. M., and S. M. Etesami. 2016. Estimation of head rice yield by measuring the bending strength of kernels after drying by different drying methods. Agricultural Engineering International: CIGR Journal, 18 (2):368-377.
1 Introduction
1Rice as one of the most important cereals is ranked as the highest demanded food grains. Population growth and food resource limitations force to reduce rice production wastes. Breakage of kernels during milling process is a major problem for rice processing. Clement and Seguy (1994) stated that long and narrow rice grains
break during milling process. However, it was reported that most rough rice losses are produced in drying process (Brooker et al., 1992; Cnossen and Siebenmorgen, 2000). Thermal and moisture content gradients during rough rice drying produce stresses within kernels. When these stresses exceed the kernel strength limit, fissures are created and developed in kernels, resulting in kernel failure (Yang et al., 2002; Siebenmorgen and Qin, 2005; Prachayawarakorn et al., 2005). Therefore, drying is known as a critical operation amongst rough rice processing operations.
Received date: 2015-12-21 Accepted date:2016-04-20 *Corresponding author: Seyed Mehdi Nassiri, Department of Biosystems Engineering, Shiraz University, Shiraz, Iran [email protected]
Mechanical behavior of agricultural materials under force is generally determined by force-deformation (stress-strain) test (Mohsenin, 1996). Efforts have been made to explain the breakage of rice kernel using its mechanical properties (Lu and Siebenmorgen, 1995; Siebenmorgen and Qin, 2005; Siebenmorgen et al., 2005).
Siebenmorgen and Qin (2005) reported that HRY is not a
function of average breaking force of rice kernels and has
strong correlation with percentage of “strong” kernels,
which is defined as kernels that sustained 20 N forces at
bending. Moreover, a significant relationship between
HRY and the percentage of kernels that tolerated breaking
force greater than 20 N (strong kernels) was reported by
June, 2016 Estimation of head rice yield by measuring the bending strength of kernels after drying by different drying methods Vol. 18, No. 2 369
The objectives of the present study were: 1) to compare the bending strength of kernels of two local rice cultivars after drying in different dryers; and 2) to find a relationship for estimating HRY using mechanical properties of the kernels.
2 Materials and methods
Two local rough rice cultivars of medium size grains (Lenjan) and long size grains (Fajr) were collected from farm in Oct. 2010. Initial moisture content was measured by gravimetric method in an air-oven at 105°C for 24 h (AOAC, 2000), and was 18% and 17% (w.b.) for Lenjan and Fajr cultivars, respectively. The grains were immediately sealed in air tight plastic bags, stored in cool place for 12 h to reduce field heat gradually, and then kept in a refrigerator at 5°C. Samples were removed from the refrigerator and kept at ambient temperature (about 20°C) for 12 h before drying. Moisture content of the samples was measured before and after each drying treatment by gravimetric method. One hundred kernels were randomly selected from each sample and hulled manually. Physical characteristics (length, width, thickness, slenderness, and the weight of 1000 kernels) of brown rice kernels were measured using a digital caliper (500, Mitutoyo, Japan) with an accuracy of ±0.01 mm.
2.1 Drying systems
Three different drying systems were used for drying samples. Final moisture content of samples was considered to be 10.5±0.5% as recommended by Sadeghi and Nassiri (2010). Dried rough rice samples were sealed in plastic bags and stored at ambient temperature before they were used for three-point bending tests.
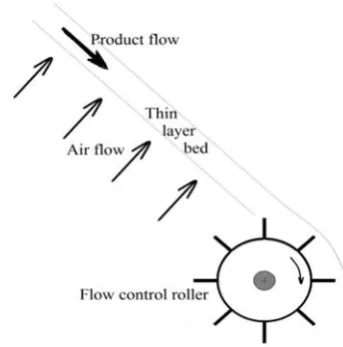
2.1.1 Continuous drying system
Paddy was dried by a laboratory inclined bed
continuous dryer, in which two screen sheets as a drying
bed were fixed 20 mm apart (Zomorodian and Allameh,
2003(. Drying air at three levels of 35°C, 45°C and
55°C was passed through the rough rice in transverse
direction at the rate of 0.28 kg/m2s. Air temperature was
controlled by PT-100 sensor based thermostat. About
1600 g rough rice fed into the dryer from top hopper.
The flow rate of paddy in dryer was controlled by a
multi-vane rotary gate at the bottom of the dryer (Figure
1). Discharged grains were refilled in hopper, manually.
In each run every few minutes, the moisture content was
measured by a portable moisture meter (Rasa 3000, ±1%
accuracy).
Figure 1 Schematic diagram of continuous dryer
2.1.2 Indirect active solar drying system
Figure 2 Schematic diagram of indirect and mixed-mode solar dryer
2.1.3 Mixed-mode active solar drying system
The procedure was the same as indirect active solar dryer, except that the sun rays also radiated directly on grains in tray.
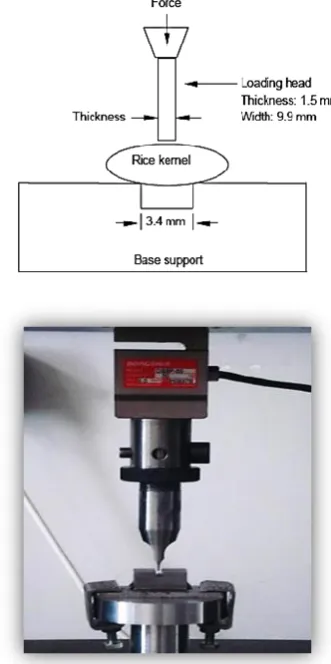
2.2 Three-point bending test
Three-point bending test was applied on each kernel using an Instron machine (Santam, STM–20) equipped with a load cell of 50 kgf (BONGSHIN, DBBP-50, Korea). A hundred rough rice grains were randomly selected from each treatment batch and dehusked manually to minimize any likely mechanical damages. Then, the brown rice kernels were prepared for bending tests. Loading probe had a thickness of 1.5 mm with flat surface. The support points were 3.4 mm apart (Figure 3). Tests were run at constant deformation rate of 0.5 mm/s (Siebenmorgen et al., 2005). The breaking force was recorded for samples and corresponding bending stress was calculated to normalize the variations in kernel cross section areas (ASAE, 2002). It can be calculated by Equation 1 :
I
FLC
4
(1)
where σ is bending strength, Pa; F is breaking (peak) force, N; L is distance between the supports, m; c is distance from the neutral axis to the outer surface of the particle, m; for a rice kernel, c=d/2 where d is the minor diameter of the ellipse or thickness of the kernel), and I is area moment of inertia, m4. It was assumed that the cross
sectional area perpendicular to the longitudinal axis of rice kernel is an ellipse; therefore, area moment of inertia was calculated by I=0.049(bd3), where b is the major diameter of the ellipse or width of the rice kernel.
Figure 3 Loading probe, support and rice kernel
2.3 Milling quality
Processing quality of rough rice is expressed by the
percentage of head rice yield (HRY) and fissured kernels
June, 2016 Estimation of head rice yield by measuring the bending strength of kernels after drying by different drying methods Vol. 18, No. 2 371
Samples of 50 g were shelled using a laboratory scale rubber roll type husker (Model THU-35A, Satake, Japan). Brown rice was milled for 30 s by a Kett rice polisher (Kett Electric Laboratory, Tokyo, Japan) for removing the bran. Percentage of HRY (white kernels having 3/4 or more of the original kernel length) was calculated as ratio of the mass of whole white rice kernels to the total mass of rough rice (Aquerreta et al., 2007; Yadav and Jindal, 2008). This ratio was determined in samples of 10 g of white rice.
2.4 Statistical analyses
Analysis of variance (ANOVA) and comparison of means by Duncan multiple range posttest was performed using SPSS software (release16, SPSS software Inc.).
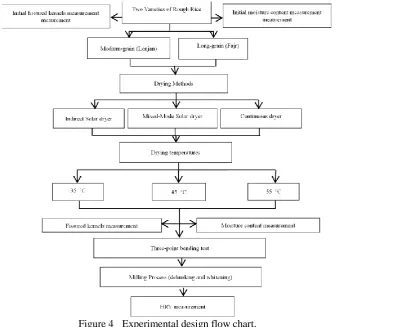
The experimental design flow chart is shown in Figure 4. Relationship between mechanical property of kernels and percentage of fissured kernels as well as mechanical property and percentage of HRY was established using regression analysis technique.
3. Results and discussion
3.1 Morphological properties
Some kernels’ physical properties for both brown
rice cultivars are given in Table 1. Slenderness (the ratio
of length to diameter) of Fajr kernels was significantly
higher as compared to Lenjan cultivar (p<0.05).
3.2 Bending strength
All experimental main factors (cultivar, drying air
temperature and method) significantly affected the
strength of brown rice kernels (P <0.01) with
non-significant interaction effects (P> 0.1). Figure 4 Experimental design flow chart.
Table 1 Some morphological characteristics of grain brown rice
1000 kernels mass, g
Length/width Thickness, mm
Width, mm Length, mm
Variety
15.8±0.5
2.7±0.3 1.6±0.1
2.3±0.2 6.0±0.4
Medium grain (Lenjan)
17.9±0.3
3.8±0.2 1.7±0.1
1.9±0.1 7.3±0.2
Long grain (Fajr)
Medium size rice kernels (Lenjan) tolerated higher bending strength than long ones (Fajr) as is shown in Table 2. This might be mainly due to the texture of cultivars which resulted in different growth conditions. Ambient temperature during grain development especially in grain
reproductive stage plays an important role in rice grain quality (Cooper et al., 2006; Peng et al., 2004). On the other hand, Clement and Seguy (1994) reported that longer rice grains collapse under applied force more easily.
Comparison among the bending strength means at different temperature levels showed a non-significant difference at 35°C and 45°C (P>0.05). Kernels tend to become weaker at highest drying temperature (55oC) due to created thermal stresses. This gradient produced and developed fissures in kernels (Courtois et al., 2001; Iguaz et al., 2006; Kermani et al., 2006) (Table 2 and Table 3).
Table 3 Mean values of bending strength
Drying method Drying Temperature, °C Mean
35 45 55
Continuous 9.1 8.3 6.8 8.1 A
Mixed solar 7.1 6.9 6.4 6.8 B
Indirect solar 7.5 7 5.3 6.6 B
Mean 7.8 a 7.5 a 6.2 b
Note: The mean values with the same small or capital letters are not significantly different (P >0.05)
Direct solar radiation has not influenced the strength of kernels as concluded from non-significant difference between bending strength of kernels for indirect and mixed-mode active solar dryers. However, bending strength of kernels dried by continuous dryer drastically
increased due to alternative heating periods while unloading and reloading the drier. Renjie et al. (2010) reported that tempering has a significant influence on the moisture content gradient in kernels. Tempering reduces heat fluxes and avoids crack development within kernels. The most bending strength of 10.5 MPa among all treatments was obtained for Lenjan cultivar when dried in continuous dryer at 35°C because of low rate drying. The least strength for the same cultivar was observed for indirect solar drying method at 55°C. Corresponding values were 7.5 MPa and 5 MPa for Fajr cultivar at 35°C and 55°C.
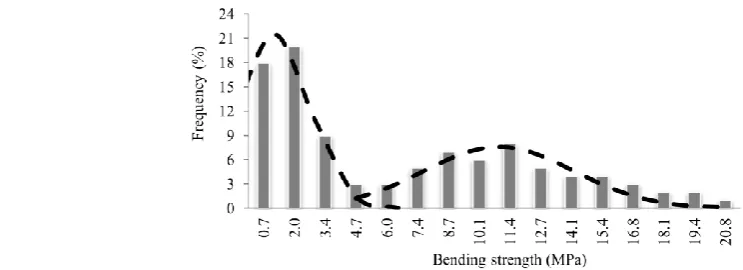
To pinpoint on kernels’ strength, distribution of bending strength frequencies were determined (Figure 5 and Figure 6). This is a typical curve for both cultivars when dried in continuous dryer at 45oC. Both curves followed the bi-modal pattern. The same patterns were observed for all treatments. Some researchers classified rice kernels into two groups "strong" and "weak" based on bi-modal strength pattern (Lu and Siebenmorgen, 1995; Siebenmorgen and Qin, 2005; Siebenmorgen et al., 2005). It was reported that the strength of grains while processing is function of percentage of strong grain in batch.
Table 2 Bending strength in all treatments for two rough rice cultivars
Paddy variety Treatments Bending strength, MPa Paddy variety Treatments Bending strength, MPa Drying method Drying temperature, °C Drying method Drying temperature, °C
Lenjan Continuous 35 10.5 a Fajr Continuous 35 7.5 ab
45 9.6 ab 45 6.8 bc
55 8.6 a-c 55 5.z4 c
Mixed solar 35 8.4 bc Mixed solar 35 5.5 bc
45 8.3 bc 45 5.4 c
55 7.5 cd 55 5.3 c
Indirect solar 35 8.0 bc Indirect solar 35 6.1 b
45 8.9 a-c 45 5.9 bc
55 5.5 d 55 5.0 c
Mean 8.4 A Mean 5.8 B
June, 2016 Estimation of head rice yield by measuring the bending strength of kernels after drying by different drying methods Vol. 18, No. 2 373
By approximation of normal distribution for each
group, a discrimination threshold value was determined in
the range of mean plus a standard deviation for the first
normal distribution and mean minus a standard deviation
of the second normal distribution. This range was
nearly 4 MPa to 6 MPa for all treatments. Therefore,
the mean strength of 5 MPa was taken as threshold value
for classifying the kernels into two groups which
hereafter are called "weak" and "strong" kernels.
Percentage of kernels that possessed bending strength
more than 4 MPa, 5 MPa and 6 MPa are given in Table 4.
It shows that 5 MPa threshold point was chosen suitably.
3.3 Estimation of HRY
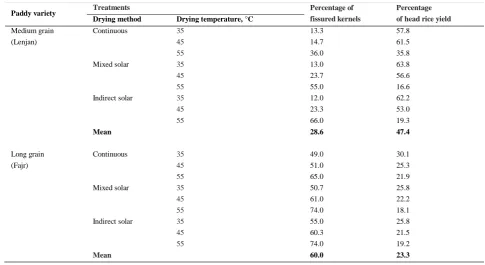
Percentage of fissured kernels and HRY were determined for all treatments (Table 5), and then the correlation between bending strength of kernels and percentage of fissured kernels, and also HRY(%) were calculated (Table 6).
Figure 5 Frequency histograms approximated by two normal distributions (Long grain variety (Fajr) dried in continuous dryer at 45°C)
Considering the correlation coefficients values,
linear equations were established between
aforementioned parameters as given in Table 7 and Table
8. According to the relationships, the grains that sustain
5 MPa stress, and even more, can likely pass milling
process safely. Sharma and Kunze (1982) stated that the
grain with a fissure is likely broken when it is milled. Table 4 Percentage of kernels with bending strength more than 4, 5 and 6 MPa for different treatments
Paddy variety Treatments Percentage of kernels with strength more than
Drying method Drying temperature, °C 4 Mpa 5 Mpa 6 Mpa
Medium grain (Lenjan)
Continuous 35 90 83 82
45 84 79 74
55 75 69 67
Mixed solar 35 88 86 76
45 83 78 71
55 55 50 49
Indirect solar 35 85 84 77
45 79 77 74
55 52 47 45
Mean 76.8 72.6 68.3
Long grain (Fajr) Continuous 35 58 57 50
45 51 50 45
55 48 46 40
Mixed solar 35 54 53 44
45 46 45 38
55 39 40 32
Indirect solar 35 58 54 50
45 46 45 41
55 39 35 31
Mean 48.8 47.2 41.2
Table 5 Percentage of fissured kernels and HRY for different treatments
Paddy variety Treatments Percentage of
fissured kernels
Percentage of head rice yield
Drying method Drying temperature, °C
Medium grain (Lenjan)
Continuous 35 13.3 57.8
45 14.7 61.5
55 36.0 35.8
Mixed solar 35 13.0 63.8
45 23.7 56.6
55 55.0 16.6
Indirect solar 35 12.0 62.2
45 23.3 53.0
55 66.0 19.3
Mean 28.6 47.4
Long grain (Fajr)
Continuous 35 49.0 30.1
45 51.0 25.3
55 65.0 21.9
Mixed solar 35 50.7 25.8
45 61.0 22.2
55 74.0 18.1
Indirect solar 35 55.0 25.8
45 60.3 21.5
55 74.0 19.2
June, 2016 Estimation of head rice yield by measuring the bending strength of kernels after drying by different drying methods Vol. 18, No. 2 375
4 Conclusion
The study revealed that the strength of grains of two rough rice cultivars followed the same trend when dried by different drying methods. Highest head rice yield was
obtained when both cultivars were dried in a continuous dryer. Frequency distribution of bending strength for both cultivars depicted two distinct modes for classifying strong and weak kernels. There was a strong linear relation between the percentage of kernels having bending
Table 6 Correlation coefficient and root mean squared of error (RMSE) between bending strength and
either percentage of fissured kernels and HRY
Parameter Variety Bending strength
Mean >4 MPa >5 MPa >6 MPa
Fissured Lenjan -0.79 (12.1) -0.98 (4.1) -0.99 (3.3) -0.98 (4.5)
Fajr -0.76 (6.7) -0.91 (4.3) -0.93 (3.7) -0.92 (4.1)
HRY Lenjan 0.69 (14.5) 0.96 (5.4) 0.98 (4.2) 0.94 (6.7)
Fajr 0.72 (5.6) 0.92 (3.1) 0.93 (3.0) 0.93 (2.9)
Table 7 Relationship between percentage of fissured kernels and bending strength
Paddy variety Drying method Equation (Adjusted coefficient of determination)
Medium grain (Lenjan)
Continuous FK = -1.7 SK5 + 153.6 (R² = 0.949)
Mixed solar FK = -1.2 SK5 + 112.9 (R² = 0.998)
Indirect solar FK = -1.4 SK5 + 134.2 (R² = 0.999)
Long grain (Fajr)
Continuous FK = -1.3 SK5 + 122.5 (R² = 0.713)
Mixed solar FK = -1.7 SK5 + 142.3 (R² = 0.961)
Indirect solar FK = -1.0 SK5 + 108.1 (R² = 0.953)
Note: FK and SK5 refer to percentage of fissured kernels and percentage of kernels that sustained bending strength more than 5 MPa, respectively.
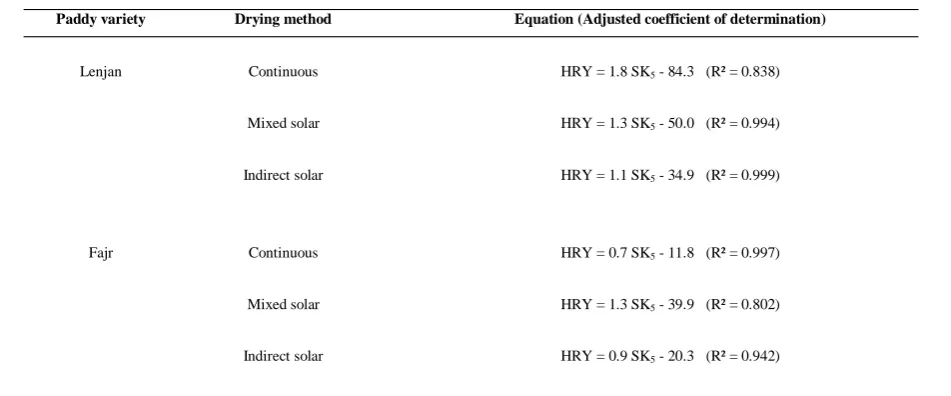
Table 8 Relationship between percentage of HRY and bending strength
Paddy variety Drying method Equation (Adjusted coefficient of determination)
Lenjan Continuous HRY = 1.8 SK5 - 84.3 (R² = 0.838)
Mixed solar HRY = 1.3 SK5 - 50.0 (R² = 0.994)
Indirect solar HRY = 1.1 SK5 - 34.9 (R² = 0.999)
Fajr Continuous HRY = 0.7 SK5 - 11.8 (R² = 0.997)
Mixed solar HRY = 1.3 SK5 - 39.9 (R² = 0.802)
Indirect solar HRY = 0.9 SK5 - 20.3 (R² = 0.942)
strength more than 5 MPa and the percentage of fissured kernels. Likewise, a strong relationship was established between bending strength and percentage of head rice yield.
References
Afkari-Sayyah, A. H., and S. Minaei. 2004. Determining
mechanical and rheological characteristics of wheat and rice
kernels for qualitative classification. Iranian Journal of
Agricultural Science, 35(3): 561-571.
AOAC. 2000. Official Methods of Analysis of the Association of
Official Analytical Chemists, 17th ed. AOAC International,
Gaithersburg, MD, USA. Official Method 925.10.
Aquerreta, J., A. Iguaz, C. Arroqui and P. Vı´rseda. 2007. Effect of high temperature intermittent drying and tempering on rough rice quality. Journal of Food Engineering, 80(2): 611-618.
ASAE Standards. 2002. S459: Shear and three point bending test of animal bone. American Society of Agricultural Engineers, St. Joseph, MI.
Brooker, D. B., F. W. Bakker-Arkema, and C. W. Hall. 1992. Drying and storage of grains and oilseeds. The AVI Pub. Company, USA.
Clement, G., and J. Seguy. 1994. Behaviour of rice during processing. Agriculture et Development, 16(3): 38-46.
Cnossen, A. G., and T. J. Siebenmorgen. 2000. The glass transition temperature concept in rice drying and tempering effect on milling quality. Transactions of the ASAE, 43(6): 1661-1667.
Cooper, N. T. W., T. J. Siebenmorgen, P. A. Counce, and J. F. Meullenet. 2006. Explaining rice milling quality variation using a historical weather data analysis. Cereal Chemistry,
83(4): 447-450.
Courtois, F., M. Abud Archila, C. Bonazzi, J. M. Meot, and G. Trystram. 2001. Modeling and control of a mixed flow rice dryer with emphasis on breakage quality. Journal of Food Engineering, 49(4): 303-309.
Duffie, J. A., and W. A. Beckman. 1991. Solar Engineering of Thermal Processes, 2nd ed., John Wiley and Sons, Inc., New York, USA.
Hoseinian, S. H., M. Sadeghi, and A. Hemmat. 2008. Percentage of broken of Isfahan rice cultivar in whitening process and its relationship with some mechanical properties of paddy. The 5th National Conference on Agricultural Machinery Engineering and Mechanization. Ferdowsi University of Mashhad, Iran.
Iguaz, A., M. Rodriguez, and P. Virseda. 2006. Influence of handling and processing of rough rice on fissured and head rice yields. Journal of Food Engineering, 77(4): 803-809. Kermani, A. M., T. Tavakoli Hashjin, and M. H. Khoshtaghaza.
2006a. Investigation about capability of crack formation due to stress for two varieties of rice (Hashemi and Khazar) under tin-layer drying process paddy. Journal of Agricultural Sciences, 37(4): 697-700.
Kermani, A. M., T. Tavakoli Hashjin, S. Minaei, and M. H. Khoshtaghaza. 2006b. Assessing mechanical properties of rice kernel and studying on the effect of compression test speed. Journal of Food Science and Technology, 3(4): 1-8. Lu, R., and T. J. Siebenmorgen. 1995. Correlation of head rice
yield to selected physical and mechanical properties.
Transactions of the ASAE, 38(3): 889-894.
Mahfeli, M., F. Ghanbari, and S. M. Nassiri. 2014. Effect of steaming period and drying temperature on failure force of parboiled paddy. The 8th National conference on Agricultural Machinery Engineering and Mechanization, Ferdowsi University of Mashhad, Iran.
Mohsenin, N. N. 1996. Physical Properties of Plant and Animal Materials. Second Edition. Gordon and Breach, New York. Peng, S., J. Huang, J. Sheehy, R. C. Laza, R. M. Visperas, X. Zhong,
G. S. Centeno, G. S. Hkush, and K. G. Cassman. 2004.
Rice yields decline with higher night temperature from global warming. National Academy of Sciences of the USA 101: 9971-9975.
Prachayawarakorn, S., N. Poomsaad, and S. Soponronnarit. 2005. Quality maintenance and economy with high-temperature paddy-drying processes. Journal of Stored Products Research, 41(3): 333-351.
Renjie, D., Z. Lu, Z. Liu, S. Koide, and W. Cao. 2010. Effect of drying and tempering on rice fissuring analysed by integrating intra-kernel moisture distribution. Journal of Food Engineering, 97(2): 161-167.
Sadeghi, N., and S. M. Nassiri. 2010. The effect of paddy moisture content on milling losses and post-milling crack development in rice kernel under different. XVII World Congress of CIGR. Quebec city, Canada.
Siebenmorgen, T. J., and G. Qin. 2005. Relating rice kernel breaking force distributions to milling quality. Transactions of the ASAE, 48(1): 223-228.
Siebenmorgen, T. J., G. Qin, and C. Jia. 2005. Influence of
drying on rice fissure formation rates and mechanical strength
distributions. Transactions of the ASAE, 48(5): 1835-1841.
June, 2016 Estimation of head rice yield by measuring the bending strength of kernels after drying by different drying methods Vol. 18, No. 2 377
Yadav, B. K., and V. K. Jindal. 2008. Changes in head rice yield and whiteness during milling of rough rice (Oryza sativa L.).
Journal of Food Engineering, 86(1): 113-121.
Yang, W., C. Jia, T. J. Siebenmorgen, T. A. Howell, and A. G. Cnossen. 2002. Intra-kernel rice moisture responses to drying and tempering treatments by finite element simulation. Transactions of the ASAE, 45(4): 1037-1044.
Zomorodian, A., and A. R. Allameh. 2003. Evaluating of thin layer drying process for paddies and determining an
appropriate grain thin layer depth using a natural convection pilot solar dryer. Journal of Sciences and Technology of Agriculture and Natural Resources, 6(4): 218-230.