PRIMARY RESEARCH
Exploiting collateral sensitivity controls
growth of mixed culture of sensitive
and resistant cells and decreases selection
for resistant cells in a cell line model
Vince Kornél Grolmusz
1, Jinfeng Chen
1, Rena Emond
1, Patrick A. Cosgrove
1, Lance Pflieger
1, Aritro Nath
1,
Philip J. Moos
2and Andrea H. Bild
1*Abstract
Background: CDK4/6 inhibitors such as ribociclib are becoming widely used targeted therapies in hormone-recep-tor-positive (HR+) human epidermal growth factor receptor 2-negative (HER2−) breast cancer. However, cancers can advance due to drug resistance, a problem in which tumor heterogeneity and evolution are key features.
Methods: Ribociclib-resistant HR+/HER2− CAMA-1 breast cancer cells were generated through long-term ribociclib treatment. Characterization of sensitive and resistant cells were performed using RNA sequencing and whole exome sequencing. Lentiviral labeling with different fluorescent proteins enabled us to track the proliferation of sensitive and resistant cells under different treatments in a heterogeneous, 3D spheroid coculture system using imaging micros-copy and flow cytometry.
Results: Transcriptional profiling of sensitive and resistant cells revealed the downregulation of the G2/M checkpoint in the resistant cells. Exploiting this acquired vulnerability; resistant cells exhibited collateral sensitivity for the Wee-1 inhibitor, adavosertib (AZD1775). The combination of ribociclib and adavosertib achieved additional antiproliferative effect exclusively in the cocultures compared to monocultures, while decreasing the selection for resistant cells. Conclusions: Our results suggest that optimal antiproliferative effects in heterogeneous cancers can be achieved via an integrative therapeutic approach targeting sensitive and resistant cancer cell populations within a tumor, respectively.
Keywords: Collateral sensitivity, Tumor heterogeneity, Drug resistance, CDK4/6 inhibitor, Wee-1-inhibitor
© The Author(s) 2020. This article is licensed under a Creative Commons Attribution 4.0 International License, which permits use, sharing, adaptation, distribution and reproduction in any medium or format, as long as you give appropriate credit to the original author(s) and the source, provide a link to the Creative Commons licence, and indicate if changes were made. The images or other third party material in this article are included in the article’s Creative Commons licence, unless indicated otherwise in a credit line to the material. If material is not included in the article’s Creative Commons licence and your intended use is not permitted by statutory regulation or exceeds the permitted use, you will need to obtain permission directly from the copyright holder. To view a copy of this licence, visit http://creat iveco mmons .org/licen ses/by/4.0/. The Creative Commons Public Domain Dedication waiver (http://creat iveco mmons .org/publi cdoma in/ zero/1.0/) applies to the data made available in this article, unless otherwise stated in a credit line to the data.
Background
In the past few years, several new therapies have con-tributed to the treatment of various human cancers. In addition to the classical complex surgical, radio- and
chemotherapy, the emergence of novel targeted [1, 2] and
immunotherapies [3] resulted in longer progression-free
and overall survival [3, 4]. In hormone-receptor-positive
(HR+), human epidermal growth factor receptor
2-neg-ative (HER2−) breast cancer CDK4/6 inhibitors and
mammalian target of rapamycin (mTOR) inhibitors are the most widely used targeted therapies, adding
signifi-cant benefit to baseline endocrine therapy [4, 5].
A subset of patients receiving targeted therapies
observe disease progression [6, 7]. Recent progress
indicates that tumor heterogeneity and subclonal evolu-tion can be key features contributing to drug resistance
Open Access
*Correspondence: [email protected]
1 Department of Medical Oncology and Therapeutics Research, Beckman Research Institute, City of Hope National Medical Center, 1218 S Fifth Ave, Monrovia, CA 91016, USA
[8–11]. Following clonal expansion, acquired mutations in cancer cells give rise to different subclones, popula-tions of distinct geno- and phenotypic characteristics and provide a basis for adaptive evolution of the tumor
mass [8, 10]. In the case of selective pressure, resistant
subclones can exhibit a relative proliferative advantage compared to sensitive cells, resulting in resistant cells becoming the predominant subclones, eventually
over-taking the entirety of the tumor mass [8]. These
resist-ant subclones can be therapy-induced (i.e. they have not been present as a population before the start of therapy); however, a growing body of evidence confirms that in several cases pre-existing resistant subclones are
being selected for during the course of treatment [8, 10,
12–14].
Most current standard-of-care therapy regimens are altered only when chemoresistance renders the tumor mass unresponsive to the drug, resulting in progression
or relapse [15–17]. Previously effective treatments lose
their ability to control the tumor burden and because cross-resistance renders several secondary drug classes ineffective, efficacious second-line treatments can be
difficult to find [17, 18]. Some of these resistance traits
include rewiring key pro-proliferative pathways which
can create acquired and targetable sensitivities [19].
Therapeutic approaches could benefit from taking into account evolutionary processes in cancer to develop new tools to postpone or overcome drug resistance. Adaptive therapy aims to exploit the changing proliferative advan-tage between resistant and sensitive cells. This approach succeeds when resistant cells are more fit compared to sensitive cells when drug pressure is on, while when no
treatment is present sensitive cells are more fit [20–22].
Another approach in treating both sensitive and resist-ant cells without providing relative proliferative benefit to either cell type is the application of collateral sensi-tivity. Collateral sensitivity is the acquired vulnerability of a resistant cell against a second drug, which was not applied previously when resistance for the
preced-ing drugs was generated [23, 24]. Exploiting collateral
sensitivity aims to control the tumor burden through a combination of drugs by targeting sensitive cells with the standard-of-care primary drug while targeting the acquired sensitivities of resistant cells with a secondary
drug [17, 23, 24]. Recent clinical trials targeting frequent
resistance mechanisms up-front revealed a clear advan-tage over only blocking the primary target in EGFR-mutant non-small-cell lung cancer and BRAF-EGFR-mutant
melanoma [25, 26]. In addition to cancer treatments,
col-lateral sensitivities of antibiotic-resistant bacteria are also highly sought after to propose novel, more effective bacterial treatment regimens in an era of emerging
anti-biotic resistance [27].
Here, we developed a coculture system to study the effects of collateral sensitivity on the growth of spheroids containing cells sensitive and resistant to CDK4/6 inhibi-tors. Transcriptional profiling of sensitive and resistant cells revealed druggable acquired vulnerabilities of the resistant cells. By labeling the sensitive and resistant cells with different fluorescent proteins we were able to track their proliferation under drug pressure, mimicking the population dynamics of sensitive and resistant subclones. Our results show that coculture spheroids of sensitive and resistant cells under the selective pressure of riboci-clib selects for the ribociriboci-clib-resistant cells. Comparing the transcriptional differences of sensitive and resistant cells revealed the downregulation of G2/M checkpoint in resistant cells, upon which collateral sensitivity against the Wee-1 inhibitor adavosertib (AZD1775) was con-firmed in the resistant cells. The combination of riboci-clib and adavosertib outperformed the antiproliferative effect of mono-treatments in the cocultures but not in the monocultures, while also decreasing the selection for resistant cells. Our results promote a phenotype-driven optimization of evolutionary antiproliferative therapy as a model for further assessment in the pre-clinical and clinical setting.
Methods
Cell lines and reagents
The estrogen-receptor-positive (ER+), HER2- CAMA-1
breast cancer cell line was maintained in DMEM+ 10%
FBS+ 1% antibiotic–antimycotic solution. CAMA-1 cell
line was authenticated by the ATCC cell line authen-tication service. Cells were continuously treated with ribociclib (Selleck Chemicals, Cat. No: S7440) at 1 µM concentration for 1 month followed by 250 nM for 4 months to develop resistance. Ribociclib-resistant CAMA-1 cells (CAMA-1_ribociclib_resistant) were fur-ther maintained in complete culture medium supple-mented with 250 nM ribociclib. Resistance and collateral sensitivity against adavosertib (Selleck Chemicals, Cat. No.: S1525) were detected by the alteration of the dose– response curve measured using CellTiterGlo Chemolu-minescent Kit (Promega Corporation, Cat. No.: G7573). Cell lines were confirmed to be mycoplasma-negative using the Mycoalert PLUS Mycoplasma detection kit (Lonza, Cat. No.: LT07-703).
Sequencing and bioinformatic analysis
Parental sensitive CAMA-1 and CAMA-1_ribociclib_ resistant cell lines were plated 500,000 cells/well in a 6-well plate in triplicates. 24 h after plating 1 µM ribo-ciclib or vehicle (dimethyl sulfoxide, DMSO) treatment were applied for 12 h, after which cells were trypsinized,
RNA isolation. RNA was isolated using the RNeasy Plus Mini Kit (Qiagen, Cat. No.: 74136) following the manu-facturer’s protocol.
RNA-seq libraries were prepared using Illumina TruSeq Stranded Total RNA library Prep Ribo-zero Gold following manufacturer’s protocol. Libraries were sequenced with biological triplicates on an Illumina
NovaSeq6000 instrument with 2 × 150 paired-end reads
resulting in an average of 25 million reads per sample. Samples were aligned to the human reference genome
(hg19) using the STAR (v2.7.0) aligner [28]. Transcripts
were quantified by RSEM (v1.3.1) followed by differen-tial expression analysis using DESeq2 (v1.26) and GSEA pathways analysis using TPM normalized values and
the R packages GSVA (v1.30.0) [29–31]. Genes with at
least a twofold change in expression with FDR < 0.05 were considered statistically significant. Signature scores were generated using the Molecular Signatures Database (v6) Hallmark signature sets. Pathway enrichments with global p-value < 0.05 and FDR < 0.25 were considered sta-tistically significant. Differentially expressed genes were also subjected to pathway analysis regarding the Biocarta
pathways using DAVID Bioinformatics Resources [32]. In
this analysis an FDR-corrected p-value < 0.05 was consid-ered statistically significant.
DNA was isolated from CAMA-1 and CAMA-1_ribo-ciclib_resistant cells using DNeasy Blood & Tissue Kit (Qiagen, Cat. No.: 69504) according to the manufac-turer’s protocol. For whole-exome sequencing, libraries were prepared using Agilent SureSelect XT human All Exon v7 following the manufacturer’s protocol. Libraries were sequenced on a NovaSeq6000 with 2 X150 paired-end reads to a sequencing depth of 285X (CAMA-1) and 300X (CAMA-1_ribociclib_resistant). Reads were trimmed with Trimmomatic prior to alignment to hg19
using BWA-mem [33, 34]. Genome Analysis Tool Kit
(GATK) best practice guidelines were then followed including the use of Picard and Samtools for PCR dupli-cate removal and bam manipulation, and GATK for indel
realignment and base recalibration [35, 36]. Variant
call-ing was performed uscall-ing an n − 1 consensus approach
using three somatic variant callers: Mutect2, Strelka
and Varscan2 [35, 37, 38]. This approach was chosen to
reduce caller specific false positives. Variant annotations
were generated using SNPeff, and Annovar [39, 40]. All
bioinformatic analysis utilized the BETSY workflow man-ager [41].
Lentiviral labeling of sensitive and resistant cells
Lentiviruses incorporating Venus (LeGO-V2) and mCherry (LeGO-C2) fluorescent proteins were gener-ated using Lipofectamine 3000 reagent (Thermo Fisher Scientific) according to the manufacturer’s instructions.
LeGO-V2 and LeGO-C2 vectors were gifts from Boris
Fehse (Addgene plasmids #27340 and #27339) [42].
CAMA-1 and CAMA-1_ribociclib_resistant cell lines were transduced with Venus- and mCherry-containing lentivirus, respectively using reverse transduction, result-ing in CAMA-1_V2 and CAMA-1_riboR_C2 cell lines. Briefly, 1 ml of polybrene-containing cell suspension of 200,000 cells were plated in a well of a 6-well plate, where 0.5 ml of viral aliquot was previously dispensed. Cells
were incubated for 48 h at 37 °C and 5% CO2, after which
cells were washed and fresh regular culture medium was applied. Fluorescently labeled cells were selected using fluorescence-activated cell sorting after further subcul-ture of transduced cells to attain homogeneously labeled cell populations.
Coculture experiments
2000 cells were plated in different proportions (100% CAMA-1_V2, 50% CAMA-1_V2—50% CAMA-1_riboR_ C2, 100% CAMA-1_riboR_C2) in 96-well round-bottom ultra-low attachment spheroid microplate (Corning, Cat. No.: 4520). 24 h later, spheroids were washed and fresh medium including treatment drugs was applied. Sphe-roids were treated for a total of 21 days with imaging and media change been performed at every 4th and 7th day of the week. Imaging was performed using Cytation 5 imager (Biotek Instruments) gathering signal intensity from brightfield, YFP (for Venus fluorescence) and Texas Red (for mCherry fluorescence) channels. Raw data pro-cessing and image analysis were performed using Gen5 3.05 software (Biotek Instruments). Briefly, the
stitch-ing of 2 × 2 montage images and Z-projection using
focus stacking was performed on raw images followed by spheroid area analysis. On the 21st day of treatment, spheroids were harvested, trypsinized, washed, resus-pended in 2 µg/ml DAPI containing flow cytometry
buffer (PBS + 5% FBS). Samples were subjected to flow
within the spheroids. All coculture experiments were performed in triplicates.
Statistical analysis
Dose–response curves were generated using GraphPad Prism 7.02 software. Differences in dose–response curves were compared using extra sum-of-squares F-test. Dif-ferences in spheroid areas and cell proportions were ana-lyzed using Student’s independent samples T-test. Unless otherwise stated a p-value < 0.05 was considered statisti-cally significant.
Results
Long‑term ribociclib treatment results in ribociclib‑resistant cell line
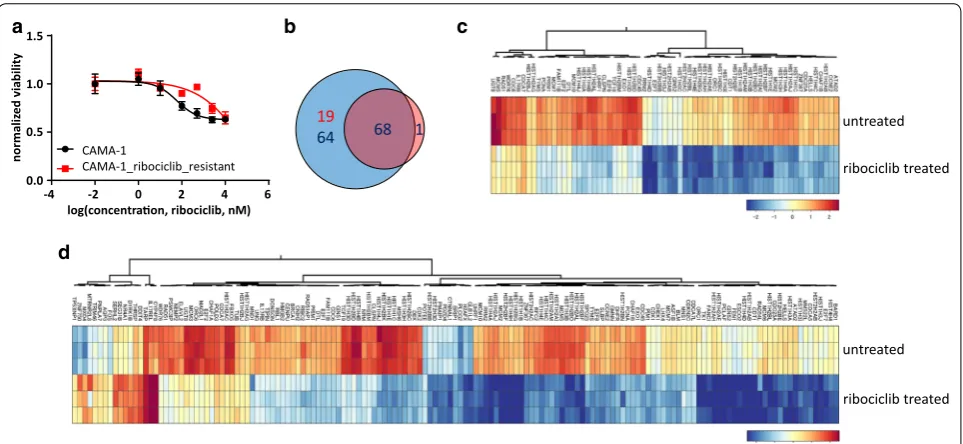
After months of continuous ribociclib treatment, resist-ance to ribociclib emerged (CAMA-1_ribociclib_ resistant cell line), as demonstrated with the different
dose–response curves (p < 0.0001 Fig. 1a). Short-term
ribociclib treatment resulted in 151 and 69 differentially expressed genes in the sensitive (CAMA-1) and resistant (CAMA-1_ribociclib_resistant) cell lines, respectively,
with 68 genes downregulated in both cell lines (Fig. 1b–d,
Additional file 1: Tables S1, S2). Using both Hallmark and
Biocarta pathway gene sets, we find that “CDK regula-tion of DNA replicaregula-tion” was significantly altered in the resistant cells (untreated vs. ribociclib treated CAMA-1_ ribociclib_resistant cells, FDR-corrected p-value:
7.2 × 10⁻⁶) while the two significantly dysregulated
path-ways between untreated and treated sensitive CAMA-1 cells were “CDK regulation of DNA replication”
(FDR-corrected p-value: 6.6 × 10⁻¹⁰) and “cyclins and cell cycle
regulation” (FDR-corrected p-value: 3.0 × 10⁻²), which is
consistent with the mode of action of ribociclib.
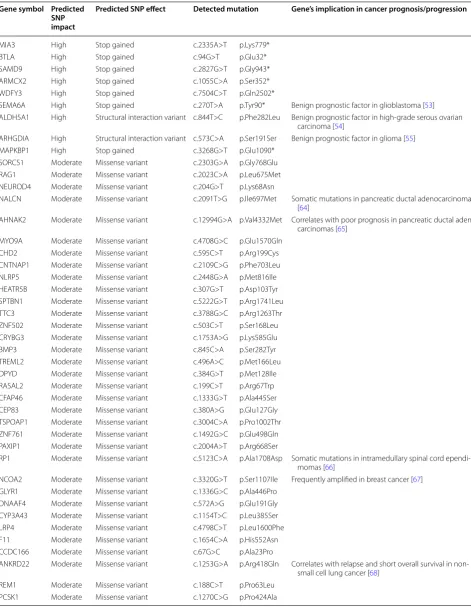
We performed whole-exome sequencing on DNA isolated from the sensitive and resistant cells to detect acquired mutations in resistant cells. We found 9 high impact mutations mainly resulting in early stop codon occurrence and 34 moderate mutations resulting in sin-gle amino acid changes, while 18 mutations did not change the amino acid sequence of the coded proteins
(Table 1). Although no detected mutations are directly
associated with resistance against CDK4/6 inhibition, we found several mutations in cancer-associated genes possibly contributing to the acquired resistance against CDK4/6 inhibition.
19
64 68 1
a b c
d
untreated
ribociclib treated
untreated
ribociclib treated
normaliz
ed viability
log(concentraon, ribociclib, nM)
CAMA-1
CAMA-1_ribociclib_resistant
1.5
1.0
0.5
0.0
-4 -2 0 2 4 6
Table 1 SNPs of high and moderate predicted impact in CAMA-1_ribociclib_resistant cells compared to parental CAMA-1 cells
Gene symbol Predicted SNP impact
Predicted SNP effect Detected mutation Gene’s implication in cancer prognosis/progression
MIA3 High Stop gained c.2335A>T p.Lys779*
BTLA High Stop gained c.94G>T p.Glu32*
SAMD9 High Stop gained c.2827G>T p.Gly943*
ARMCX2 High Stop gained c.1055C>A p.Ser352*
WDFY3 High Stop gained c.7504C>T p.Gln2502*
SEMA6A High Stop gained c.270T>A p.Tyr90* Benign prognostic factor in glioblastoma [53]
ALDH5A1 High Structural interaction variant c.844T>C p.Phe282Leu Benign prognostic factor in high-grade serous ovarian
carcinoma [54]
ARHGDIA High Structural interaction variant c.573C>A p.Ser191Ser Benign prognostic factor in glioma [55]
MAPKBP1 High Stop gained c.3268G>T p.Glu1090*
SORCS1 Moderate Missense variant c.2303G>A p.Gly768Glu
RAG1 Moderate Missense variant c.2023C>A p.Leu675Met
NEUROD4 Moderate Missense variant c.204G>T p.Lys68Asn
NALCN Moderate Missense variant c.2091T>G p.Ile697Met Somatic mutations in pancreatic ductal adenocarcinomas
[64]
AHNAK2 Moderate Missense variant c.12994G>A p.Val4332Met Correlates with poor prognosis in pancreatic ductal
adeno-carcinomas [65]
MYO9A Moderate Missense variant c.4708G>C p.Glu1570Gln
CHD2 Moderate Missense variant c.595C>T p.Arg199Cys
CNTNAP1 Moderate Missense variant c.2109C>G p.Phe703Leu
NLRP5 Moderate Missense variant c.2448G>A p.Met816Ile
HEATR5B Moderate Missense variant c.307G>T p.Asp103Tyr
SPTBN1 Moderate Missense variant c.5222G>T p.Arg1741Leu
TTC3 Moderate Missense variant c.3788G>C p.Arg1263Thr
ZNF502 Moderate Missense variant c.503C>T p.Ser168Leu
CRYBG3 Moderate Missense variant c.1753A>G p.Lys585Glu
BMP3 Moderate Missense variant c.845C>A p.Ser282Tyr
TREML2 Moderate Missense variant c.496A>C p.Met166Leu
DPYD Moderate Missense variant c.384G>T p.Met128Ile
RASAL2 Moderate Missense variant c.199C>T p.Arg67Trp
CFAP46 Moderate Missense variant c.1333G>T p.Ala445Ser
CEP83 Moderate Missense variant c.380A>G p.Glu127Gly
TSPOAP1 Moderate Missense variant c.3004C>A p.Pro1002Thr
ZNF761 Moderate Missense variant c.1492G>C p.Glu498Gln
PAXIP1 Moderate Missense variant c.2004A>T p.Arg668Ser
RP1 Moderate Missense variant c.5123C>A p.Ala1708Asp Somatic mutations in intramedullary spinal cord
ependi-momas [66]
NCOA2 Moderate Missense variant c.3320G>T p.Ser1107Ile Frequently amplified in breast cancer [67]
GLYR1 Moderate Missense variant c.1336G>C p.Ala446Pro
DNAAF4 Moderate Missense variant c.572A>G p.Glu191Gly
CYP3A43 Moderate Missense variant c.1154T>C p.Leu385Ser
LRP4 Moderate Missense variant c.4798C>T p.Leu1600Phe
F11 Moderate Missense variant c.1654C>A p.His552Asn
CCDC166 Moderate Missense variant c.67G>C p.Ala23Pro
ANKRD22 Moderate Missense variant c.1253G>A p.Arg418Gln Correlates with relapse and short overall survival in
non-small cell lung cancer [68]
REM1 Moderate Missense variant c.188C>T p.Pro63Leu
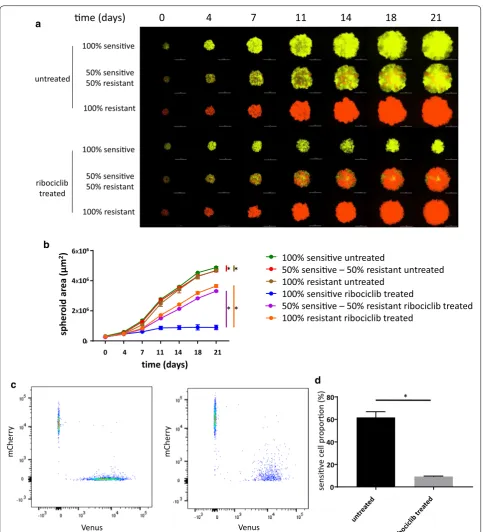
Ribociclib treatment selects for resistant cells in mixed cultures of sensitive and resistant cells
To discriminate sensitive and resistant cells in a cocul-ture system, cell lines were labeled using lentiviral gene transfer with Venus and mCherry fluorescent proteins, respectively. Positively labeled cells were sorted using fluorescence-activated cell sorting to retain the homoge-nously labeled populations and were further subcultured to be utilized in the spheroid experiments. To analyze the long term effects of ribociclib treatment in 3D cocultures of sensitive and resistant cells, 21-day-long experiments using spheroids of different compositions (100%
sensi-tive, 50% sensitive − 50% resistant, 100% resistant) were
initiated (Fig. 2a).
Under no treatment, the growth of all spheroids was remarkable, reaching a 15- to 17-fold increase in
sphe-roid area during the 21-day treatment (Fig. 2b, Additional
file 1: Table S3). In the coculture setting, sensitive cells
exhibited a relative proliferative advantage, as the FACS analysis confirmed that the majority of cells were
Venus-labeled sensitive cells (Fig. 2c, d). Continuous ribociclib
treatment of 400 nM principally inhibited the growth of the spheroids that were started with 100% sensitive cells (only threefold increase in spheroid area over 3 weeks). In contrast, treatment only had a modest effect on the growth of spheroids that were started with 100% resist-ant cells (12-fold increase in spheroid area over 3 weeks). Resistant cells proliferated more effectively under drug pressure in the coculture as well, resulting in a spheroid area 10% smaller than the treated 100% resistant mono-culture. Flow cytometry analysis confirmed that
riboci-clib treatment selected for the resistant cells (Fig. 2c, d).
Transcriptional profiling of sensitive and resistant cells reveal key acquired vulnerability of resistant cells
To optimize the treatment of mixed spheroids of sensi-tive and resistant cells, we aimed to detect acquired vulnerabilities in the phenotype of the resistant cells, upon which collateral sensitivity of potential combina-tion drugs can be applied. We compared the transcrip-tional profiles of untreated sensitive and resistant cells (untreated CAMA-1 vs. untreated CAMA-1_riboci-clib_resistant) and found that 625 genes were signifi-cantly dysregulated (fold change > 2 and false discovery
rate < 0.05, Additional file 2: Figure S1, Additional file 1:
Table S4). Among these genes, several cell cycle (CDK6, RUNX2, CCNB3) and antiapoptotic (BCL2) genes were found to be overexpressed in resistant compared to sensi-tive cells. Pathway analysis using the Hallmark pathways provided 7 pathways significantly dysregulated between
sensitive and resistant cells (Fig. 3a, b, Additional file 3:
Figure S2, Additional file 1: Table S5).
The loss of the G2/M checkpoint renders cells more susceptible to mitotic catastrophe in the absence of suf-ficient quality control. Since the CAMA-1_ribociclib_ resistant cells are more resistant to the G1 arrest caused by ribociclib and quality control at the G2/M checkpoint is also diminished in these cells based on the transcrip-tional profiling, Wee-1 inhibition stimulating resistant cells to enter mitotic catastrophe can be more toxic to these cells. Dose–response experiments with the Wee-1-inhibitor, adavosertib, on sensitive and resistant cells showed the IC50 value for adavosertib dropping by 42% (504.2 nM in CAMA-1 cells compared to 291.1 nM in CAMA-1_riboR cells, p-value: 0.0497), confirming the acquired sensitivity of resistant cells against adavosertib (Fig. 3c).
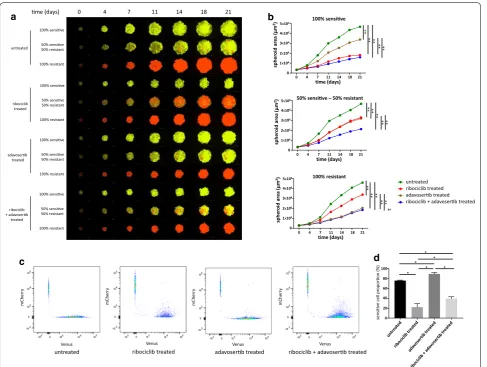
Leveraging collateral sensitivity controls spheroid growth without selecting for resistant cells
In an effort to overcome the selection of resistant cells in mixed spheroids, while still taking advantage of the anti-proliferative effects of ribociclib treatment, we designed a follow-up experiment leveraging the collateral sensitiv-ity of resistant cells in response to adavosertib. The same coculture system was used to investigate the long-term effects of to ribociclib, adavosertib and the combination of these two drugs. While the results of ribociclib treat-ment replicated our previous experitreat-ment, long-term adavosertib treatment proved to be more effective on resistant cells, having only a slight antiproliferative effect
on sensitive and mixed spheroids (Fig. 4a, b, Additional
file 1: Table S6). In line with the acquired adavosertib
sensitivity in resistant cells, the proportion of sensitive cells was higher in adavosertib treated mixed spheroids, even compared to untreated control mixed spheroids, although no drug pressure also selected for the
sensi-tive cells (Fig. 4c, d). The combination of ribociclib and
adavosertib achieved the strongest growth-limiting effect in the spheroids of various composition (100% sensitive,
50% sensitive − 50% resistant, 100% resistant); however, it
0
* *
* * 100% sensive
50% sensive 50% resistant
100% resistant
100% sensive
50% sensive 50% resistant
100% resistant untreated
ribociclib treated
me (days)
0
4
7
11
14
18
21
a
b
c d
*
Venus Venus
mCherr
y
mCherr
y
sphe
ro
id
ar
ea (µ
m
2) 6x10⁶
4x10⁶
2x10⁶
0
time (days)
0 4 7 11 14 18 21
100% sensive untreated
50% sensive – 50% resistant untreated 100% resistant untreated
100% sensive ribociclib treated
50% sensive – 50% resistant ribociclib treated 100% resistant ribociclib treated
0
sensive
cell pr
oporon (%
)
20 40 60 80
Discussion
Leveraging collateral sensitivity aims to control the growth of the tumor mass for a longer period by main-taining a delicate balance between sensitive and resist-ant cells without providing an unequivocal advresist-antage
to either cell type [17, 23]. Since rapid advancements in
single-cell sequencing technologies enable us to track each cancer’s subclonal architecture throughout time
and treatments [8, 10], personalized clinical
manage-ment of various tumors in the future might reside on the observed phenotypic differences of resistant subclones and their druggable acquired vulnerabilities.
In the present work, we aimed to create a 3D spheroid system as an in vitro model of a heterogeneous tumor that incorporates both sensitive and resistant cells, fol-lowed by analysis of the antiproliferative relevance of specifically targeting both cell types. 3D spheroids reca-pitulate more closely the transcriptional program of in situ tumor cells compared to monolayer cultures and thus represent an emerging tool to better mimic the in vivo phenotype of tumors affected by cell–cell, cell–
matrix interactions [43, 44].
As CDK4/6 inhibitors including ribociclib, abemaciclib, and palbociclib start to occupy a key role in the treatment
of HR+, HER2− breast cancer [1], our interest focused
on creating a ribociclib-resistant cell line from the widely
used and characterized ER+, HER2− CAMA-1 cell line
[45, 46]. Long-term exposure of ribociclib resulted in
CAMA-1_ribociclib_resistant, a ribociclib-resistant CAMA-1 cell line. Sixty-nine and 151 transcripts were differentially expressed in response to short-term riboci-clib treatment in the resistant and the sensitive cell lines, respectively. Although many fewer genes were dysregu-lated in response to ribociclib treatment in the resistant cell line, Biocarta pathway analysis on the dysregulated genes revealed an association with “CDK regulation of DNA replication”. The pathway analysis, as well as the abundance of key members of the cell cycle-dependent transcriptional program (members of the E2F
tran-scription factor family, RRM2, cyclins, MCM2) [47, 48]
underlined the clear cell cycle arrest ribociclib achieved
in both cell lines. By comparing the baseline transcrip-tional profile of sensitive and resistant cells, we found CDK6 overexpression in resistant compared to sensitive cells which potentially provides a significant contribution to ribociclib resistance. Yang et al. also found that CDK6 overexpression is responsible for acquired resistance to
CDK4/6 inhibitor abemaciclib in the in vitro setting [49],
while other recent studies further confirmed resistance mechanisms facilitating G1/S transition despite CDK4/6
inhibition such as cyclin E1 amplification or Rb1 loss [50,
51]. In our results, the overexpression of additional key
cell cycle regulators (RUNX2, CCNB3) may also facilitate cell cycle progression in response to CDK4/6 inhibition
[52]. On the DNA level, we found several acquired
muta-tions in the resistant cells. Although no specific mutated gene can be directly linked to resistance against CDK4/6 inhibitors, high impact mutations in several benign prog-nostic factors (SEMA6A, ALDH5A1, ARHGDIA) might also contribute to unrestricted proliferation even under
drug pressure [53–55].
With the successful creation of the ribociclib resistant cell line and by labeling the cell lines with different fluo-rescent proteins using lentiviral gene transfer (Venus for CAMA-1 and mCherry for CAMA-1_ribociclib_resistant cell lines), we were able to coculture and track the pro-liferation of sensitive and resistant cells under different treatments, resulting in a model system resembling heter-ogeneous tumors. If left to proliferate without drug treat-ment, sensitive cells enjoyed a proliferative advantage over resistant cells, confirming previous assumptions and
observations related to the fitness cost of resistance [16,
56]. Long-term ribociclib treatment, however, selected
for resistant cells in the coculture setting, as expected. It is also important to note that the growth pattern and the final size of the coculture are only slightly smaller than the 100% resistant monoculture. This reflects the growth of a heterogeneous tumor during which a resistant sub-clone takes over the tumor mass, diminishing the effect
of the primary drug, ribociclib [50].
To overcome the relative proliferative advantage of resistant cells in the coculture setting, and to control the growth of these mixed spheroids more efficiently, we Fig. 3 Comparing the transcriptional program of CAMA-1 and CAMA-1_ribociclib_resistant cells reveals collateral sensitivity to Wee-1 inhibition. a Schematic representation of significantly altered Hallmark pathways between untreated CAMA-1 and CAMA-1_ribociclib_resistant cell lines. Positive normalized enrichment scores (NES) corresponds to enriched pathways in CAMA-1 (blue circles), while pathways with negative NES values (red circles) are enriched in CAMA-1_ribociclib_resistant cells. Additional enrichment scores for Hallmark pathways can be found in Additional file 1: Table S5. b Heatmap of all genes included in the Hallmark G2/M pathway in untreated CAMA-1 and CAMA-1_ribociclib_resistant cells. Representative genes of the pathway are labeled. Heatmap with all genes labeled can be found in Additional file 3: Figure S2. c Dose–response curves of CAMA-1 and CAMA-1_ribociclib_resistant cells under different concentrations of Wee-1 inhibitor adavosertib treatment. Cells were treated with increasing concentration of adavosertib for 96 h, after which viability was measured using CellTiterGlo Chemiluminescent kit. The measured luminescence was normalized to the average of the lowest applied concentration (0.01 nM). Data points show the average of three replicates, error bars show standard deviation if it is larger than the size of the data point
b
E2F2 CCND1
E2F1
CDKN1B
CCNA2 CCNB2
TOP2A
CDC25B
RAD21 AURKA AURKB CDC25A CHEK1 MKI67
E2F3
CAMA-1
CAMA-1_ribociclib_r
esista
nt
CAMA-1 vs. CAMA-1_ribociclib_resistant
normaliz
ed
v
iability
log(concentraon, adavoserb, nM)
1.5
1.0
0.5
0.0
CAMA-1
CAMA-1_ribociclib_resistant
-4 -2 0 2 4 6
a
Normalized enrichment scores (NES)
aimed to target sensitive and resistant cells with different drugs. Since sensitive cells responded well to ribociclib, we wanted to combine ribociclib with a secondary drug against which resistant cells developed collateral
sensitiv-ity [17]. By comparing untreated transcriptional profiles
of sensitive and resistant cells, we found that the Hall-mark pathway “G2/M checkpoint” was downregulated in resistant cells, which elucidates a potential druggable phenotypic vulnerability. G2/M checkpoint is a major quality control checkpoint during cell cycle
progres-sion [57, 58]. In the case of inefficient DNA replication,
DNA damage response pathways are activated resulting
in G2-M arrest. The loss of this quality control check-point renders cells with suboptimal cell cycle progres-sion more susceptible to enter mitosis which results in
mitotic catastrophe and apoptosis [59]. Apoptosis, on the
pathway level and the key antiapoptotic regulator BCL2 on the gene level, were both found to be upregulated in resistant cells. This constellation signals apoptosis induc-tion due to continuous ribociclib pressure which is effec-tively neutralized by elevated BCL2 levels, resulting in the survival of resistant cells under ribociclib pressure [60].
untreated ribociclib treated adavoserb treated ribociclib + adavoserb treated
100% sensive 50% sensive 50% resistant 100% resistant untreated ribociclib treated
me (days) 0 4 7 11 14 18 21
adavoserb treated ribociclib + adavoserb treated a b c d 100% sensive 50% sensive 50% resistant 100% resistant 100% sensive 50% sensive 50% resistant 100% resistant 100% sensive 50% sensive 50% resistant 100% resistant Venus mCher ry Venus mCher ry Venus mCher ry Venus mCher ry ** ** ** ** ** ** ** ** ** ** ** ** ** ** ** * * * * * * * sphe ro id a re a (µ m
2)5x10⁶
untreated ribociclib treated adavoserb treated ribociclib + adavoserb treated 4x10⁶
3x10⁶
2x10⁶
1x10⁶
0
0 4 7 11 14 18 21
time (days) 100% sensive
0 4 7 11 14 18 21
time (days) sphe ro id a rea (µ m
2)5x10⁶
4x10⁶
3x10⁶
2x10⁶
1x10⁶
0
50% sensive – 50% resistant
0 4 7 11 14 18 21
time (days) sphe ro id a re a (µ m
2)5x10⁶
4x10⁶
3x10⁶
2x10⁶
1x10⁶
0
100% resistant
0
sensive cell pr
oporon (% ) 20 40 60 80 100
Adavosertib, an inhibitor of the key G2/M checkpoint regulator Wee-1 kinase, was developed to facilitate mitotic catastrophe and subsequent apoptosis in cancer cells where genome integrity primarily relies on a
main-tained G2/M checkpoint [61–63]. We hypothesized
that since the G2/M checkpoint is diminished in resist-ant cells and BCL2 overexpression protects these cells against apoptosis, certain concentrations of adavosertib might achieve a higher antiproliferative effect on resistant compared to sensitive cell lines. Dose–response experi-ments in sensitive and resistant cell lines confirmed the collateral sensitivity of resistant cells with regard to ada-vosertib, prompting us for further examination in the long-term coculture system.
Ribociclib mono-treatment confirmed our previous results showing optimal growth inhibitory effect in 100% sensitive spheroids while selecting for the resistant cells in the mixed spheroids. Accordingly, with the acquired sensitivity of the resistant cells, adavosertib mono-treat-ment had a larger antiproliferative effect on the resist-ant cells compared to the sensitive cells and selected for the sensitive cells in the mixed setting. Although growth inhibitory effects of the mono-treatments, with the more effective drug on each monoculture (ribociclib for sen-sitive, adavosertib for resistant), were indistinguishable compared to the combination treatment, combining the two drugs added a considerable antiproliferative effect in the mixed spheroids. This is in line with earlier pro-posals that controlling the growth of heterogeneous can-cers is optimal if all subclones are specifically targeted
[8, 17]. Additionally, as neither cell type enjoyed a
rela-tive proliferarela-tive advantage over each other, the spheroids remained highly heterogeneous, keeping a delicate
bal-ance between sensitive and resistant cells [20], with the
possibility that further treatment with this combination might be durable.
It is important to underline the limitations of our study. Our study is not able to directly translate to in vivo behavior of heterogeneous tumor proliferation, rather it represents a clinically relevant in vitro model system.
Conclusions
We created an in vitro 3D spheroid coculture system modeling tumor heterogeneity dynamics with respect to sensitive and resistant cells towards the primary CDK4/6-inhibitor treatment. Following transcriptional profiling to detect acquired, collateral sensitivity of resist-ant cells, we show that an integrative approach selectively targeting sensitive and resistant cells is needed to opti-mally restrict spheroid growth of cocultures.
Supplementary information
Supplementary information accompanies this paper at https ://doi. org/10.1186/s1293 5-020-01337 -1.
Additional file 1: Table S1. Differentially expressed genes in CAMA-1
cells in response to 1 µM ribociclib treatment for 12 h. Detailed data from Fig. 1, Panel D. Table S2. Differentially expressed genes in CAMA-1_ribo-ciclib_resistant cells in response to 1 µM ribociclib treatment for 12 h. Detailed data from Fig. 1, Panel C. Table S3. Spheroid area of spheroids plated in different composition under different treatments. Raw data of three replicates and statistical analysis in each time point of the sum-marized data in Fig. 2, Panel B are shown here. Table S4. Differentially expressed genes between CAMA-1 and CAMA-1_ribociclib_resistant cells under no treatment. Detailed data from Additional file 2: Figure S1.
Table S5. Pathway enrichment scores for the Hallmark pathways in
com-parison of untreated CAMA-1 and untreated CAMA-1_ribociclib_resist-ant cells. Additional data to Fig. 3, Panel A. Table S6. Spheroid area of spheroids plated in different composition under different treatments. Raw data of three replicates and statistical analysis in each time point of the summarized data in Fig. 4, Panel B are shown here.
Additional file 2: Figure S1. Heatmap demonstrating the expression of
significantly differentially expressed genes in CAMA-1 and CAMA-1_ribo-ciclib_resistant cells.
Additional file 3: Figure S2. Extended heatmap of Fig. 3, Panel B
incorpo-rating gene symbols.
Abbreviations
CAMA-1_ribociclib_resistant: Ribociclib-resistant CAMA-1 cell line; DAPI: 4′,6-diamidino-2-phenylindole; DMSO: Dimethyl sulfoxide; ER+: Estrogen-receptor-positive; FBS: Fetal bovine serum; FDR: False discovery rate; HER2−: Human epidermal growth factor receptor 2-negative; HR+: Hormone-recep-tor-positive; mTOR: Mammalian target of rapamycin; PBS: Phosphate buffered saline.
Acknowledgements
The authors would like to acknowledge the professional support of the Analytical Cytometry Core of City of Hope National Medical Center and the High-Throughput Genomics Shared Resource at Huntsman Cancer Institute at the University of Utah.
Authors’ contributions
VKG performed most of the experiments, was involved in their analysis and drafted the manuscript. JC, LP, AN performed bioinformatics analysis and contributed to manuscript preparation. RE and PAC contributed to perform-ing experiments. PJM contributed to sequencperform-ing analysis and contributed to manuscript preparation. AHB conceived the study, contributed to the design and the manuscript preparation. All authors read and approved the final manuscript.
Funding
This research and VKG, JC, RE, PAC, LP, AN, PJM, and AHB have been sup-ported by an NIH NCI U54CA209978 grant from the National Cancer Institute. VKG was also supported by the Hungarian Eotvos Scholarship. Open access funding provided by the National Institute of Oncology, Budapest, Hungary is greatly appreciated.
The content is solely the responsibility of the authors and does not necessarily represent the official views of the National Institutes of Health.
Availability of data and materials
The datasets supporting the conclusions of this article are available in the Gene Expression Omnibus repository (https ://www.ncbi.nlm.nih.gov/geo/; accession number: GSE143944). Additional datasets supporting the conclu-sions of this article are included within the article and its additional files.
Ethics approval and consent to participate
Consent for publication
Not applicable.
Competing interests
The authors declare that they have no competing interests.
Author details
1 Department of Medical Oncology and Therapeutics Research, Beckman Research Institute, City of Hope National Medical Center, 1218 S Fifth Ave, Monrovia, CA 91016, USA. 2 Department of Pharmacology and Toxicology, University of Utah, 30 S 2000 East, Salt Lake City, UT 84112, USA.
Received: 4 May 2020 Accepted: 9 June 2020
References
1. O’Leary B, Finn RS, Turner NC. Treating cancer with selective CDK4/6 inhibitors. Nat Rev Clin Oncol. 2016;13(7):417–30.
2. Hertzman Johansson C, Egyhazi Brage S. BRAF inhibitors in cancer therapy. Pharmacol Ther. 2014;142(2):176–82.
3. Reck M, Rodriguez-Abreu D, Robinson AG, Hui R, Csoszi T, Fulop A, et al. Pembrolizumab versus chemotherapy for PD-L1-positive non-small-cell lung cancer. N Engl J Med. 2016;375(19):1823–33.
4. Im SA, Lu YS, Bardia A, Harbeck N, Colleoni M, Franke F, et al. Overall survival with ribociclib plus endocrine therapy in breast cancer. N Engl J Med. 2019;381(4):307–16.
5. Kornblum N, Zhao F, Manola J, Klein P, Ramaswamy B, Brufsky A, et al. Randomized phase II trial of fulvestrant plus everolimus or placebo in postmenopausal women with hormone receptor-positive, human epidermal growth factor receptor 2-negative metastatic breast cancer resistant to aromatase inhibitor therapy: results of PrE0102. J Clin Oncol. 2018;36(16):1556–63.
6. Cross DA, Ashton SE, Ghiorghiu S, Eberlein C, Nebhan CA, Spitzler PJ, et al. AZD9291, an irreversible EGFR TKI, overcomes T790M-mediated resist-ance to EGFR inhibitors in lung cresist-ancer. Cresist-ancer Discov. 2014;4(9):1046–61. 7. Johnson DB, Menzies AM, Zimmer L, Eroglu Z, Ye F, Zhao S, et al. Acquired
BRAF inhibitor resistance: a multicenter meta-analysis of the spectrum and frequencies, clinical behaviour, and phenotypic associations of resist-ance mechanisms. Eur J Cresist-ancer. 2015;51(18):2792–9.
8. Brady SW, McQuerry JA, Qiao Y, Piccolo SR, Shrestha G, Jenkins DF, et al. Combating subclonal evolution of resistant cancer phenotypes. Nat Commun. 2017;8(1):1231.
9. Janiszewska M. The microcosmos of intratumor heterogeneity: the space-time of cancer evolution. Oncogene. 2019;39:2031–9. 10. Kim C, Gao R, Sei E, Brandt R, Hartman J, Hatschek T, et al.
Chemoresist-ance evolution in triple-negative breast cChemoresist-ancer delineated by single-cell sequencing. Cell. 2018;173(4):879–.
11. Koren S, Bentires-Alj M. Breast tumor heterogeneity: source of fitness, hurdle for therapy. Mol Cell. 2015;60(4):537–46.
12. Choi S, Henderson MJ, Kwan E, Beesley AH, Sutton R, Bahar AY, et al. Relapse in children with acute lymphoblastic leukemia involving selec-tion of a preexisting drug-resistant subclone. Blood. 2007;110(2):632–9. 13. Kim H, Zheng S, Amini SS, Virk SM, Mikkelsen T, Brat DJ, et al.
Whole-genome and multisector exome sequencing of primary and post-treat-ment glioblastoma reveals patterns of tumor evolution. Genome Res. 2015;25(3):316–27.
14. Li B, Brady SW, Ma X, Shen S, Zhang Y, Li Y, et al. Therapy-induced muta-tions drive the genomic landscape of relapsed acute lymphoblastic leukemia. Blood. 2019;135:41–55.
15. Gatenby RA. A change of strategy in the war on cancer. Nature. 2009;459(7246):508–9.
16. Gatenby RA, Brown J, Vincent T. Lessons from applied ecology: cancer control using an evolutionary double bind. Cancer Res. 2009;69(19):7499–502.
17. West JB, Dinh MN, Brown JS, Zhang J, Anderson AR, Gatenby RA. Multi-drug cancer therapy in metastatic castrate-resistant prostate cancer: an evolution-based strategy. Clin Cancer Res. 2019;25(14):4413–21.
18. Ricci F, Guffanti F, Damia G, Broggini M. Combination of paclitaxel, beva-cizumab and MEK162 in second line treatment in platinum-relapsing patient derived ovarian cancer xenografts. Mol Cancer. 2017;16(1):97. 19. Ramos P, Bentires-Alj M. Mechanism-based cancer therapy: resistance to
therapy, therapy for resistance. Oncogene. 2015;34(28):3617–26. 20. Bacevic K, Noble R, Soffar A, Wael Ammar O, Boszonyik B, Prieto S, et al.
Spatial competition constrains resistance to targeted cancer therapy. Nat Commun. 2017;8(1):1995.
21. Gatenby RA, Silva AS, Gillies RJ, Frieden BR. Adaptive therapy. Cancer Res. 2009;69(11):4894–903.
22. Zhang J, Cunningham JJ, Brown JS, Gatenby RA. Integrating evolutionary dynamics into treatment of metastatic castrate-resistant prostate cancer. Nat Commun. 2017;8(1):1816.
23. Dhawan A, Nichol D, Kinose F, Abazeed ME, Marusyk A, Haura EB, et al. Collateral sensitivity networks reveal evolutionary instability and novel treatment strategies in ALK mutated non-small cell lung cancer. Sci Rep. 2017;7(1):1232.
24. Zhao B, Sedlak JC, Srinivas R, Creixell P, Pritchard JR, Tidor B, et al. Exploiting temporal collateral sensitivity in tumor clonal evolution. Cell. 2016;165(1):234–46.
25. Soria JC, Ohe Y, Vansteenkiste J, Reungwetwattana T, Chewaskulyong B, Lee KH, et al. Osimertinib in untreated EGFR-mutated advanced non-small-cell lung cancer. N Engl J Med. 2018;378(2):113–25.
26. Long GV, Stroyakovskiy D, Gogas H, Levchenko E, de Braud F, Larkin J, et al. Dabrafenib and trametinib versus dabrafenib and placebo for Val600 BRAF-mutant melanoma: a multicentre, double-blind, phase 3 randomised controlled trial. Lancet. 2015;386(9992):444–51.
27. Lazar V, Martins A, Spohn R, Daruka L, Grezal G, Fekete G, et al. Antibiotic-resistant bacteria show widespread collateral sensitivity to antimicrobial peptides. Nat Microbiol. 2018;3(6):718–31.
28. Dobin A, Davis CA, Schlesinger F, Drenkow J, Zaleski C, Jha S, et al. STAR: ultrafast universal RNA-seq aligner. Bioinformatics. 2013;29(1):15–21. 29. Li B, Dewey CN. RSEM: accurate transcript quantification from RNA-Seq
data with or without a reference genome. BMC Bioinform. 2011;12:323. 30. Love MI, Huber W, Anders S. Moderated estimation of fold change and dispersion for RNA-seq data with DESeq2. Genome Biol. 2014;15(12):550. 31. Hanzelmann S, Castelo R, Guinney J. GSVA: gene set variation analysis for
microarray and RNA-seq data. BMC Bioinform. 2013;14:7.
32. da Huang W, Sherman BT, Lempicki RA. Systematic and integrative analy-sis of large gene lists using DAVID bioinformatics resources. Nat Protoc. 2009;4(1):44–57.
33. Bolger AM, Lohse M, Usadel B. Trimmomatic: a flexible trimmer for Illu-mina sequence data. Bioinformatics. 2014;30(15):2114–20.
34. Li H, Durbin R. Fast and accurate short read alignment with Burrows-Wheeler transform. Bioinformatics. 2009;25(14):1754–60.
35. DePristo MA, Banks E, Poplin R, Garimella KV, Maguire JR, Hartl C, et al. A framework for variation discovery and genotyping using next-generation DNA sequencing data. Nat Genet. 2011;43(5):491–8.
36. Li H, Handsaker B, Wysoker A, Fennell T, Ruan J, Homer N, et al. The Sequence Alignment/Map format and SAMtools. Bioinformatics. 2009;25(16):2078–9.
37. Kim S, Scheffler K, Halpern AL, Bekritsky MA, Noh E, Kallberg M, et al. Strelka2: fast and accurate calling of germline and somatic variants. Nat Methods. 2018;15(8):591–4.
38. Koboldt DC, Zhang Q, Larson DE, Shen D, McLellan MD, Lin L, et al. VarScan 2: somatic mutation and copy number alteration discovery in cancer by exome sequencing. Genome Res. 2012;22(3):568–76. 39. Cingolani P, Platts A, le Wang L, Coon M, Nguyen T, Wang L, et al. A
program for annotating and predicting the effects of single nucleotide polymorphisms, SnpEff: SNPs in the genome of Drosophila melanogaster strain w1118; iso-2; iso-3. Fly (Austin). 2012;6(2):80–92.
40. Wang K, Li M, Hakonarson H. ANNOVAR: functional annotation of genetic variants from high-throughput sequencing data. Nucleic Acids Res. 2010;38(16):e164.
41. Chen X, Chang JT. Planning bioinformatics workflows using an expert system. Bioinformatics. 2017;33(8):1210–5.
•fast, convenient online submission •
thorough peer review by experienced researchers in your field • rapid publication on acceptance
• support for research data, including large and complex data types •
gold Open Access which fosters wider collaboration and increased citations maximum visibility for your research: over 100M website views per year •
At BMC, research is always in progress.
Learn more biomedcentral.com/submissions
Ready to submit your research? Choose BMC and benefit from:
43. LaBarbera DV, Reid BG, Yoo BH. The multicellular tumor spheroid model for high-throughput cancer drug discovery. Expert Opin Drug Discov. 2012;7(9):819–30.
44. Sachs N, de Ligt J, Kopper O, Gogola E, Bounova G, Weeber F, et al. A liv-ing biobank of breast cancer organoids captures disease heterogeneity. Cell. 2018;172(1–2):373–386.e10.
45. Leung BS, Qureshi S, Leung JS. Response to estrogen by the human mammary carcinoma cell line CAMA-1. Cancer Res. 1982;42(12):5060–6. 46. Kytola S, Rummukainen J, Nordgren A, Karhu R, Farnebo F, Isola J, et al.
Chromosomal alterations in 15 breast cancer cell lines by comparative genomic hybridization and spectral karyotyping. Genes Chromosom Cancer. 2000;28(3):308–17.
47. Grolmusz VK, Toth EA, Baghy K, Liko I, Darvasi O, Kovalszky I, et al. Fluores-cence activated cell sorting followed by small RNA sequencing reveals stable microRNA expression during cell cycle progression. BMC Genom. 2016;17(1):412.
48. Grolmusz VK, Karászi K, Micsik T, Tóth EA, Mészáros K, Karvaly G, et al. Cell cycle dependent RRM2 may serve as proliferation marker and pharmaceutical target in adrenocortical cancer. Am J Cancer Res. 2016;6(9):2041–53.
49. Yang C, Li Z, Bhatt T, Dickler M, Giri D, Scaltriti M, et al. Acquired CDK6 amplification promotes breast cancer resistance to CDK4/6 inhibitors and loss of ER signaling and dependence. Oncogene. 2017;36(16):2255–64. 50. Herrera-Abreu MT, Palafox M, Asghar U, Rivas MA, Cutts RJ, Garcia-Murillas
I, et al. Early adaptation and acquired resistance to CDK4/6 inhibition in estrogen receptor-positive breast cancer. Cancer Res. 2016;76(8):2301–13. 51. Condorelli R, Spring L, O’Shaughnessy J, Lacroix L, Bailleux C, Scott V, et al. Polyclonal RB1 mutations and acquired resistance to CDK 4/6 inhibitors in patients with metastatic breast cancer. Ann Oncol. 2018;29(3):640–5. 52. Qiao M, Shapiro P, Fosbrink M, Rus H, Kumar R, Passaniti A. Cell
cycle-dependent phosphorylation of the RUNX2 transcription fac-tor by cdc2 regulates endothelial cell proliferation. J Biol Chem. 2006;281(11):7118–28.
53. Zhao J, Tang H, Zhao H, Che W, Zhang L, Liang P. SEMA6A is a prognostic biomarker in glioblastoma. Tumour Biol. 2015;36(11):8333–40. 54. Hilvo M, de Santiago I, Gopalacharyulu P, Schmitt WD, Budczies J,
Kuhberg M, et al. Accumulated metabolites of hydroxybutyric acid serve as diagnostic and prognostic biomarkers of ovarian high-grade serous carcinomas. Cancer Res. 2016;76(4):796–804.
55. Lu W, Wang X, Liu J, He Y, Liang Z, Xia Z, et al. Downregulation of ARHG-DIA contributes to human glioma progression through activation of Rho GTPase signaling pathway. Tumour Biol. 2016;37:15783–93.
56. Gallaher JA, Enriquez-Navas PM, Luddy KA, Gatenby RA, Anderson ARA. Spatial heterogeneity and evolutionary dynamics modulate time to
recurrence in continuous and adaptive cancer therapies. Cancer Res. 2018;78(8):2127–39.
57. O’Connell MJ, Walworth NC, Carr AM. The G2-phase DNA-damage check-point. Trends Cell Biol. 2000;10(7):296–303.
58. Lee JH, Paull TT. Activation and regulation of ATM kinase activity in response to DNA double-strand breaks. Oncogene. 2007;26(56):7741–8. 59. Reinhardt HC, Aslanian AS, Lees JA, Yaffe MB. p53-deficient cells
rely on ATM- and ATR-mediated checkpoint signaling through the p38MAPK/MK2 pathway for survival after DNA damage. Cancer Cell. 2007;11(2):175–89.
60. Knight T, Luedtke D, Edwards H, Taub JW, Ge Y. A delicate balance—The BCL-2 family and its role in apoptosis, oncogenesis, and cancer therapeu-tics. Biochem Pharmacol. 2019;162:250–61.
61. Fu S, Wang Y, Keyomarsi K, Meric-Bernstam F, Meric-Bernstein F. Strategic development of AZD1775, a Wee1 kinase inhibitor, for cancer therapy. Expert Opin Investig Drugs. 2018;27(9):741–51.
62. Matheson CJ, Backos DS, Reigan P. Targeting WEE1 Kinase in Cancer. Trends Pharmacol Sci. 2016;37(10):872–81.
63. Xu D, Liang SQ, Yang H, Bruggmann R, Berezowska S, Yang Z, et al. CRISPR screening identifies WEE1 as a combination target for standard chemotherapy in malignant pleural mesothelioma. Mol Cancer Ther. 2019;19:661–72.
64. Biankin AV, Waddell N, Kassahn KS, Gingras MC, Muthuswamy LB, Johns AL, et al. Pancreatic cancer genomes reveal aberrations in axon guidance pathway genes. Nature. 2012;491(7424):399–405.
65. Lu D, Wang J, Shi X, Yue B, Hao J. AHNAK2 is a potential prognostic bio-marker in patients with PDAC. Oncotarget. 2017;8(19):31775–84. 66. Zhang M, Iyer RR, Azad TD, Wang Q, Garzon-Muvdi T, Wang J, et al.
Genomic landscape of intramedullary spinal cord gliomas. Sci Rep. 2019;9(1):18722.
67. Cai M, Liang X, Sun X, Chen H, Dong Y, Wu L, et al. Nuclear receptor coactivator 2 promotes human breast cancer cell growth by positively regulating the MAPK/ERK Pathway. Front Oncol. 2019;9:164.
68. Yin J, Fu W, Dai L, Jiang Z, Liao H, Chen W, et al. ANKRD22 promotes progression of non-small cell lung cancer through transcriptional up-regulation of E2F1. Sci Rep. 2017;7(1):4430.
Publisher’s Note