Direct energy utilization in the processing of cocoa beans into
powder
B. S. Ogunsina
1*, M. A. Adeyemi
1, T. A. Morakinyo
2, O. J. Aremu
1, A. I. Bamgboye
3(1. Department of Agricultural and Environmental Engineering, Obafemi Awolowo University, Ile-Ife, Nigeria; 2. Department of Food Science and Technology, Obafemi Awolowo University; Ile-Ife, Nigeria;
3. Department of Agricultural and Environmental Engineering, University of Ibadan, Nigeria)
Abstract: Direct energy utilization in the processing of cocoa beans into powder in some cocoa processing factories located in
South-western Nigeria was investigated. Energy utilization was evaluated for the eight major unit operations that cocoa processing entails, considering energy supply from the national grid and diesel. The data obtained were imputed into existing energy equations to estimate the energy utilized during each unit operation. The results show that the total energy requirements for the processing of raw cocoa bean into powder are 2.23 and 2.38 MJ kg-1 using energy from the national grid
and diesel, respectively. The most energy-intensive operation identified are pressing and milling; which account for 58% and 26.3% of the total energy utilized. For all the unit operations involved in the processing of cocoa bean into powder, diesel engine generator as a power source consumed more energy than that of the national grid. From material balance, an average of 7.2 metric tonnes of cocoa beans yields 2825 kg of cocoa powder and 2925 kg of cocoa butter with about 20.14% weight loss along processing line. This work provides important data for energy generation, planning, utilization and cost in the processing of cocoa beans into powder.
Keywords: cocoa beans, cocoa powder, energy consumption
Citation: Ogunsina, B. S., M. A. Adeyemi, T. A. Morakinyo, O. J. Aremu, and A. I. Bamgboye. 2017. Direct energy utilization
in the processing of cocoa beans into powder. Agricultural Engineering International: CIGR Journal, 19(3): 213–218.
1 Introduction
Value addition and conversion of food crops into different consumer-ready products usually involve energy intensive operations. An understanding of the energy consumption pattern of that particular industry is very vital for effective planning and operation. Energy consumption studies in agricultural processing have attracted serious research attention for some time as concerted efforts are constantly being made to conserve the world’s scarce energy resources and cut down production costs. However, only few industries in downstream of the food supply chain have energy consumption data for their operations (Jekayinfa and
Received date: 2016-08-13 Accepted date: 2017-08-03
∗
Corresponding author: Babatunde Sunday Ogunsina,
Department of Agricultural and Environmental Engineering, Obafemi Awolowo University, Ile-Ife, Nigeria. Tel: +2348059881048. Email: [email protected].
Olajide, 2007). Some food crops and products for which such data were found in literature include palm kernel oil (Jekayinfa and Bamgboye, 2007), cashew nut (Jekayinfa and Bamgboye, 2006), sugar (Abubakar et al., 2010), bread (Akinoso and Ganiyu, 2011), gari (Akinoso and Kasali, 2012) and some grain cereals (Akinoso et al., 2013) but none was found on cocoa.
favourable conditions for growth. With sale price per tonne varying between ϵ1,000 and ϵ2,000, cocoa beans is a significant source of income for small-scale producers who constitute the majority of worldwide producers (Edoh Adabe and Ngo-Samnick, 2014). Long before the oil boom of the mid-70s in Nigeria, cocoa has been a major source of revenue and still remains a large agricultural enterprise in the South-Western part of the country till today. Presently, Nigeria ranks among top cocoa producing countries in the world, occupying the fourth position after Côte d’Ivoire, Ghana and Indonesia (Oseni, 2011; Adeyeye, 2012; Aderinola and Abdulkadri, 2007).
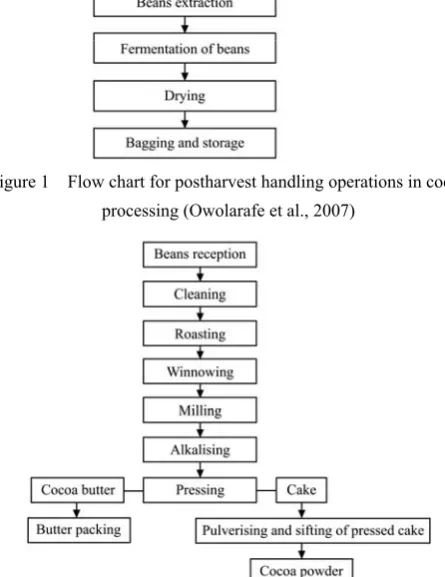
The first major postharvest handling operation (Figure 1) in cocoa processing is the extraction of cocoa beans from harvested pods (breaking the pods and extraction of wet beans from the husks). This aspect has been a manual process for ages, taking a great deal of time and labour; however, few works on cocoa pod breaking machines have been documented (Maduako and Faborode, 1994; Faborode and Oladosu, 1991; Faborode and Dirinfo, 1994). Freshly harvested cocoa pods are broken to extract the wet pulpy beans which are usually allowed to ferment for 4-7 days. During this process, the color of the bean turns dark brown, while the thick pulp thins and gets ripped off while the distinctive flavor and aroma associated with cocoa beans products develop (Owolarafe et al.,2007). The fermented beans are sun-dried to reduce the moisture content from about 60% to 7.5%. Natural or solar drying is the simplest and most popular method and takes 8-15 days with adequate sunshine. In some places, drying could also be achieved artificially at temperatures not exceeding 65°C (International Cocoa Organization ICCO, 2016).
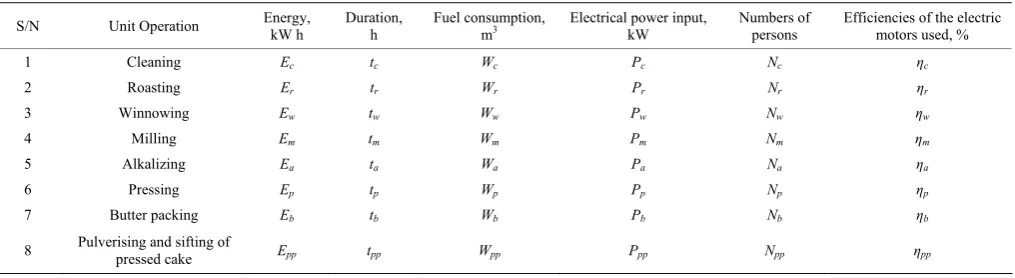
The production of cocoa powder is an eight unit operation comprising cleaning, roasting, winnowing, milling, alkalizing, pressing, butter packing and pulverising and sifting (Figure 2). The dried fermented cocoa beans are cleaned by aspiration and destoning to remove dry pulp debris, stones and other extraneous materials including chaff and pod residue. The beans are roasted (at within a temperature range of 98-120°C for 90-95 mins) to sterilize them, eliminate the acids formed
during fermentation, make the beans amenable to fracture during decortication and enhance the development of the sensory attributes typical of chocolate (Edoh Adabe and Ngo-Samnick, 2014). A winnowing machine is used to remove the shells from the decorticated beans to leave just the cocoa nibs. The cocoa nibs are then milled to create cocoa liquor (cocoa suspended in cocoa butter). The temperature and degree of milling usually vary according to the particle size distribution of the nibs and the product required. The cocoa liquor is pumped to a reactor that combines it with potassium carbonate and water (alkalizing) in order to further develop the flavour and colour of the product. The liquor is pressed mechanically to obtain cocoa butter and a solid mass called cocoa pressed cake. Usually, the processor determines the extent of butter to be extracted from the liquor; this often depends on the intended fat content of the cocoa powder. The pressed cake is broken into small pieces, dried and pulverized to obtain cocoa powder (ICCO, 2016).
Figure 1 Flow chart for postharvest handling operations in cocoa processing (Owolarafe et al., 2007)
Figure 2 Flow chart for processing cocoa beans into powder
20% or lower are some of the reasons why it is vital to document energy consumption data for cocoa processing. Although, cocoa is an important cash crop in Nigeria, hitherto, energy consumption data for cocoa processing are rarely found in literature. In this work, energy consumption during the processing of cocoa beans into powder was investigated with the view to provide rationale for optimizing energy consumption utilization in the industry.
2 Materials and methods
Direct energy consumption in all unit operations in the processing of cocoa beans into powder was investigated considering three cocoa processing companies with similar unit operations and processing facilities within their useful years. The major machines which were identified include: aspirator, de-stoner, screens, roaster, ball mill, differential mill and press. Data were collected simultaneously within the same period. An estimated average of 7.2 metric tonnes was processed per batch and three observations were made in each company. All the companies depended on energy derived from the national grid and diesel. For each unit operation, energy data comprising electricity consumption, fuel consumption, calorific value of the fuel, quantity of raw material used, duration of unit operation and labour requirement were determined. The data were fitted into existing equations for describing energy consumption in manufacturing operations as reported by Jekayinfa and Bamgboye (2004). For all operations utilizing energy derived from the national grid, the electrical energy consumed, E (kW h) is a function of the rated power of motor, P (kW) and the time taken to complete the operation, t (h) and may be expressed as Equation (1)
(Jekayinfa and Bamgboye, 2006):
E Ptα ⇒ =E ηPt (1)
where, η = efficiency of the electric motor used.
If the calorific value of the diesel fuel used for generating electricity is C (J m-3), the electrical energy consumed is directly proportional to the quantity of fuel used, W (m3), as Equation (2):
f
E Wα ⇒ =E C W (2)
In addition, an error factor of 10% was used to estimate annual electricity bill for each unit operation (Jekayinfa and Bamgboye, 2004). Jekayinfa and Bamgboye (2004) affirmed the findings of Odigboh (1997) that the average power output that a normal human being in the tropics will sustain for an 8-10 h workday is 0.075 kW.
Based on the foregoing, the human energy consumed may be estimated as Equation (3):
Eh = 0.075 × N × t (3)
where, Eh is the human energy consumed, kW h; N = the
number of persons engaged in the operation; t = the man-hour required, h.
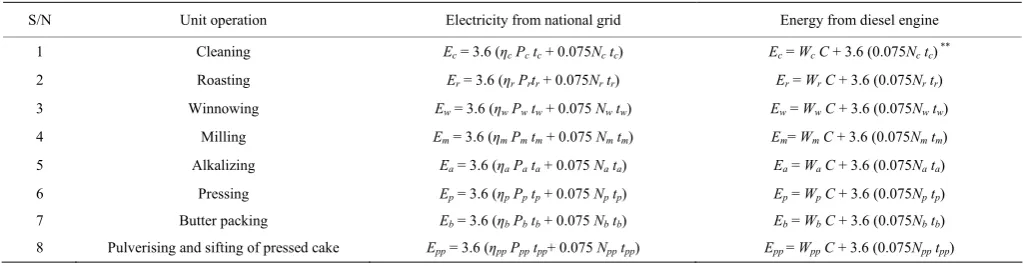
For each unit operation, the notation for each component of energy equation is expressed detail in Table 1. Considering that 1 kWh = 3.6 MJ of energy and the heating value of diesel fuel, C (J kg-1 or J l-1) remains constant for all unit operations, energy consumption for each unit operation in cocoa processing may be derived by the following general Equations (4) and (5).
When using energy from the national grid, as Equation (4):
E = 3.6[(η × P× t) + (0.075 × N × t)] (4) When using diesel fuelled generator, as Equation (5):
E = (W × C) + 3.6(0.075 × N × t) (5)
Table 1 Notations and symbols for energy parameters
S/N Unit Operation Energy, kW h
Duration, h
Fuel consumption,
m3 Electrical power input, kW Numbers of persons Efficiencies of the electric motors used, %
1 Cleaning Ec tc Wc Pc Nc ηc
2 Roasting Er tr Wr Pr Nr ηr
3 Winnowing Ew tw Ww Pw Nw ηw
4 Milling Em tm Wm Pm Nm ηm
5 Alkalizing Ea ta Wa Pa Na ηa
6 Pressing Ep tp Wp Pp Np ηp
7 Butter packing Eb tb Wb Pb Nb ηb
8 Pulverising and sifting of
The respective equations associated with each unit operation may be further detailed as shown in Table 2. Values for each parameter reported were average values of three determinations.
Hence, at a given production rate, the total energy consumption involved in the processing of cocoa beans into powder as Equation (6):
ET =Ec+Er+Ew+Em+Ea+Ep+Eb+Epp (6)
Table 2 Energy equation for each unit operations in cocoa beans processing
S/N Unit operation Electricity from national grid Energy from diesel engine
1 Cleaning Ec = 3.6 (ηcPc tc + 0.075Nctc) Ec = WcC + 3.6 (0.075Nc tc) **
2 Roasting Er = 3.6 (ηrPrtr + 0.075Nrtr) Er = WrC + 3.6 (0.075Nr tr)
3 Winnowing Ew = 3.6 (ηwPwtw + 0.075 Nwtw) Ew = WwC + 3.6 (0.075Nw tw)
4 Milling Em = 3.6 (ηmPm tm + 0.075 Nm tm) Em= WmC + 3.6 (0.075Nmtm)
5 Alkalizing Ea = 3.6 (ηaPa ta + 0.075 Na ta) Ea = Wa C + 3.6 (0.075Na ta)
6 Pressing Ep = 3.6 (ηpPp tp + 0.075 Np tp) Ep = Wp C + 3.6 (0.075Np tp) 7 Butter packing Eb = 3.6 (ηbPb tb + 0.075 Nb tb) Eb = Wb C + 3.6 (0.075Nb tb) 8 Pulverising and sifting of pressed cake Epp = 3.6 (ηppPpp tpp+ 0.075 Npp tpp) Epp = WppC + 3.6 (0.075Npp tpp)
3 Results and discussion
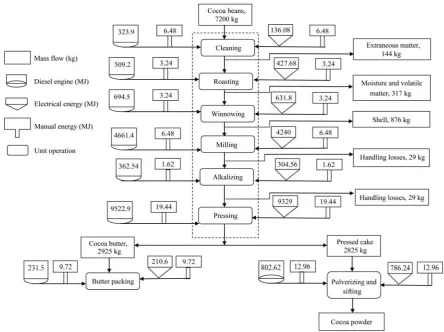
Figure 3 describes the entire operations involved in the processing of cocoa beans into powder showing details of energy and material balance. The material balance indicates consistent decrease after each unit operation. During cleaning, 144 kg was lost; attributable to dirt, stones and other extraneous matter. At the end of roasting, 317.52 kg got lost due to moisture and volatile matter. The weight lost during winnowing, 876.48 kg may be largely attributed to the removal of shell during separation. The highest percent weight loss was recorded in this unit. The presence of shell residue often presents the risk of high machine wear rate during milling. It was estimated that an average of 29.31 kg weight loss was observed during milling of cocoa nibs, while 29.17 kg was lost during alkalizing. These may both be attributed to losses arising from handling. From the material balance, about 2925 kg of cocoa powder and 2825 kg of cocoa butter were obtained when 7.2 metric tonnes of cocoa beans was processed into powder. About 1450 kg loss in the weight of the material corresponds to an overall of 20.14% weight loss.
In Figure 3, it is shown that a total of 142.56 MJ of energy is required to clean 7.2 metric tonnes of raw cocoa beans; whereas, an estimated 430.92 MJ of energy is required for roasting. This is higher than the energy consumption during the roasting of palm-kernel (360.13 MJ) in a medium palm-kernel oil mill (Jekayinfa and Bamgboye, 2004). Energy consumption details for
other unit operations are shown in Table 3. From these results, it was observed that the highest electrical energy (9348.8 MJ) was consumed during pressing; amounting to 58% of the total.
Figure3 Energy flow and material balance for the processing of cocoa beans into powder
Table 3 Details of energy utilization during processing of cocoa beans into powder
S/N Unit operation Electricity from national grid* Manual energy* Energy from diesel engine* Electricity + manual* diesel + manualEnergy from * % of total electricity % of total energy from diesel
1 Cleaning 136.08 6.48 323.96 142.56 330.44 0.9 1.9 2 Roasting 427.68 3.24 509.24 430.92 512.48 2.7 3.0 3 Winnowing 631.80 3.24 694.51 635.04 697.75 3.9 4.1 4 Milling 4240 6.48 4661.38 4246.46 4667.86 26.3 27.2 5 Alkalizing 304.56 1.62 362.54 306.18 364.16 1.9 2.1 6 Pressing 9329.04 19.44 9522.97 9348.48 9542.41 58.0 55.6 7 Butter Pressing 210.6 9.72 231.50 220.32 241.22 1.4 1.4
8 Pulverising sifting and
powder packing 786.24 12.96 802.62 799.20 815.58 5.0 4.7 Total 16068 63.18 17108.72 16131.18 17171.9
Note: *All values reported are in MJ.
Using modified energy accounting symbols (Singh, 1998), energy and mass flow diagram was constructed (Figure 3). The respective average values of energy consumed during each unit operation are shown in Table 3. The total energy requirement for converting 7.2 metric tonnes of raw cocoa beans into cocoa powder is 16068 MJ (2.23 MJ kg-1) when using electricity from national grid and 17108.72 MJ (2.38 MJ kg-1) with diesel generator respectively. However, it suffices to remark that in a country like Nigeria where electricity is presently unstable, the type and magnitude of energy requirement for any
industrial operation is a function of the technology involved and production capacity. As a result of epileptic power supply in Nigeria, most factories acquire a stand-by diesel generator to augment energy supply.
4 Conclusions
the processing of cocoa beans into powder is 16068 and 17108.72 MJ corresponding to 2.23 MJ kg-1 and 2.38 MJ kg-1 using national grid and diesel engine, respectively. The most energy-intensive operation identified were pressing and milling accounting for about 58% and 26.3% of the total electrical energy expenditure respectively. The study showed that more energy is expended in each unit operation when using diesel engine generator than when getting energy supply directly from the national grid for all unit operations involved in the processing of cocoa bean into powder.
References
Abubakar, M. S., B. Umar, and D. Ahmad. 2010. Energy use patterns in sugar production: A case study of Savannah Sugar Company, Numan, Adamawa State, Nigeria. Journal of Applied Poultry Research, 6(4): 377–382.
Aderinola, E. A., and A. O. Abdulkadri. 2007. Resource productivity of mechanized food crop farm in Kwara State Nigeria. Delta Agriculturist, 2: 59–71.
Adeyeye, C. T. 2012. Cocoa production and price stability: An industrial relations. Available at: http://www.ilo.int/public/ english/iira/documents/congresses/regional/lagos2011/4thsessi on /session4b/cocoa.pdf. Retrieved on 22/4/2014.
Akinoso, R., A. A. Olapade, and A. A. Akande. 2013. Estimation of energy requirements in cowpea flour production in Nigeria.
Focusing on Modern Food Industry,2(2): 86–90.
Akinoso, R., and I. A. Ganiyu. 2011. Estimation of energy requirements in small-scale bread making. Ladoke Akintola University of Technology Journal of Engineering and Technology, 6(2): 81–85.
Akinoso, R., I. A. Lawal, and A. K. Aremu. 2013. Energy requirements of size reduction of some selected cereals using attrition mill. International Food Research Journal, 20(3): 1205–1209.
Akinoso, R., and W. O. Kasali. 2012. Energy expended in processing gari-cassava (Manihot esculenta Crantz) flakes-using three levels of mechanization. Pakistan Journal of Scientific and Industrial Research, Series B Biological Sciences, 55: 114–116.
Edoh Adabe, K., and E. L. Ngo-Samnick. 2014. Cocoa: production and processing. Available at: http://publications.cta.int/media/ publications/downloads/1800_PDF.pdf. Retrieved on 10/03/2016.
Faborode, M. O., and G. A. Oladosu. 1991. Development of a cocoa pod processing machine. The Nigerian Engineers, 26(4):
26–31.
Faborode, M. O., and P. R. Dinrifo. 1994. A mathematical model of cocoa pod deformation based on Hertz theory force.
International Agrophysics, 8(3): 403–409.
International Cocoa Organization (ICCO). 2016. Processing cocoa. Available at: http://www.icco.org/aboutcocoa/processing- cocoa.html. Retrieved on 3/10/2016.
Jekayinfa, S. O., and A. I. Bamgboye. 2004. Energy requirements for palm-kernel oil processing operations. Nutrition & Food Science, 34(4): 166–173.
Jekayinfa, S. O., and A. I. Bamgboye. 2006. Estimating energy requirements in cashew (Anacardium occientale L.) nut processing operations. Energy, 31(8): 1305–1320.
Jekayinfa, S. O., and A. I. Bamgboye. 2007. Development of equations for estimating energy requirements in palm-kernel oil processing operations. Journal of Food Engineering, 79(1): 322–329.
Jekayinfa, S. O., and J. O. Olajide. 2007. Analysis of energy usage in the production of three selected cassava-based foods in Nigeria. Journal of Food Engineering,82(2): 217–226. Maduako, J. N., and M. O. Faborode. 1994. Characterization of the
breaking behaviour of whole cocoa pods. Journal of Agriculture Engineering Research, 59(2): 89–96.
Odigboh, E. U. 1997. Machines for crop production. In Handbook of Agricultural Engineering-Plant Production Engineering. Ch. 1, B. A. Stout, ed. St. Joseph Michigan, USA: CIGR Handbook of Agricultural Engineering.
Olatoye, K. K., R. Akinoso, A. I. Lawal, and K. A. Babalola. 2014. A comparative study of energy demand of instant-pounded yam flour production methods. Journal of Energy Technologies and Policy, 4(3): 14–18.
Oseni, J. O. 2011. Value chain analysis of cocoa in Ondo State, Nigeria. In From farm to table: Wither NigeriaProceedings of the 12th Annual Conference of the Nigerian Association of Agriculture Economists, 232-236. Benin city, Nigeria: 13-16 November.
Othman, A., A. Ismail, N. A. Ghani, and I. Adenan. 2007. Antioxidant capacity and phenolic content of cocoa beans.
Food Chemistry, 100(4): 1523–1530.
Owolarafe, O. K., B. S. Ogunsina, A. S. Gbadamosi, O. O. Fabunmi. 2007. Application of coefficient of friction to the separation of cocoa husk-beans mixture. Journal of Food Process Engineering, 30(5):584–592.
Pimentel, F. A., J. A. Nitzke, C. B. Klipel, and E. V. de Jong. 2010. Chocolate and red wine-A comparison between flavonoids content. Food Chemistry, 120(1): 109–112.
Singh, R. P. 1998. Energy accounting in food process operations,