An Intrusion Detection Model Based on Danger Theory
for Wireless Sensor Networks
https://doi.org/10.3991/ijoe.v14i09.8625
Linlin Li, Liangxu Sun!!", Gang Wang
University of Science and Technology Liaoning, Anshan, China
Abstract—For the intrusion detection problem in Wireless Sensor Networks, an intrusion detection model based on the Danger Theory is proposed. The model has two layers including danger perception and control decision and detects intrusion by a multi-node cooperation mechanism. The model uses Danger Theory instead of SNS as the artificial immune theory basic, perceives dangers with Projection Pursuit Algorithm to handle the high dimension problem of network traffic information, classifies dangers with Extreme Learning Machine algorithm and uses Beta distribution trust evaluation to ensure the trust between nodes. By the simulations in the MATLAB with KDD CUP99 dataset, it is proved that the danger perception with Projection Pursuit Algorithm is effective, the classification speed of ELM algorithm is faster than SVM algorithm, the proposed model based on Danger Theory is better than the SNS model at the aspects of false negative rate, false positive rate and energy consumption.
Keywords—Intrusion Detection, Wireless Sensor Networks, Danger Theory, Extreme Learning Machine, Projection Pursuit, Beta Distribution.
1
Introduction
fundamentals of intrusion detection techniques, as well as the various energy saving mechanisms used in different architectural models [5]. Jin proposed an intrusion detection scheme based on the use of both a multi-agent system and a node trust value [6]. Xiao put forward a real-time intrusion detection model. The model elaborates the biological differentiation mechanism of dendritic cells [7]. Shi proposed a state transition model based on the continuous time Markov chain to study the behaviors of the sensors in a WSN under internal attack [8]. Yang started from the main idea of changes leading to danger,and established an adaptive danger signal extraction model based on finding changes[9]. Zhang presented an immune-inspired intrusion detection model in virtual machines of cloud computing environment, denoted IVMIDS, to ensure the safety of user-level applications in client virtual machines [10]. Rimiru described an integrated innate and adaptive immune system architecture which is shown to incorporate many properties of natural immune systems [11].Seresht proposed an agent-based approach using artificial immune system paradigms as a successful mechanism for a distributed intrusion detection system[12]. it is tremendously challenging to identify such malicious behavior using traditional intrusion detection systems in Wireless Sensor Networks. Shamshirband introduced a cooperative-based fuzzy artificial immune system which was a modular-based defense strategy derived from the danger theory of the human immune system [13]. Huang proposed Extreme Learning Machine (ELM) algorithm which was a supervised learning algorithm for Single-hidden Layer Feed-forward Neural Networks (SLFNs) [14]. ELM need set only once the weight parameters between the input and hidden layers and the bias vector parameters of the hidden layers. Other algorithms based on gradient need often repeatedly adjust the parameters through iterations, so ELM has advantages in learning speed and generalization capability, and is more applicable to solve intrusion detection problem than other algorithms such as Back Propagation (BP) neural network and Support Vector Machine (SVM). Al-Yaseen proposed a multi-level hybrid intrusion detection model that uses support vector machine and extreme learning machine to improve the efficiency of detecting [15]. Ge proposed to use projection pursuit(PP) algorithm to solve the problem of intrusion detection of wireless sensor networks(WSNs) and PP algorithm can turn high-dimensional node properties to low-dimension space and achieve accurate aggregation of node data [16]. The node data in WSNs has a high dimension feature which can cause the dimension disaster problem. Meanwhile, the high dimension data with related protocols and statistic features may have a negative impact on intrusion detection in WSNs. The problem above can be solved by Projection Pursuit algorithm. At present, the intrusion detection research is mainly based on SNS theory, the research based on Danger Theory also mainly focus on the host or computer networks, and the research for WSNs are not much.
2
System Model
According to Danger Theory, the suffering cell can send danger signal and build a danger zone in its surrounding. In the zone, the antigen can be captured by the APC (Antigen Presenting Cell). APC can present antigen, provide synergy stimulation signal and stimulate immune response. In immune response, the lymph cell can produce antibody to match the antigen in the danger zone.
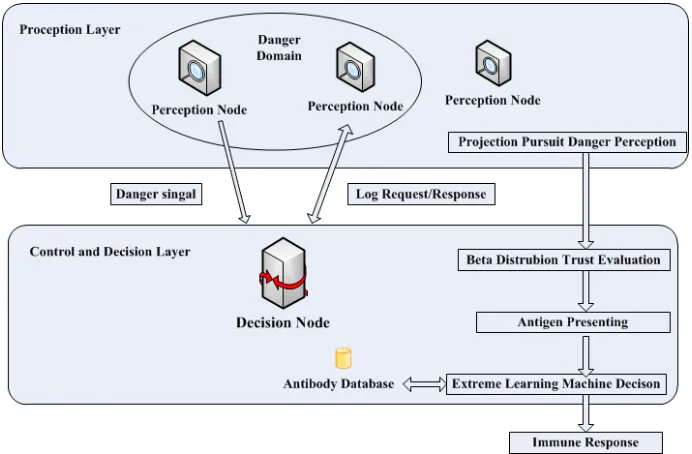
Based on Danger Theory, the intrusion detection process is divided into three stages including danger perception stage, antigen presenting stage and intrusion decision stage. That each node runs independently a complete detection instance at the same time can cause the energy consumption problem, so the model proposes to use hierarchical structure to realize collaborative detection. The proposed intrusion detection model is shown as figure 1. The perception node need only detect its own property changes to perceive the danger. After receiving the danger signal, the decision node need determine the danger degree and zone, and request network traffic log of nodes in the danger zone. The nodes provide network traffic log cooperatively to present the antigen. The decision node forms and maintains the antibody dynamically, and matches the antibody with the antigen to determine whether there is an intrusion. If there is an intrusion, the proposed model will stimulate immune response. Meanwhile, it can evaluate the trust between nodes dynamically with Beta distribution method.
2.1 Danger Perception
In the biological immune system, if a cell dies due to a normal reason, the cell entity will be removed before the decomposition. But if a cell dies due to an abnormal reason, the cell entity will break down and send the danger signal. Similarly, in the proposed model, the node perceives its own property changes to perceive the danger and send the danger signal. Usually, the node can perceive the danger and make reaction before losing working ability. The node property changes may mean a potential danger. The node properties about the physical layer and media access control layer are available locally. Besides, some statistic properties are also defined as the dimension information of danger perception such as the power energy decline rate, the conflict back-off frequency, the average back-off duration, the acknowledge success rate, the data frame receive frequency, the data frame send frequency and etc. In the proposed model, the perception node processes and analyzes the high dimension data defined by the protocols and statistic properties with Projection Pursuit algorithm.
Firstly, the normalized processing is as followed:
!!"!!!" !"#!!
!!"#
!!!"#!!!!"#!!"#$%!&'()"*$%!&'+ (1)
Where
n is the sample count; m is the dimension count;
!!"!"# is the data of the dimension j of the sample i;
!!!"# is the minimum of the dimension j;
!!!"# is the maximum of the dimension j;
!!" is the normalized value of !!"!"#;
Secondly, the linear projection is as followed:
!!! !!!!!!!!"! ! ! !!!! ! (2)
Where
!! is the projection value of the sample i;
! ! !!!!!! ! !! is the projection direction;
Thirdly, the projection norm is as followed:
! ! ! !!!!! (3)
Where
!!! !!!! !! !
! !!!
! ! ! !!!! ! ! (4)
!!! !!!! !!!! ! ! !!" ! ! ! !!" (5)
!! is the classification density;
!!"#! ! ! !!, is the window width parameter of the projection point density;
!!"! !!! !!! !!! ! !!!! ! !;
! ! ! !!" is unit step function, if ! ! !!", function value is 1, else is 0;
The more !! is big, the more the classification is accurate and clear.
Finally, the best projection direction is as followed:
!"#$ ! ! !"# !!!!!! ! !
!!
!
!!! ! ! (6)
Projection Pursuit algorithm is described as the optimization problem above. The proposed model computes the optimal projection direction with the Genetic Algorithm. According to the optimal projection direction, it calculates the projection value level of node properties, and by the classification analysis judges whether the node is under an attack and needs sending the danger signal. The level ! is defined as threshold value. If the level is more than!, the node can be in danger and should send danger signal to the decision node. The danger signal can be defined as:
!" ! !"! !" (7)
Where
TS is the timestamp when the node sends the danger signal; DL is the projection value level;
2.2 Antigen Presenting
Once the decision node receives danger signal, it will build a danger zone. The zone center is the node that sends danger signal. The zone radius is related to the danger degree which unit is the hop count. The zone radius is defined as followed:
!" !!! ! !"!!!!"!! (8)
Where
nd is the count of the danger signal received in a time period;
!"!is the level of the danger signal i;
h is the hop coefficient of danger degree; !"!
!"
!!! is the danger degree;
The decision node broadcasts traffic log request to the nodes in the danger zone. If the danger zones overlap, the decision node will select the nearest node to upload network traffic logs. After the decision node receives traffic logs of all nodes in the zone or waits for the timeout, the decision node will stop collection and present antigen. The antigen is defined as followed:
!" ! ! ! !!!!"!! !"#!! !" (!) Where
!"!is the id of node i;
!"#! is the network traffic log of node i;
!" is the neighbor node list;
2.3 Intrusion Decision
The decision node analyzes the presented antigen and determines whether there is an intrusion behavior with ELM algorithm. For a single hidden layer neural network with ! hidden layer neurons, N samples !!! !! are defined as followed:
Where
!!! !!!! !!!! ! !!!! ! ! !!!! ! !!!! ! !! (10)
!!! !!!!!!!! ! ! !!" !! !!! ! ! !!!! ! ! ! (11)
The neural network is described as followed:
!! !
!!! ! !!! !!! !! ! !!!! ! !!!! ! !! (12)
Where
! ! is the activation function RBF(Radial Basis Function) and defined as followed:
! !!! !!! ! ! !"#
! !!!!!
!!! (13)
!!! !!! !!! ! !!! ! is the center of kernel function i, !!! is the bandwidth;
!! is the input weight, defined as followed:
!!! !!!! !!!! ! ! !!" ! (14) !! is the output weight;
!! is the bias of hidden layer neuron i;
The learning goal is to minimize the output error, namely, exist !!! !!! !! to minimize
!! !
!!! ! !!! !!!!! ! !! ! ! !!!!! ! ! ! (15)
According to ELM algorithm proof [11], once !
! and !! are determined randomly, the training problem can become a least square solution problem, so !! can be determined easily.
2.4 Node Trust
under !! ! value control. The node trust conforms to Beta distribution which is described as followed:
!"#$ !! ! ! !"#$ ! ! !! ! !!!!!! !!!!!!!!! (16)
! !! ! ! !!!!! ! ! ! !!!!"
! (17)
! ! !!!!! (18)
The decision node stores the trust evaluation of each node and updates the trust evaluation according to the reported data. The node trust evaluation is described as followed:
!!! ! !"#$ !" !!! !" ! ! !!"!!"!!!"!! (19)
Where
si is the count which the reported data is trustful by node i in a time period. fi is the count which the reported data is not trustful by node i in a time period. If the decision node judges that there isn’t an intrusion, while the node i reports the danger signal, it will punish the node, fi=fi+1; otherwise, it can encourage the node, si=si+1.
If the decision node judges that there is an intrusion, while the node i reports the danger signal, it will encourage the node, si=si+1; otherwise, it can punish the node, fi=fi+1.
Considering node dynamic trust evaluation problem, the node can introduce the parameter ! ! !!! to adjust the influence caused by the history and the current evaluation value.
!!!! !!!!! ! ! ! !!! (20) Where
!!! is the newest trust evaluation value of node i; !!! is the history trust evaluation value of node i; !!! is the current trust evaluation value of node i;
Once !!!is less than the threshold value defined in advance, the node i will be
removed.
3
Simulation and Analysis
3.1 Projection Pursuit Lab
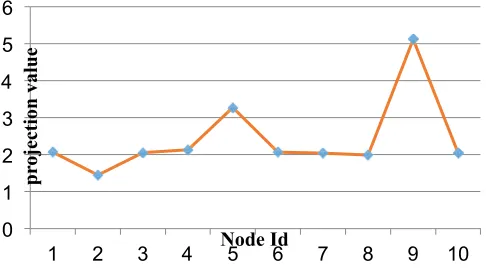
The KDD CUP 99 data is including normal and abnormal category. Select 10 sensor nodes with 41 properties for training by the normal category data. The projection pursuit of these sensor nodes is expressed as a matrix of 10*41 dimension, and then every element of the matrix is normalized by the formula (1). Then the Genetic Algorithm is used to calculate projection pursuit based on the normalized node information, and the optimal projection direction is determined. Finally, the projection values of these node properties are calculated by formula (3), and the abnormal nodes are determined by the frustration of projection values and send danger signals. Three abnormal categories of attack data, namely DOS, buffer_overflow and multihop, are selected to attack the nodes.
Do the tests for 10 sensor nodes where simulate respectively an attack above to the 2nd, 5th and 9th node and normal data to others. The result is shown as figure 2. The property projection values of the 2nd, 5th and 9th node have obvious fluctuation which is consistent with the selection of attack node, so the danger perception with Projection Pursuit Algorithm is effective.
Fig. 2. Projection Pursuit lab result
3.2 ELM Lab
The KDD CUP 99 data are derived from traditional networks, many properties do not exist or are unimportant in WSN, so some interference properties can be removed during data preprocessing. Select randomly 1000, 2000,…,10000 size of data as 10 groups training data from the preprocessed kddcup.data_10_percent_corrected data set, and respectively use the SVM and ELM algorithm for training test. The activation function used by ELM is RBF. The number of neurons in input layer is related to the feature vector of input sample. the parameter is set to 30 in the lab. According to the Kolmogorov theorem, there is an approximate relationship between the number of neurons in input layer and the number of hidden layer neurons: k=2m+1, in which, m is the number of input neurons and k is the number of hidden neurons. The parameter
0 1 2 3 4 5 6
1 2 3 4 5 6 7 8 9 10
pr
ojection value
in the lab was set to 61. The result is shown as figure 3. With the training data size increases, the classification speed of the ELM algorithm is faster than the SVM algorithm.
Fig. 3. ELM lab result
The ELM algorithm is a supervised learning algorithm for SLFNs. The weight parameters between the input layer and hidden layer, as well as the bias vector parameters on hidden layer are set once, while other algorithms based on the gradient learning need adjust and refresh parameters repeatedly through iteration. the ELM algorithm only needs to solve a minimum norm by least square method. So the training time of the ELM algorithm is less than the SVM algorithm.
3.3 Model Lab
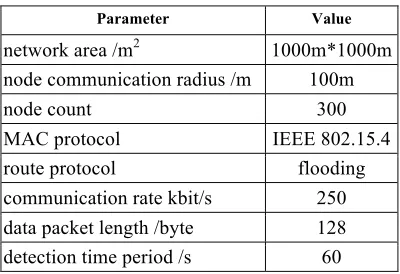
Nodes are randomly distributed in the network, and the specific network parameters are shown in Table 1.
Table 1. Network parameters
Parameter Value
network area /m2 1000m*1000m
node communication radius /m 100m
node count 300
MAC protocol IEEE 802.15.4
route protocol flooding
communication rate kbit/s 250
data packet length /byte 128
detection time period /s 60
0 0,5 1 1,5 2 2,5
1 2 3 4 5 6 7 8 9 10
Tr
aining T
im
e/s
Test Data/103
Select at random location of attack node and simulate packet blocking attack. The attack nodes broadcast a meaningless data packet around every 60s in order to reduce the availability of channel and increase the energy consumption of surrounding nodes. For every count of attack nodes, namely 2,4,6,8,10, the simulation runs independently for 10 times, and the average values are as the simulation result.
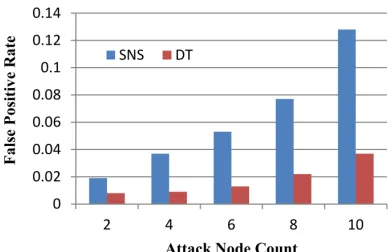
The detection method of SNS model is to run the test on a single node and to judge an intrusion by the network traffic information in 2 hops scope got by promiscuous mode listen. Do the test to compare the proposed Danger Theory model with the SNS model. The result is shown as figure 4 and 5. When the attack node number is small, the two models can both detect the intrusion accurately and the false negative rates are both 0 almost. While with the attack node number increases, the proposed model can obtain more global information from nodes in danger zone, not to be limited to the traffic information of one node, and so it has better detection result.
In the SNS model, the nodes compare or match the collected abnormal traffic with the normal traffic. Once the abnormal is found, judge that an intrusion is detected. While in the Danger Theory Model, it needs two steps to judge an intrusion. The first step is that the percept node perceives a danger and sends a danger signal; the second step is that the decision node judges the intrusion with the global traffic from a special danger zone, so the proposed model can reduce effectively the false positive rate.
Fig. 4. False negative rate test result
3.4 Energy Consumption Lab
In SNS model, the nodes have always energy consumption because of continuous listening to network traffic information in promiscuous mode. In the proposed model, the nodes have energy consumption only when perceiving danger in the normal awaken state and uploading the network traffic information after receiving uploading request. The comparison of energy consumption is shown as figure 6. When the attack node count is small, the proposed model is better than the SNS model. But with the attack node count increasing, the node count that has perceived danger and sent danger signal increases accordingly, so the energy consumption made by the antigen presenting also increases. Meanwhile the node trust evaluation can also increase the energy consumption. But once the abnormal node is detected, it will be removed from the network, the energy consumption can also decrease to a certain extent. The energy consumption of the two models is nearly same on the whole when the attack node count is big.
Fig. 6. Energy consumption lab result
4
Conclusion
The paper proposes an intrusion detection model for Wireless Sensor Networks based on danger theory with Extreme Learning Machine and Projection Pursuit algorithm. Compared with the SNS model and SVM algorithm, the proposed model has some characteristics as followed:
1.The proposed model uses the more reasonable Danger Theory instead of SNS as the artificial immune theory basic.
2.The proposed model uses the Projection Pursuit Algorithm to perceive danger in order to handle the high dimension problem of network traffic information.
4.The proposed model uses Beta distribution trust evaluation to ensure the trust between nodes.
5.The energy consumption of the proposed model on the whole is better than SNS although some processes may increase the energy consumption to a certain extent.
5
Acknowledgements
The research acknowledges the foundation support from the University of Science and Technology University Youth Fund (2014QN19), Innovation and Entrepreneurship Teaching Reform Projects (cxcy-2015-29, cxcy-2015-30)
6
References
[1]M Burnet. (1959). Auto-immune disease. I. Modern immunological concepts. British Medical Journal. 2. https://doi.org/10.1136/bmj.2.5153.645
[2]P. Matzinger. (1994). Tolerance, danger and the extended family. Annual Review Immunology.1, 12 https://doi.org/10.1146/annurev.iy.12.040194.005015
[3]S. Forrest, A. S. Perelson, L. Allen, R Cherukuri. (1994). Self-nonself discrimination in a computer. Proceedings of 1994 IEEE Computer Society Symposium on Research in Security and Privacy, May 16-18; Oakland, USA https://doi.org/10.1109/RISP. 1994.296580
[4]Butun, I. Morgera, S. D. Sankar, R.(2014). A Survey of Intrusion Detection Systems in Wireless Sensor Networks. IEEE Communications Surveys & Tutorials. 1, 16
https://doi.org/10.1109/SURV.2013.050113.00191
[5]Ghosal, A. and S. Halder (2017). A survey on energy efficient intrusion detection in wireless sensor networks. Journal of Ambient Intelligence and Smart Environments 2,9
https://doi.org/10.3233/AIS-170426
[6]Jin, X. J., et al. (2017). Multi-agent trust-based intrusion detection scheme for wireless sensor networks. Computers & Electrical Engineering 59. https://doi.org/10.1016/j.compe leceng.2017.04.013
[7]Xiao, X. and R. R. Zhang (2017). Study of Immune-Based Intrusion Detection Technology in Wireless Sensor Networks. Arabian Journal for Science and Engineering 8,42.
https://doi.org/10.1007/s13369-017-2426-1
[8]Shi, Q., Qin, L.,Song, L. P.,Zhang, R. P.,Jia, Y. F. (2017) A Dynamic Programming Model for Internal Attack Detection in Wireless Sensor Networks. Discrete Dynamics in Nature and Society. https://doi.org/10.1155/2017/5743801
[9]Yang, C. and T. Li (2015). Research of Danger Signal Extraction Based on Changes in Danger Theory. Computer Science. 8,42.
[10]Zhang, R. and X. Xiao (2018). Study of Danger-Theory-Based Intrusion Detection Technology in Virtual Machines of Cloud Computing Environment. Journal of Information Processing Systems. 1,14.
[11]RM Rimiru, G Tan, O Fedha. (2014) An Architecture for an Integrated Innate and Adaptive Artificial Immune System (INIAIS - A Novel AIS Architecture). International Journal of Unconventional Computing. 1-2, 10
[13]Shamshirband, S., NB Anuar, MLM Kiah, VA Rohani. (2014) Co-FAIS: Cooperative fuzzy artificial immune system for detecting intrusion in wireless sensor networks. Journal of Network and Computer Applications. 42 https://doi.org/10.1016/j.jnca.2014.03.012
[14]Huang G B, Zhu Q Y, Siew C K. (2006) Extreme Learning machine: Theory and Applications. Neurocomputing. 1, 70 https://doi.org/10.1016/j.neucom.2005.12.126
[15]Al-Yaseen, W. L.Othman, Z. A. Nazri, M. Z. A. (2017) Multi-level hybrid support vector machine and extreme learning machine based on modified K-means for intrusion detection system. Expert Systems with Applications 67 https://doi.org/10.1016/j.eswa.2016.09.041
[16]Ge, X., et al. (2015). Intrusion detection model for WSNs based on projection pursuit. Transducer and Microsystem Technology.9,34.
7
Authors
Linlin Li, Liangxu Sun, and Gang Wang are with the College of Software, University of Science and Technology Liaoning, Anshan, China