RESEARCH ARTICLE
Visualizing macroevolutionary timescales:
students’ comprehension of different temporal
representations in an animation
Jörgen Ingemar Stenlund
1*and Lena Anna Elisabet Tibell
2Abstract
Background: Macroevolutionary time is a difficult idea to grasp and is considered to be a threshold concept in teaching and learning evolution. One way of addressing this subject is to use animations that represent evolutionary time. The aim of this descriptive and exploratory study was to investigate how various representations of time in an animation affect the way undergraduate students comprehend different temporal aspects of hominin evolution. Two factors, namely differences in timelines (the number of timelines with different scales) and the mode of the default animated time rate (either constant throughout the animation or decreasing as the animation progressed) were combined to give four different time representations. The temporal aspects were investigated using undergraduate students’ ability to find events at specific times, to comprehend relative order, to comprehend concurrent events, to estimate the duration of time intervals and their ability to compare the lengths of time intervals.
Results: The results revealed that “finding events at specific times” near to the end of the animation (closer to present time), where the sequence of events appeared very quickly, was more difficult for groups working with animations with only one timeline. We also found that the ability to comprehend concurrent events can be impaired if several timelines are displayed and the animation speed is relatively high. The ability to estimate the duration of a time inter-val was more difficult for groups working with animations with only one timeline, especially at the end of the anima-tion where the sequence of events occurred quickly. Making correct comparisons of time intervals was relatively independent of which animation was used with one notable exception: groups working with an animation featuring several timelines and a decreasing default animated time rate performed worst at comparing events with intervals that spanned parts of the timeline with different scales.
Conclusions: Our results indicate that the choice of animation should depend on the teaching intention. However, a visualization with several timelines, and an animated time which slowed down toward present time, generated the best results for the majority of items tested. Temporal scale shift may interfere with the perception of time in cases where durations are compared.
Keywords: Evolution, Visualization, Threshold concept, Deep time
© The Author(s) 2019. This article is distributed under the terms of the Creative Commons Attribution 4.0 International License (http://creat iveco mmons .org/licen ses/by/4.0/), which permits unrestricted use, distribution, and reproduction in any medium, provided you give appropriate credit to the original author(s) and the source, provide a link to the Creative Commons license, and indicate if changes were made. The Creative Commons Public Domain Dedication waiver (http://creat iveco mmons .org/ publi cdoma in/zero/1.0/) applies to the data made available in this article, unless otherwise stated.
Background
Challenges associated with teaching and learning evolution
The theory of evolution is considered to be the most important theory in biology, since it underpins all bio-logical disciplines from ecology to molecular biology and
biochemistry (Dobzhansky 1973). It explains how all life forms are related, how different organisms derive from a common ancestor, and how species have diversified. It has a bearing on issues from bacterial resistance to anti-biotics as well as adaptations to climate change. Hence, evolution is clearly of critical importance for biology edu-cation and for understanding many aspects of fundamen-tal science and the diverse challenges facing individuals, communities, and global ecosystems.
Open Access
*Correspondence: [email protected]
1 School of Science and Technology, Örebro University, Örebro, Sweden
However, teaching and learning about evolution is challenging for different reasons. A number of teaching strategies and tools have been developed over the past 30 years (Andersson and Wallin 2006; McVaugh et al. 2011; Nehm and Reilly 2007; Nelson 2008; Sinatra et al. 2008) which have contributed to meaningful strategies for teaching evolution. Compilations of pedagogical and philosophical issues related to teaching and learning evolution have been published (Smith 2010a, b). Never-theless, various obstacles regarding teaching evolution need to be further addressed by researchers and teach-ers. In fact, robust misconceptions relating to evolution are frequent among learners (Smith 2010a), and previous research has confirmed that there are a variety of prob-lems facing teachers as well as for example curators at museums in communicating evolutionary content (Har-court-Smith 2012). Hence, it is crucial to find the main difficulties and to identify new approaches to overcome them.
Some of the difficulties in understanding evolution stem from problems in comprehending underlying, more general, concepts. In recent literature on evolution teach-ing and learnteach-ing, a new class of concepts, “threshold concepts”, have emerged (Meyer and Land 2003). They are defined as follows: “A threshold concept can be con-sidered as akin to a portal, opening up a new and previ-ously inaccessible way of thinking about something. It represents a transformed way of understanding, or inter-preting, or viewing something without which the learner cannot progress.” (Meyer and Land 2003: 1). Several threshold concepts in association with evolution have been proposed among those is “temporal scale” (Ross et al. 2010), which in biology can span billions of years to instantaneous time. Strategies for how to incorporate threshold concepts, such as time, in teaching evolution is further discussed by Tibell and Harms (2017).
In this exploratory and descriptive study, we focus on one of the threshold concepts, time, and on how the design of visual representations in an animation affects students’ comprehension of evolutionary deep time. The study seeks to contribute to the discussion on how visualizations can be designed to facilitate teaching and learning about issues where time scales are important to understand.
“Time” in teaching and learning about evolution
Evolution is a complex process depending on of several factors, often involving very large and very small quan-tities such as large populations sizes, low mutation fre-quencies and enormous numbers of generations. In other words, understanding evolution requires the learner to be able to integrate phenomena across diverse temporal and spatial scales. Deep time is a fundamental element of
this complexity. The definition of evolution according to Henderson’s dictionary of biology (Lawrence 2013: 218) includes “the development of new types of living organisms from pre-existing types by the accumulation of genetic dif-ferences over long periods of time.” This definition empha-sizes the involvement of a vast number of generations in the development of new species, and for most multi-cellular organisms this means thousands to millions of years—deep time. Furthermore, comprehension of large numbers associated with deep time have proved to be challenging for many students (Cheek 2012). Integrat-ing these scales in evolution lies completely beyond the human range of experience, and poses major educational challenges.
Representation of deep time
During the 17th and 18th centuries, the notion of the earth being very old emerged. The geologist James Hut-ton (1726–1797) coined the term “deep time”, referring to geological time, that is, time frames covering multi-ples of millions of years—an idea further developed by Charles Lyell (Lyell and Deshayes 1830). Deep time has subsequently been introduced into evolution theory. Sev-eral studies have emphasized the importance of learners’ understanding of deep time in evolutionary and geo-logical education (Catley and Novick 2009; Dodick 2007; Trend 2001). However, timescales covering deep time are different from those we experience in our daily lives, hence they present challenges in understanding evolu-tionary processes (Catley and Novick 2009).
As deep time is an abstract domain, it is usually shaped by metaphorical mappings from more concrete domains, primarily space (Boroditsky 2000; Lakoff and Johnson 1999). This means that thinking about time usually occurs in terms of spatial-relational information. For example, elements and their relationships are represented as loca-tions, and durations are represented as distances on a timeline (x-axes) (Boyd-Davis 2012; Lakoff and Johnson 1999). Provided with an animated cursor indicating time-passage, the animated rate of time can also be temporally changed (“compressed” or “expanded”) in relation to real time (i.e. that 1000 years for example can correspond to the distance the cursor has moved during 1 s). Thus, the timeline and the time-rate metaphors can be combined, by letting a cursor marking the time at the timeline at constant or varying rates (see “Representations of time in evolution” below).
be combined with what Lakoff and Johnson (1999) term “the moving observer metaphor”. In this metaphor the observer is moving towards the future leaving the past behind with time conceptualized as a series of locations (Lakoff and Johnson 1999). Timelines with an animated cursor marking the present resonate with this combi-nation of the time orientation metaphor and the mov-ing observer metaphor. One way of makmov-ing the abstract concept of time more concrete is to map it visually onto space in the form of timelines. This has been done over the last 250 years (Boyd-Davis 2012). The mapping of time to space also appears frequently in language and may even constitute a foundation to our reasoning and thinking about time (Boroditsky 2000).
Understanding deep time
The concept of deep time comprises several compo-nents and requires the ability to locate and order events in history over a large linear scale, as well as the ability to estimate a duration and to compare it to other events or processes (Cheek 2013a; Hidalgo et al. 2004). Further-more, the ability to compare how long ago two events occurred from a fixed reference point is of importance (Hidalgo et al. 2004). An aspect of time that is less well represented in previous research is a learner’s ability to comprehend the concurrency of events. In addition, according to Cheek (2010, 2012), the ability to correctly conceptualize events in deep time depends on a solid conception of large numbers and the proportion between them (e.g. the difference between one million and one billion). Since most students do not have much experi-ence of large numbers this can be challenging to relate to. Furthermore, subject-specific knowledge is essential to provide suitable reference points (Cheek 2013b; Clary et al. 2009).
Digital representations, time and learning
Developments in educational technology have become relevant for teaching and learning (Luckin et al. 2012; Moreno and Mayer 2007) and enable new ways of rep-resenting time (Kraak et al. 1997; Peterson 1999). Mon-monier (1990) presented a conceptual framework for the graphical representation of geographic time series to guide designers. He distinguished between two strat-egies available in digital environments: an interactive system allowing the user to manipulate time series easily and animation graphics, where the sequence is ordered in time, turning the visualization into a model with spatial scales with different time rates.
Research in GIS (Geographical Information Systems) is extensive and might be used in reference to spatio-tem-poral animations. It has shown how different representa-tions of time affect users. In a study carried out by Edsall
et al. (1997), and later confirmed by Midtbø et al. (2007), three different representations of time were investigated: a timeline, a time wheel and a text-based legend. No sig-nificant differences in the performance among groups working with the different representations could be shown. Vít and Bláha (2012) studied time represented as a temporal axis, with time units of consistent length and a movable slide bar illustrating the rate of time, proved to be most user-friendly when compared to the representa-tion with units of varying length and a movable slide bar moving at a constant speed.
Cognitive load and visualization of time
A well-documented aspect of multimedia learning is the magnitude of cognitive load associated with the visuali-zation. A large body of basic research has been devoted to this particular area and general frameworks have been developed (Baddeley 2003; Moreno and Mayer 2007; Paas et al. 2003; Sweller 1988). These are based on assump-tions about human knowledge such as the limited pro-cessing capacity (Baddeley 1992) and the dual channel assumption (Sweller 2005). The importance of choosing well designed animations in appropriate learning situa-tions has also been stressed by Tversky et al. (2002). Of special interest for this study is the cognitive load attrib-uted to the mental effort required to be spent on the manner in which information is presented (Paas et al. 2003). This type of load is largely determined by how instructional materials are designed.
Since more is usually known about the recent past than the distant past, there is a tendency for a natural overload of information as the timeline reaches the present day (Boyd-Davis 2013). This also applies to knowledge about evolutionary history since more information is available from recent times (e.g. fossils and organic remains are more abundant) compared to the material from more ancient times which have largely been decomposed. This type of “design problem” in visualizations of time-lines with uneven distribution of events has also been addressed by Vít and Bláha (2012). From a design point of view, optimizing the narrative structure has meant making compromises between the need for “higher res-olution”, in terms of a slow animated rate of time and detailed timelines during periods with a large number of events, and the need for a faster animated rate of time during periods with fewer events.
Representations of time in evolution
to model abstract and complex content. Multimedia and dynamic visual representations, such as videos and ani-mations, are approaches for connecting time frames and illustrating dynamic processes. In the context of evo-lution, animations and simulations could be useful to depict non-perceptual, complex and dynamic processes such as speciation and changes in abundance and distri-bution of species over a long time.
Given this important role of visual representations, Bohlin et al. (2017) have previously surveyed the pres-ence of threshold concepts in 60 online dynamic visu-alizations. This study revealed a clear lack of certain thresholds such as small spatial and temporal scales. In a follow up study (Tibell et al. 2016), the presence of
time and visual temporal scale indicators in 127 dynamic visual representations were analyzed. The most frequent category of threshold concepts was time, which was found in about 26% of the studied dynamic visual repre-sentations, and approximately as often orally narrated as visually shown. The processes were indicated at individ-ual, generation and species level, and were visually con-veyed through timers, geological strata in combination with timelines, calendars where dates and years past very quickly, or an episode of “fast forward”.
The timeline, as a device for organizing coherent sequences of events, has been the focus of many stud-ies (Boyd-Davis 2012; Foreman et al. 2008; Korallo et al. 2012), which have included the construction of student generated timelines to investigate understanding of deep time (e.g. Cheek 2012; Clary et al. 2009; Libarkin et al. 2007; Truscott et al. 2006). The understanding of dif-ferences in temporal scale between events is poor but comprehension of relative order is better (Libarkin et al. 2007).
Literature suggests that how well a particular repre-sentation of time can support a learner in understanding temporal aspects of a sequence depends on many factors such as the learner’s existing knowledge and capabilities, as well as the design, purpose and context of the anima-tion (Ainsworth 2008a). In this study, we have focused on design issues. From a didactic point of view, it is impor-tant that the design of any animation serves the intended educational purpose. However, there are many different aspects to consider, some of which compete and are even contradictory. For example, in spatio-temporal anima-tions, there may be a need for a narrative flow, that is, a relatively even frequency of occurring events, coupled with the need to display prolonged time intervals with few events (Boyd-Davis 2013; Vít and Bláha 2012). The problem of uneven distribution of events requires con-sideration as to whether it is important that users should perceive the presented information intuitively or be able
to process the information further through other pro-cesses such as making calculations. Therefore, an aware-ness of how different temporal representations serve different educational purposes is important for designers of applications, as well as for teachers choosing among the multitude of available animations.
One of the most common representations of deep time is a physical, linear and one-dimensional timeline placed in the corridor of a school (Truscott et al. 2006). Since it is known that students tend to overestimate very short durations and underestimate very long durations (Lee et al. 2011), this kind of linear representation can facilitate understanding of deep time. However, Lee et al. (2011) caution the use of visualizations that alter the rep-resentation of time rate for the same reason.
Other ways to communicate temporal information include the use of multiple representations, but the way time is displayed is crucial to consider (Ainsworth and VanLabeke 2004). General principles for how multiple external representations can serve several functions have been discussed by Ainsworth (1999). However, there is also considerable evidence that learners often fail to take advantage of multiple representations, and that they gen-erally need to be used in a supportive context (Ainsworth 2008b).
A different way of representing time is through the use of evolutionary trees. The main goal in this regard is to illustrate relationships between species, but attempts to depict time are sometimes included. In most cases, how-ever, time is not illustrated using a common time repre-sentation but rather through a convenient sliding scale (Horn et al. 2016).
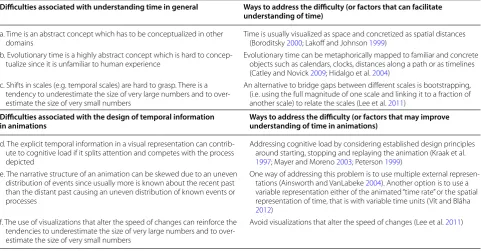
A summary of some relevant factors that might hinder or improve the understanding of time scales is presented in Table 1.
Purpose of the study
There are few studies that have investigated how deep time and temporal scales affect teaching and learning evolution, and almost none on how visualizations can support learning in this regard. Since time can be illus-trated in many different ways (Ainsworth and VanLabeke 2004) an important aspect to consider is the relationship between how dynamic representations affect student’s perception and comprehension of various temporal aspects.
In this exploratory and descriptive study, the investi-gated aspects are deduced from prior research in differ-ent areas, which include:
• The ability to comprehend the relative order of events (Catley and Novick 2009; Libarkin et al. 2007; Trend 1998, 2000, 2001).
• The ability to estimate the duration of a time interval (Cheek 2013b; Dodick and Orion 2003).
• The ability to compare different temporal durations (Cheek 2013a; Hidalgo et al. 2004).
• The ability to comprehend the concurrency of events (Mayer and Moreno 2003).
We have constructed one animation with four versions of a time representation. Each of the time representations have been analyzed regarding these temporal aspects.
Methods
Setting and sample
This study involved 144 university students enrolled in a teacher education program while attending a biol-ogy course at a Swedish University. To obtain sufficient numbers of participants and to be able to develop the design of the study, we collected data in four rounds over 15 months (Table 2). The average age of the students var-ied between 22.6 and 24.5 years in the different rounds of data collection. The gender distribution was biased towards females (78%) which also reflects the current gender balance in recruitment for this type of education. We obtained consent to publish the anonymized results from all the participants.
According to a questionnaire distributed before the study, the participants had a similar educational back-ground and interests. Since hominin evolution had not been taught in any of the courses the students were tested concerning their pre-knowledge of hominin evolu-tion. Furthermore, we used items to test students’ arith-metic skills, ability to interpret graphical representations of timelines, and to compare the size of graphical objects (see Appendix, questions 9–13). Since the test items (see Table 4 below) include mathematical skills the results did not indicate any notable difference between the groups.
Table 1 Important factors that might hinder or improve the understanding of time scales
Difficulties associated with understanding time in general Ways to address the difficulty (or factors that can facilitate understanding of time)
a. Time is an abstract concept which has to be conceptualized in other
domains Time is usually visualized as space and concretized as spatial distances (Boroditsky 2000; Lakoff and Johnson 1999) b. Evolutionary time is a highly abstract concept which is hard to
concep-tualize since it is unfamiliar to human experience Evolutionary time can be metaphorically mapped to familiar and concrete objects such as calendars, clocks, distances along a path or as timelines (Catley and Novick 2009; Hidalgo et al. 2004)
c. Shifts in scales (e.g. temporal scales) are hard to grasp. There is a tendency to underestimate the size of very large numbers and to over-estimate the size of very small numbers
An alternative to bridge gaps between different scales is bootstrapping, (i.e. using the full magnitude of one scale and linking it to a fraction of another scale) to relate the scales (Lee et al. 2011)
Difficulties associated with the design of temporal information
in animations Ways to address the difficulty (or factors that may improve understanding of time in animations)
d. The explicit temporal information in a visual representation can contrib-ute to cognitive load if it splits attention and competes with the process depicted
Addressing cognitive load by considering established design principles around starting, stopping and replaying the animation (Kraak et al. 1997; Mayer and Moreno 2003; Peterson 1999)
e. The narrative structure of an animation can be skewed due to an uneven distribution of events since usually more is known about the recent past than the distant past causing an uneven distribution of known events or processes
One way of addressing this problem is to use multiple external represen-tations (Ainsworth and VanLabeke 2004). Another option is to use a variable representation either of the animated “time rate” or the spatial representation of time, that is with variable time units (Vít and Bláha 2012)
f. The use of visualizations that alter the speed of changes can reinforce the tendencies to underestimate the size of very large numbers and to over-estimate the size of very small numbers
Avoid visualizations that alter the speed of changes (Lee et al. 2011)
Table 2 Participants in the different rounds of data collection
a The Natural Sciences Competence Educational Course is a complementary
course providing students with formal competence for studies in science at university level
Data collection round
Students’ enrollment Male Female Total
1 Pre-service primary teachers 9 32 41 2 Students attending Natural
Sci-ences, Competence Educational Coursea
14 18 32
The animations
In this paper, we will use the term “animation” to define a form of dynamic representation that displays processes that change over time. This conforms to the definition of animation used by Ainsworth (2008a).
Since it was relevant to the participants, and it was considered as a highly motivating topic for students in general, we chose the evolutionary history of hominins as an example of macroevolution (Bajd 2012; Besterman and Baggott La Velle 2007). The timescale involved in the visualization covers about 7 million years (Wood 2010), which is a relatively short time in evolutionary terms, but far beyond human experience.
We constructed four versions of a three-and-a-half minute long spatio-temporal animation specifically for this research project to investigate how different repre-sentations of time would affect learning. It was inspired by similar visualizations used in museums (e.g. Naturhis-toriska riksmuseet in Stockholm, Sweden) and available on the internet.
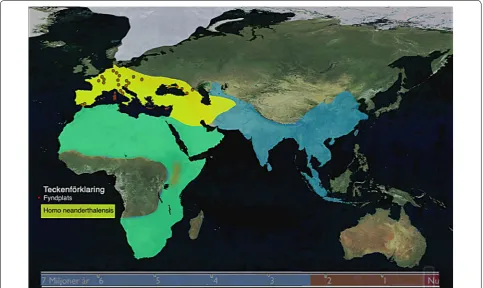
The animations were designed as a map upon which animated areas were superimposed (Fig. 1). Each area represented the appearance, dispersal and disappear-ance of a chosen sample of different species, or groups
of species in hominin evolution. The scenario was based on a selected sample of fossil findings covering homi-nin history (Wood 2010). All versions of the animation shared these features, the only difference being how time was represented. The visual representation of time was located below the map at the bottom of the animation and consisted of two components: one or several time-lines with different scales, and an animated cursor mov-ing horizontally along the timeline, indicatmov-ing current time and rate of time in the animation. The participants were able to start, stop and replay the animation.
The animations used in the study can be accessed at http://urn.kb.se/resol ve?urn=urn:nbn:se:liu:diva-15323 5.
Different versions of the time representation
Much more is known about recent evolutionary history compared to more ancient times, just because the more ancient material has largely been destroyed. Therefore, the risk of information overload as the timeline reaches present day is difficult to avoid unless the default ani-mated rate of time slows down, in which case perception of time might be affected. To investigate this issue, we constructed four variants of the same animation differing only in how time was represented.
We compared the effect of a time rate which varied versus a constant time rate. Furthermore, we compared the effect of a single scale versus emerging magnified scales by bootstrapping, that is, the method to use the full extent of one scale and link it to a fraction of another scale (Lee et al. 2011). These two factors, the time rate and the number of timelines with different scales were combined to yield four versions of time representations (Table 3). In the following text we use the expression rate of time to denote the default animated rate of time as it is represented in the temporal legend, unless otherwise stated.
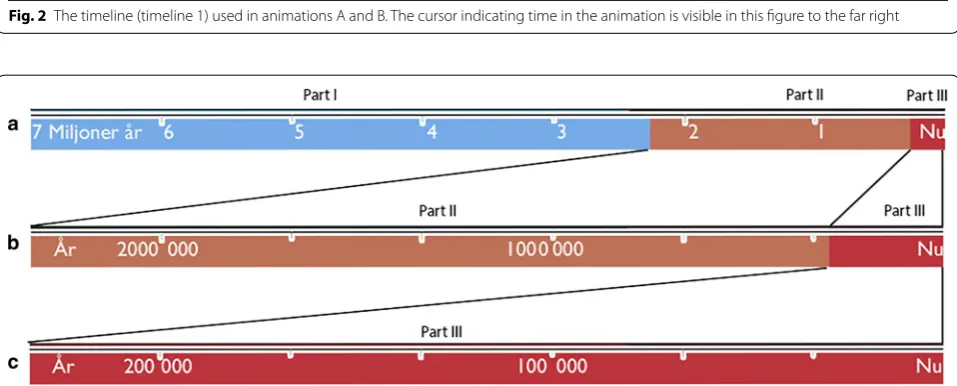
In animation A only one timeline was used (timeline 1), and the rate of time (indicated by an animated cur-sor) was the same throughout the animation, and was equivalent to 33,333 years per second (Fig. 2). However, timeline 1 was divided into three parts, the first covering 7 million years ago (7 Ma) to 2.3 Ma, the second covering
the period between 2.3 and 0.23 Ma, and the last cover-ing 0.23 Ma—present day. The indicator of time rate and current time was an animated cursor moving along the timeline.
Animation B comprised, as A, of only one timeline (timeline 1, see Fig. 2) but the rate of time changed twice as the animation reached the second and the third parts of the timeline. The rate of time was 49,500 years per second during the first part of the timeline (blue) which covered the period 7–2.3 Ma ago, 25,000 years per sec-ond during the secsec-ond part (brown) which covered 2.3– 0.23 Ma ago and 7200 years per second during the most recent and final part (red) covering 0.23 Ma–present day.
In animation C, the rate of time was the same through-out the animation (as in A), but the uppermost timeline (timeline 1) was sequentially complemented with two timelines of increasing magnification scales (timelines 2 and 3, see Fig. 3) as the animation reached the second and third parts of timeline 1. This design is an example of shifting scales by bootstrapping (Lee et al. 2011).
In animation D, the timeline was constructed as in C, but the rate of time changed twice (as in animation B) as the animation reached the second and third parts of timeline 1 as in animation B, each speed reduction coin-cides with the appearance of timelines 2 and 3 below timeline 1, respectively.
Table 3 Combinations of animated rate of time and number of timelines with different scales (subsumed as the different temporal legends)
Time rate 1 timeline with 1 scale 3 timelines
with 3 scales
Constant Animation A Animation C Varied Animation B Animation D
Fig. 2 The timeline (timeline 1) used in animations A and B. The cursor indicating time in the animation is visible in this figure to the far right
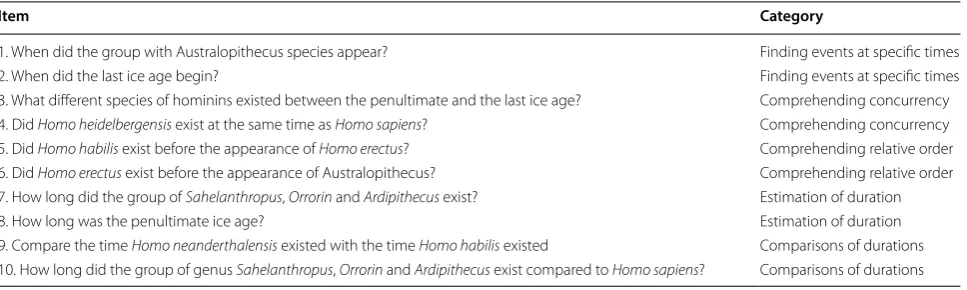
Test items
We developed ten items to address the different aspects of time formulated in the research questions (Table 4). To elucidate differences caused by the different anima-tions we grouped the items in pairs which corresponded to the five research questions. One of the items in each pair was expected to be in principle less independent of which animation that was used (i.e. earlier in the anima-tion). The other item was expected to be dependent on which animation that was used, since it targeted events during the last 230,000 years where the scales and rate of time differed in the four animations.
Study design
The study was designed to investigate how students perceived the depicted process while viewing one ver-sion of the animation (verver-sion A, B, C or D, see Table 3). The students worked individually, and were presented with two equally-sized windows shown concurrently on a computer screen. One displayed a specific version of the animation and the other displayed the items. An online survey tool (Limesurvey GmbH/LimeSurvey: An Open Source survey tool/LimeSurvey GmbH, Ham-burg, Germany. URL http://www.limes urvey .org) was used to construct the questionnaire and collect data. The students worked with the items simultaneously as they viewed the animations since we were interested in the process of perceiving and comprehending the infor-mation while it was presented.
Data analysis
The students’ responses to the items were categorized as either “correct” or “incorrect”. The criteria used to categorize the answers concerning finding events at specific times were as follows: maximum 10% deviation from the correct answer were considered as correct,
and deviations exceeding 10% deviation from the cor-rect answer were considered to be “incorcor-rect”. Since items addressing estimates of duration required esti-mates of two points in time, a maximum of in total 20% deviation from the correct answer was judged as “correct” and values exceeding 20% deviation from the correct answer were considered to be “incorrect”, and scored 0 points. The answer to item 3 “What differ-ent species of Hominins existed between the penulti-mate and the last ice age?” had a unique format which was categorized as correct if two or more species were named. To normalize the results, they are expressed as percent of correct answers for each group.
Results
Results concerning the participants’ ability to answer items related to the animations are presented in Table 5. The results are presented as average values for each group and item and the corresponding percent of cor-rect answers. In the following, each research question is addressed separately.
Students’ ability to find events at specific times
Finding events at specific times located in the first part of timeline 1 (Fig. 2) was examined with the first item (“When did the group Australopithecus spe-cies appear?”). The different groups had similar success in answering this item. The fraction of students who answered correctly varied between 73 and 81% in the dif-ferent groups.
The second item (“When did the last ice age begin?”) was apparently more difficult to answer. It addressed a point in time at the end of the animation, in the third part of the timeline, where all three timelines with increasing scales were visible in animations C and D (Fig. 3). The groups using animations with only one timeline (anima-tions A and B, see Fig. 2) demonstrated difficulties. None
Table 4 Test items used in the study
Item Category
of the participants could answer this item correctly while using the animation with a single timeline and a constant time rate (animation A), and 9% when the time rate was reduced (animation B). Groups using animations with three timelines of increasing scales (groups C and D) seem to succeeded better, 52% correct answers, and 54% respectively.
Students’ ability to comprehend the relative order of events
Two items addressed the ability to comprehend the rela-tive order of two events. The first item asked “Did Homo habilis exist before the appearance of Homo erectus?” (item 5) and the second asked “Did Homo erectus exist before the appearance of Australopithecus?” (item 6). A high percentage in all groups (85–100%) answered these items correctly. Apparently these items were not difficult for the students, independent of whether the times to be located were situated early or late in the time frame and independent of which animation was used.
Students’ ability to comprehend concurrent events
In item 3 concerning concurrent events, the participants were asked to state the number of different species of Hominins that existed between the penultimate and the last ice ages which occurs very late in the animation. The groups using the different animations A, B and D per-formed relatively well and delivered between 68 and 85% answers.
Item 4 asked “Did Homo heidelbergensis exist at the same time as Homo sapiens?” This item concerns peri-ods relatively near the end of the animation, where time-line 1 is supplemented with two additional timetime-lines in animations C and D (Fig. 3). This item was related with 62–71% of correct answers in group A, B and D. For both item 3 and 4, group C performed the worst (50% and 48% respectively).
Students’ ability to comprehend durations of time intervals Item 7 concerned an interval during the first part of the animation: “How long did the group with Sahelanthro-pus, Orrorin and Ardipithecus exist?” Regardless of which animation that was used, it should be equally difficult to answer this item correctly since all of the animations started in a similar way, with one timeline, few events and a similar rate of time. For some reason animations A and D appear to help the students to produce better answers (86% and 82%) than animation B and C (57–58%).
Item 8 was related to an interval occurring during the last part of the animation: “How long was the penulti-mate ice age?”. This item appeared to challenging for all students to solve. None of the students using animations A and B could answer this item correctly. Students using animations C and D (which featured three timelines dur-ing the last part of the animations) performed better but still only with 24% and 36% correct answers respectively.
Students’ ability to compare durations of time intervals In item 9, the respondents were asked to “Compare the time Homo neanderthalensis existed with the time Homo habilis existed”. The existence of these species covered different parts of the animation where the rate of time changed in animations B and D, making the comparison harder for participants using these animations. Infor-mation concerning the length of time H. habilis and H. neanderthalensis existed could only be acquired from timeline 1 in animations A and B, whereas the addi-tional timelines in animations C and D also provided the same information on scales with higher resolution. The percentages of correct answers for animations A and B (featuring a single timeline, see Fig. 2) are 36% and 38%, respectively. The students using animation C performed best with 52% correct answers and students using anima-tion D performed worst, with 28% correct answers.
In item 10, the respondents were asked “How long did the group of genus Sahelanthropus, Orrorin and
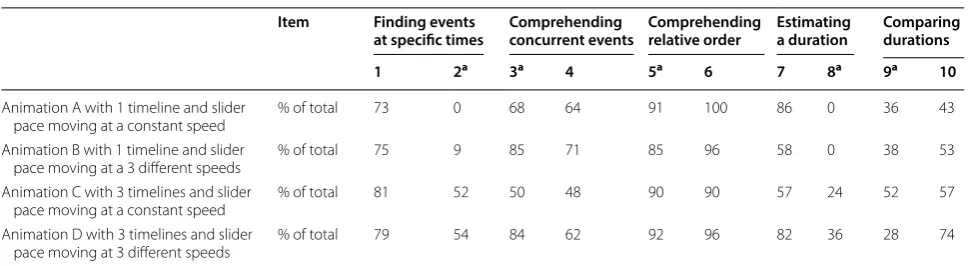
Table 5 Results from item 1–10
The values are expressed as average percentage correct answers per group and item. Items marked with a are considered to be more challenging to discern in each
category pair
Item Finding events
at specific times Comprehending concurrent events Comprehending relative order Estimating a duration Comparing durations
1 2a 3a 4 5a 6 7 8a 9a 10
Animation A with 1 timeline and slider
pace moving at a constant speed % of total 73 0 68 64 91 100 86 0 36 43 Animation B with 1 timeline and slider
pace moving at a 3 different speeds % of total 75 9 85 71 85 96 58 0 38 53 Animation C with 3 timelines and slider
pace moving at a constant speed % of total 81 52 50 48 90 90 57 24 52 57 Animation D with 3 timelines and slider
Ardipithecus exist compared to Homo sapiens?”. The group that viewed animation A performed worst and delivered 43% correct answers, whereas groups B and C produced similar results, namely 53% and 57%, respec-tively. The best results were obtained from group D, which had 74% correct answers.
Discussion
Results from research on how well animations aid users’ understanding of dynamic phenomena in general are ambiguous. Some indicate positive effects (Kaiser et al. 1992) and some negative (Schnotz et al. 1999; Tversky et al. 2002). However, studies of how diverse designs of time in animations help students to grasp different aspects of time (including deep-time) in evolution are scarce. In this descriptive and exploratory study we have investigated how various representations of time in an animation affect students’ experiences of different tem-poral aspects in an evolutionary scenario depicting homi-nin evolution. However, our results are to be taken as tentative, since they are not based on experimental data, and need to be validated experimentally.
We have chosen to represent time in the form of ani-mated timelines. However, there are choices to be made concerning the design of such animated temporal repre-sentations. When representing evolutionary time, a time-line with time-linear scale has limitations. Even the relatively short evolutionary time of hominins (about 7 million years) is difficult to represent in this manner (Dunsworth 2011). Of course, this difficulty is even more pronounced when the entire evolutionary history of about 3.5 billion years is considered.
We discuss the results commencing with the cases where the design of time appeared to have had the least impact on students’ comprehension of evolutionary deep time, and closes with the instances where the design was observed to have a large effect.
The comprehension of relative order of events
The results indicate that there is no clear difference in comprehending the relative order of events between the different animations. The findings of this study support previous research on how temporal succession in deep time is experienced (e.g. Catley and Novick 2009; Libar-kin et al. 2007; Trend 1998, 2000, 2001). Addressing sim-ple sequencing was relatively easy for the participants, independent of which of the animations they used. This agrees with the observation that the learner does not necessarily have to use information from the timeline since the relative order of species can be learnt from the animated map directly.
The ability to comprehend concurrent events
It was also possible to comprehend concurrent events by watching the animated map without using the timeline. Several quickly occurring events during the last part of the animation made it harder to comprehend concur-rent events for the groups using visualizations with a constant rate of time. The group working with anima-tion C, which had three timelines and a constant rate of time, performed worst in both items whereas the groups working with animations featuring a slower pace at the end (animations B and D) performed the best. The most probable reason for this result is that several simultane-ously and fast-occurring events cause a higher cognitive load (Kalyuga 2007). Furthermore, the animated timeline itself might also generate too much user attention. Thus, distracting viewers from relevant information displayed on the animated map (Peterson 1999).
The ability to find events at specific times and to estimate the duration of a time interval
Concerning the identification of events at specific times
(items 1 and 2) and estimation of time duration (items 7 and 8), no obvious difference could be observed between groups using any of the four animations in the items related to the first part of the timeline (items 1 and 7). The reason is most probably that the rates of time in this part were relatively similar and the period contained fewer events. However, the two visualizations featuring only one timeline (animations A and B) generated poorer results for finding times and estimating durations during the third part, at the end of the animation (items 2 and 8). The spatial scale was a decisive factor in these items and restricted the ability to correctly determine time. In fact, it was very difficult for the students to read the times involving the last 230,000 years on the scale used in animations A and B. The relatively low number of completely correct answers also for animations C and D might be a consequence of a high cognitive load due to the emerging timelines and the eventful time frame (Paas et al. 2003).
The ability to compare different temporal durations The ability to make comparisons between two durations
mathematical skills was measured between the partici-pating groups in a test before the experiment, other fac-tors seem to be dominant, primarily the fact of which animation was used.
Some of the features of the time representation in ani-mation D, which possibly provide advantages in other aspects, might increase the cognitive load due to the built-in shifts in spatial and temporal scales, i.e. several timelines and varying rates of time. For example, in item 10, the required time intervals were located at opposite ends—in the first and third part of the animation, none of the intervals transgressed shifts in scales along the time-line. This might explain why the group using animation D succeeded best in answering item 10 but worst in item 9, in which changes in temporal and spatial scale compli-cated the comparison of durations.
Representation of time
When we consider the results with in respect to the pres-ence of one or several timelines and whether the rate of time was constant or decreasing in the animation, it is possible to draw some tentative conclusions. The two animations featuring a single timeline (animations A and B, see Fig. 2) produced similar results. The shared char-acteristic of having only one timeline seems to be a more decisive factor rather than the difference in how the rate of time was expressed. The most salient results concern finding events at a specific times (item 2) and estimating the duration of a time interval (item 8) during the last part of the animation. Animations A and B gave rise to poorer results compared to the other animations. The reason for this is likely due to the small spatial scale dur-ing the event-filled final part of the animation, which made it harder to access detailed information from the timeline. In items involving comparisons of time inter-vals (items 9 and 10), the difference in results between the animations was less pronounced.
The animations featuring additional timelines as the animation progressed to the second and third part (i.e. animations C and D, see Fig. 3) offered the users increased spatial scales during the successively more event-filled periods at the end. Both these animations yielded better results than those with a single timeline for the items where events during the third and last part were involved—with one notable exception (item 9). Since animation C represented a constant rate of time, several rapid transient events occurred at the end, during the third part. Despite this, the group using this anima-tion performed well in all of the items related to items 2, 8, 9 and 10. Overall, the animation that produced the best results was animation D, with the exception of item 9 in which two intervals crossing scale shifts were compared.
In this case, the shift in scales might have introduced an additional cognitive load in addition to the perceived inconsistent temporal information in the two different dynamic components (i.e. the map and the timelines). The change of time rate is only apparent in the tempo-ral legend and not explicitly shown on the animated map. Lee et al. (2011) caution the use of visualizations that alter the speed of changes. This study partly supports this claim but only when comparisons of durations which cross scale shifts are involved.
Limitations of the study
We want to stress that our results are tentative since they come from a descriptive and explorative study. Many of the results are similar to corresponding results in neigh-boring domains, which strengthen their validity. Other results have to be validated experimentally. However, even though this is a descriptive and exploratory study, might have benefitted from a larger sample of partici-pants and a more balanced gender distribution.
Variations concerning which groups were involved in the different rounds could possibly contribute to dif-ferences in the results. In a potential next experimental setting of the study we need to address these shortcom-ings. Further, we could have used more test items to ensure reliability. However, it took about an hour for the students to answer the 10 items, and a longer form had probably jeopardize the quality of the answers due to exhaustion among the participants.
Implications for education and outreach
From the discussion above, it follows that there are sev-eral factors that need to be considered when using anima-tions to communicate evolutionary scenarios involving deep time. A tradeoff has to be found between factors that might seem contradictory. For example, manipula-tion of the time rate can impair the ability to compare durations for example if the duration coincides with changes in time rate. The need to represent time in a sim-ple and comprehensible way at the same time as handling problems with a very uneven distribution of events which might both cause cognitive overload and impair the nar-rative structure (Lee et al. 2011; Vít and Bláha 2012).
visual, connection to the temporal information, making the experience more embodied (Horn et al. 2016; Lakoff and Johnson 1999; Peterson 1999). Future research is needed to investigate this broader and, in more detail. How should representation of macroevolutionary sce-narios be designed to enhance the comprehension of time differences involving billions of years and temporal scale shifts? Our results suggest that teachers should be aware of the deficits in visualizations of time/temporal aspects of evolution. But most of all, the present results might inform guidelines for future improvements of edu-cational visualizations of time in evolution
Conclusions
Through an analysis of four representations of time in a visualization of hominin evolution, we argue that informed and conscious choices of animations with appropriate depictions of time can facilitate the teach-ing and learnteach-ing of subject matter regardteach-ing evolution-ary scenarios involving deep time. In contrast to earlier research (Midtbø et al. 2007), this study indicates that different representations affect learners’ abilities to per-ceive and comprehend at least some temporal aspects. In line with results from geographic information systems studies, time units of consistent length were proven to be most helpful (Vít and Bláha 2012) in giving students a sense of the relative time spans of evolution, which is one of the most difficult aspects to master in understanding evolution. However, the intensity of events progressively increasing at the end of the animation poses another challenge when time units of consistent length are used. If specific times are of importance, it is crucial to be able to read the time, and the time scale should be adapted to that demand. Consequently, different ways of presenting
the sequence of events is dependent on the specific edu-cational purpose.
Authors’ contributions
JIS had the original idea of the animation. JIS and LAET designed the anima-tion and LAET and JIS designed the study. JIS performed the data collecanima-tion. JIS and LAET made the annalysis of data JIS original draft of the manuscript. LAET and JIS revised the original manuscript itteratively and made modi-fications of original manuscript. Both authors read and approved the final manuscript.
Author details
1 School of Science and Technology, Örebro University, Örebro, Sweden. 2 Department of Science and Technology (ITN) Media and Information
Tech-nology (MIT), Linköping University, Norrköping, Sweden.
Acknowledgements
We are grateful to all the students who participated in the study, to Henry Fröcklin and Henrik Wahlstedt for technical support and our colleagues in the EvoVis research group. We are also very grateful for valuable opinions on the manuscript from Dr. Gunnar Höst, and to Dr. John Blackwell and Dr. Konrad Schönborn for language reviews.
Competing interests
The authors declare that they have no competing interests.
Availability of data and materials
The animations are available at: http://urn.kb.se/resol ve?urn=urn:nbn:se:liu:d iva-15323 5.
Ethics approval and consent to participate
All participants signed a consent form. Since all students were over 18 years old, according to Swedish law, no approval from an ethical committee was required to conduct this study.
Funding
The research was funded by the Swedish Research Council (Vetenskapsrådet) [Grant Number 2012-5344] (EvoVis), The Swedish National School in Science and Technology Education Research (FontD) Swedish Research Council (Grant 729-2013-6871) and Örebro University.
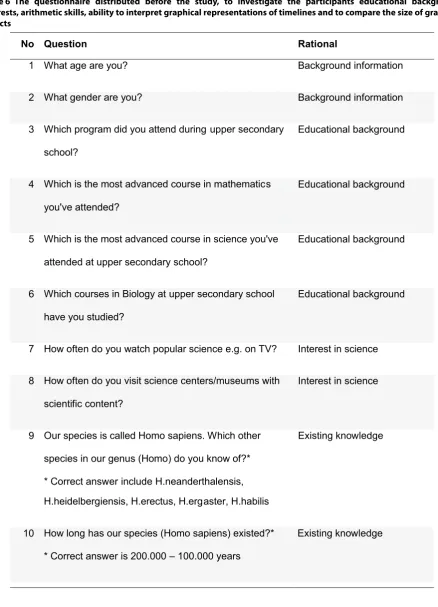
Table 6 The questionnaire distributed before the study, to investigate the participants educational background, interests, arithmetic skills, ability to interpret graphical representations of timelines and to compare the size of graphical objects
No Question Rational
1 What age are you? Background information
2 What gender are you? Background information
3 Which program did you attend during upper secondary
school?
Educational background
4 Which is the most advanced course in mathematics
you've attended?
Educational background
5 Which is the most advanced course in science you've
attended at upper secondary school?
Educational background
6 Which courses in Biology at upper secondary school
have you studied?
Educational background
7 How often do you watch popular science e.g. on TV? Interest in science
8 How often do you visit science centers/museums with
scientific content?
Interest in science
9 Our species is called Homo sapiens. Which other
species in our genus (Homo) do you know of?*
* Correct answer include H.neanderthalensis,
Existing knowledge
H.heidelbergiensis, H.erectus, H.ergaster, H.habilis
10 How long has our species (Homo sapiens) existed?*
* Correct answer is 200.000 – 100.000 years
Publisher’s Note
Springer Nature remains neutral with regard to jurisdictional claims in pub-lished maps and institutional affiliations.
Received: 29 June 2018 Accepted: 7 February 2019
References
Ainsworth S. The functions of multiple representations. Comput Educ. 1999;33(2–3):131–52.
Ainsworth S. How do animations influence learning? In: Robinson D, Schraw G, editors. Current perspectives on cognition, learning, and instruction: recent innovations in educational technology that facilitate student learning. Charlotte, NC: Information Age Publishing; 2008a. p. 37–67. Ainsworth S. The educational value of multiple-representations when learning
complex scientific concepts. In: Vis. Theory Pract. Sci. Educ. Dordrecht: Springer; 2008b. p. 191–208. https ://doi.org/10.1007/978-1-4020-5267-5_9. Accessed 18 Jan 2016.
Ainsworth S, VanLabeke N. Multiple forms of dynamic representation. Learn Instr. 2004;14(3):241–55.
Andersson B, Wallin A. On developing content-oriented theories taking bio-logical evolution as an example. Int J Sci Educ. 2006;28(6):673–95. Baddeley A. Working memory. Science. 1992;255:556–9.
Baddeley A. Working memory: looking back and looking forward. Nat Rev Neurosci. 2003;4(10):829–39.
Bajd B. Human evolution and education in Slovene schools. Evol Educ Out-reach. 2012;5(3):405–11.
Besterman H, Baggott La Velle L. Using human evolution to teach evolutionary theory. J Biol Educ. 2007;41(2):76–81.
Bohlin G, Göransson A, Höst GE, Tibell LAE. A conceptual characterization of online videos explaining natural selection. Sci Educ. 2017;26(7–9):975–99. Boroditsky L. Metaphoric structuring: understanding time through spatial
metaphors. Cognition. 2000;75(1):1–28.
Boyd-Davis S. History on the line: time as dimension. Des Issues. 2012;28(4):4–17.
Boyd-Davis. Inventing the timeline: a history of visual history. London; 2013.
https ://vimeo .com/58980 227. Accessed 24 Jan 2018.
Catley KM, Novick LR. Digging deep: exploring college students’ knowledge of macroevolutionary time. J Res Sci Teach. 2009;46(3):311–32.
Cheek KA. Factors underlying students’ conceptions of deep time: an explora-tory study. Durham University; 2010. http://ethes es.dur.ac.uk/277/. Accessed 8 Oct 2015.
Cheek KA. Students’understanding of large numbers as a key factor in their understanding of geologic time. Int J Sci Math Educ. 2012;10(5):1047–69. Cheek KA. Exploring the relationship between students’
understand-ing of conventional time and deep (geologic) time. Int J Sci Educ. 2013a;35(11):1925–45.
Cheek KA. How geoscience novices reason about temporal duration: the role of spatial thinking and large numbers. J Geosci Educ. 2013b;61(3):334–48. Clary RM, Brzuszek RF, Wandersee JH. Students’ geocognition of deep time,
conceptualized in an informal educational setting. J Geosci Educ. 2009;57(4):275–85.
Table 6 (continued)
11 How much more is 3 compared to 0.6?*
* Correct answer 5 times more
Ability to calculate
12 How much longer is rectangle B compared to rectangle
A?*
* Correct answer is 4 times longer
Ability to compare spatial
proportions
13 The timeline below illustrates a time interval where the
present day is on the far right. How far back in time
is the red cross located? *
* Correct answer is 250.000 years
Ability to interpret timelines
Dobzhansky T. Nothing in biology makes sense except in the light of evolu-tion. Am Biol Teach. 1973;35(3):125–9.
Dodick J. Understanding evolutionary change within the framework of geo-logical time. McGill J Educ. 2007;42(2):245–64.
Dodick J, Orion N. Cognitive factors affecting student understanding of geo-logic time. J Res Sci Teach. 2003;40(4):415–42.
Dunsworth HM. Deep time in perspective: an animated fossil hominin time-line. PaleoAnthropology. 2011;13:17.
Edsall R, Kraak M-J, MacEachren AM, Peuquet DJ. Assessing the effectiveness of temporal legends in environmental visualization. Cincinnati; 1997. p. 677–85.
Foreman N, Boyd-Davis S, Moar M, Korallo L, Chappell E. Can virtual envi-ronments enhance the learning of historical chronology? Instr Sci. 2008;36(2):155–73.
Harcourt-Smith WEH. Up from the ape: the spitzer hall of human origins at the american museum of natural history. Evol Educ Outreach. 2012;5(1):4–8. Hidalgo AJ, Fernando IESS, Otero ICEJ. Research report: an analysis of the
understanding of geological time by students at secondary and post-secondary level. Int J Sci Educ. 2004;26(7):845–57.
Horn MS, Phillips BC, Evans EM, Block F, Diamond J, Shen C. Visualizing biological data in museums: visitor learning with an interactive tree of life exhibit: visualizing biological data in museums. J Res Sci Teach. 2016;53(6):895–918.
Kaiser MK, Proffitt DR, Whelan SM, Hecht H. Influence of animation on dynami-cal judgments. J Exp Psychol Hum Percept Perform. 1992;18(3):669. Kalyuga S. Enhancing instructional efficiency of interactive e-learning
environ-ments: a cognitive load perspective. Educ Psychol Rev. 2007;19(3):387–99. Korallo L, Foreman N, Boyd-Davis S, Moar M, Coulson M. Can multiple “spatial”
virtual timelines convey the relatedness of chronological knowledge across parallel domains? Comput Educ. 2012;58(2):856–62.
Kozma R, Chin E, Russell J, Marx N. The roles of representations and tools in the chemistry laboratory and their implications for chemistry learning. J Learn Sci. 2000;9(2):105–43.
Kraak M-J, Edsall R, MacEachren AM. Cartographic animation and legends for temporal maps: exploration and or interaction. In: Proc. 18th Int. Cartogr. Conf. 1997. p. 253–261. http://www.geovi sta.psu.edu/publi catio ns/MacEa chren /Kraak _etal_97.PDF. Accessed 17 Dec 2015.
Lakoff G, Johnson M. Philosophy in the flesh: the embodied mind and its chal-lenge to Western thought. New York: Basic Books; 1999.
Lawrence E. Henderson’s dictionary of biology. New York: Benjamin Cum-mings; 2013.
Lee H-S, Liu OL, Price CA, Kendall ALM. College students’ temporal-magnitude recognition ability associated with durations of scientific changes. J Res Sci Teach. 2011;48(3):317–35.
Libarkin JC, Kurdziel JP, Anderson SW. College student conceptions of geologi-cal time and the disconnect between ordering and sgeologi-cale. J Geosci Educ. 2007;55(5):413–22.
Luckin R, Bligh B, Manches A, Ainsworth S, Crook C, Noss R. Decoding learning. NESTA; 2012.
Lyell C, Deshayes GP. Principles of geology; being an attempt to explain the former changes of the earth’s surface, by reference to causes now in operation. London: J. Murray; 1830. https ://www.biodi versi tylib rary.org/ item/10792 3. Accessed 28 Jan 2018
Mayer RE, Moreno R. Nine ways to reduce cognitive load in multimedia learn-ing. Educ Psychol. 2003;38(1):43–52.
McVaugh NK, Birchfield J, Lucero MM, Petrosino AJ. Evolution education: seeing the forest for the trees and focusing our efforts on the teaching of evolution. Evol Educ Outreach. 2011;4(2):286–92.
Meyer JHF, Land R. Threshold concepts and troublesome knowledge: linkages to ways of thinking and practising within the disciplines. University of Edinburgh UK; 2003. https ://www.dkit.ie/ga/syste m/files /Thres hold_ Conce pts__and_Troub lesom e_Knowl edge_by_Profe ssor_Ray_Land.pdf. Accessed 25 Nov 2014.
Midtbø T, Clarke KC, Fabrikant S. Human interaction with animated maps: the portrayal of the passage of time. In: 11th Scand. Res. Conf. Geogr. Inf. Sci. 2007. p. 45–60. http://www.resea rchga te.net/profi le/Keith _Clark e2/publi catio n/22889 7062_Human _inter actio n_with_anima ted_maps_The_ portr ayal_of_the_passa ge_of_time/links /0912f 51356 472b0 d3200 0000. pdf. Accessed 8 Jan 2016.
Monmonier M. Strategies for the visualization of geographic time-series data. Cartogr Int J Geogr Inf Geovisualization. 1990;27(1):30–45.
Moreno R, Mayer R. Interactive multimodal learning environments: special issue on interactive learning environments: contemporary issues and trends. Educ Psychol Rev. 2007;19(3):309–26.
Nehm RH, Reilly L. Biology majors’ knowledge and misconceptions of natural selection. Bioscience. 2007;57(3):263–72.
Nelson CE. Teaching evolution (and all of biology) more effectively: strategies for engagement, critical reasoning, and confronting misconceptions. Integr Comp Biol. 2008;48(2):213–25.
Paas F, Renkl A, Sweller J. Cognitive load theory and instructional design: recent developments. Educ Psychol. 2003;38(1):1–4.
Peterson MP. Active legends for interactive cartographic animation. Int J Geogr Inf Sci. 1999;13(4):375–83.
Ross PM, Taylor CE, Hughes C, Whitaker N, Lutze-Mann L, Kofod M, et al. Threshold concepts in learning biology and evolution. Biol Int. 2010;47:47–54.
Schnotz W, Böckheler J, Grzondziel H. Individual and co-operative learning with interactive animated pictures. Eur J Psychol Educ. 1999;14(2):245–65. Sinatra GM, Brem SK, Evans EM. Changing minds? Implications of conceptual
change for teaching and learning about biological evolution. Evol Educ Outreach. 2008;1(2):189–95.
Smith MU. Current status of research in teaching and learning evolution: I. philosophical/epistemological issues. Sci Educ. 2010a;19(6–8):523–38. Smith MU. Current status of research in teaching and learning evolution: II.
Pedagogical issues. Sci Educ. 2010b;19(6–8):539–71.
Sweller J. Cognitive load during problem solving: effects on learning. Cogn Sci. 1988;12(2):257–85.
Sweller J. Implications of cognitive load theory for multimedia learning. In: Mayer R, editor. Camb. Handb. Multimed. Learn. Cambridge: Cambridge University Press; 2005. p. 19–30. https ://www.cambr idge.org/core/books /cambr idge-handb ook-of-multi media -learn ing/impli catio ns-of-cogni tive-load-theor y-for-multi media -learn ing/F5F95 82CB1 2C678 1FA9C 61F6B 459D7 FC.
Tibell LAE, Harms U. Biological principles and threshold concepts for under-standing natural selection: implications for developing visualizations as a pedagogic tool. Sci Educ. 2017;26(7–9):953–73.
Tibell LAE, Göransson A, Bohlin G, Schönborn KJ, Höst GE, Jonsson D, et al. Prevalence and characterization of threshold concepts in dynamic visu-alizations of evolution. Karlstad; 2016.
Trend R. An investigation into understanding of geological time among 10- and 11-year-old children. Int J Sci Educ. 1998;20(8):973–88.
Trend R. Conceptions of geological time among primary teacher trainees, with reference to their engagement with geoscience, history, and science. Int J Sci Educ. 2000;22(5):539–55.
Trend RD. Deep time framework: a preliminary study of U.K. primary teachers’ conceptions of geological time and perceptions of geoscience. J Res Sci Teach. 2001;38(2):191–221.
Truscott JB, Boyle A, Burkill S, Libarkin J, Lonsdale J. The concept of time: can it be fully realised and taught? Planet. 2006;17:21–3.
Tversky B, Morrison JB, Betrancourt M. Animation: can it facilitate? Int J Hum Comput Stud. 2002;57(4):247–62.
Vít L, Bláha JD. A study of the user friendliness of temporal legends in ani-mated maps. AUC Geogr. 2012;47(2):53–61.