METHODOLOGY
DAMEfinder: a method to detect differential
allele-specific methylation
Stephany Orjuela
1,2, Dania Machlab
3, Mirco Menigatti
2, Giancarlo Marra
2and Mark D. Robinson
1*Abstract
Background: DNA methylation is a highly studied epigenetic signature that is associated with regulation of gene expression, whereby genes with high levels of promoter methylation are generally repressed. Genomic imprinting occurs when one of the parental alleles is methylated, i.e., when there is inherited allele-specific methylation (ASM). A special case of imprinting occurs during X chromosome inactivation in females, where one of the two X chromo-somes is silenced, to achieve dosage compensation between the sexes. Another more widespread form of ASM is sequence dependent (SD-ASM), where ASM is linked to a nearby heterozygous single nucleotide polymorphism (SNP).
Results: We developed a method to screen for genomic regions that exhibit loss or gain of ASM in samples from two conditions (treatments, diseases, etc.). The method relies on the availability of bisulfite sequencing data from multiple samples of the two conditions. We leverage other established computational methods to screen for these regions within a new R package called DAMEfinder. It calculates an ASM score for all CpG sites or pairs in the genome of each sample, and then quantifies the change in ASM between conditions. It then clusters nearby CpG sites with consistent change into regions. In the absence of SNP information, our method relies only on reads to quantify ASM. This novel ASM score compares favorably to current methods that also screen for ASM. Not only does it easily discern between imprinted and non-imprinted regions, but also females from males based on X chromosome inactivation. We also applied DAMEfinder to a colorectal cancer dataset and observed that colorectal cancer subtypes are distinguishable according to their ASM signature. We also re-discover known cases of loss of imprinting.
Conclusion: We have designed DAMEfinder to detect regions of differential ASM (DAMEs), which is a more refined definition of differential methylation, and can therefore help in breaking down the complexity of DNA methylation and its influence in development and disease.
Keywords: DNA methylation, Differential methylation, Allele-specific methylation (ASM), Imprinting
© The Author(s) 2020. This article is licensed under a Creative Commons Attribution 4.0 International License, which permits use, sharing, adaptation, distribution and reproduction in any medium or format, as long as you give appropriate credit to the original author(s) and the source, provide a link to the Creative Commons licence, and indicate if changes were made. The images or other third party material in this article are included in the article’s Creative Commons licence, unless indicated otherwise in a credit line to the material. If material is not included in the article’s Creative Commons licence and your intended use is not permitted by statutory regulation or exceeds the permitted use, you will need to obtain permission directly from the copyright holder. To view a copy of this licence, visit http://creat iveco mmons .org/licen ses/by/4.0/. The Creative Commons Public Domain Dedication waiver (http://creat iveco mmons .org/publi cdoma in/ zero/1.0/) applies to the data made available in this article, unless otherwise stated in a credit line to the data.
Background
Epigenetic modifications refer to mitotically herit-able, chemical variations in DNA and chromatin in the absence of changes in the DNA nucleotide sequence itself [1, 2]. Although there are a large number of such
documented phenomena, DNA methylation (i.e., methyl groups added to cytosines in mammalian DNA, mostly in CpG dinucleotides) stands out because the mechanism of heritability, via maintenance methyltransferases, is well-determined [3–5]. In addition, due to well-known effects of chemical reactions, such as sodium bisulfite conver-sion of cytosines to uracils [6], and biochemical reactions like TET-pyridine borane conversion of 5-methylcytosine to dihydrouracil [7], the interrogation of DNA methyla-tion level across the genome can be sampled and quanti-fied at each cytosine.
Open Access
*Correspondence: mark.robinson@imls.uzh.ch
1 Institute of Molecular Life Sciences and SIB Swiss Institute of Bioinformatics, University of Zurich, Winterthurerstrasse 190, 8057 Zurich, Switzerland
Page 2 of 19 Orjuela et al. Epigenetics & Chromatin (2020) 13:25
DNA methylation plays a role in several biological phe-nomena. It is believed to be associated with gene expres-sion, with the canonical relationship suggesting that transcriptional units with high levels of promoter meth-ylation are repressed or silenced, although not all genes with unmethylated promoters are switched on, since other epigenetic mechanisms of silencing may come into play [8].
Genomic imprinting, where genes are expressed in a parent-of-origin manner [9], is also regulated by DNA methylation. Imprinting occurs via allele-specific meth-ylation (ASM), in which only the paternal or the mater-nal allele is methylated in all or most of the tissues of an individual [9]. This methylation asymmetry is conferred during gametogenesis in the parental germlines, or dur-ing early embryogenesis after fertilization, and will remain during the lifetime of the offspring [10]. A recent survey [11] reported 228 genes linked to imprinted con-trol, and from those, 115 linked to imprinted regulation in human placenta. These genes are known for their roles in embryonic and fetal development, placental formation, cell growth and differentiation, metabolism and circa-dian clock regulation [11]. In fact, loss of imprinting and abnormal expression of imprinted genes are implicated in severe congenital diseases, like the neurodevelop-ment disorders Angelman and Prader–Willi syndromes. The first is caused by the lack of maternal UBE3A gene expression, and the second by loss of paternal expression of several contiguous genes on chromosome 15q11–q13 [12]. Furthermore, disruption of imprinting in somatic cells has been implicated in the pathogenesis of differ-ent cancers, like loss of imprinting within the H19/IGF2
imprinting control region in colorectal cancer [13], and gain of imprinting at 11p15 in hepatocellular carcinoma [14].
A special and well-characterized case of imprinting occurs during X chromosome inactivation (XCI), where one of the two X chromosomes is randomly silenced via DNA methylation and other epigenetic mechanisms, early in development in each cell of a female, to achieve dosage compensation between the sexes [15].
Beside imprinting and XCI, the rest of the genome is thought to be symmetrically methylated across both alleles. However, sequence-dependent ASM (SD-ASM) has been frequently reported in the last 10 years and appears to be widespread in the human genome [16–21]. In this case, the DNA methylation asymmetry between the parental alleles appears to be causally related to the presence of a single nucleotide polymorphism (SNP). As for imprinted ASM and XCI, SD-ASM can be associated with silencing of one of the two parental gene copies, likely mediated by cis-acting, allele-specific changes in affinity of DNA-binding proteins [21]. SD-ASM appears
to be tissue-specific [22, 23], thus it is commonly believed that the interaction between genetic variants (i.e., SNPs) and epigenetic mechanisms (i.e., effects of DNA meth-ylation asymmetry on gene expression) modulate the susceptibility of the general population to frequent, multi-factorial diseases affecting specific organs. An example of this is SD-ASM in the PEAR1 intron 1, which is linked to platelet reactivity and cardiovascular dis-ease [24]. Another example is SD-ASM in FKBP5, a gene encoding a cochaperone of the glucocorticoid receptor with a potential role in the stress hormone-regulating hypothalamic–pituitary–adrenal axis [25], which poses an increased risk to stress-related psychiatric disorders in individuals who suffered an abuse during childhood [26]. Although the modulation of the susceptibility to a com-plex disease by SD-ASM is generally weak and influenced by environmental factors, it is worth noting that 5–10% of all SNPs might be associated with SD-ASMs in the genome of a given tissue of a given individual [19, 20, 27].
Although there are several technologies to study DNA methylation, such as microarrays that genotype bisulfite-converted DNA, or lower resolution capture technolo-gies such as methyl-binding domain (MBD) sequencing
[28], or methylated DNA immunoprecipitation (MeDIP)
sequencing [29], bisulfite sequencing (BS-seq) remains distinct for the ability to read out DNA methylation of a single allele at base-resolution. Importantly, BS-seq can be conducted both in an unbiased genome-wide fash-ion, or in combination with technologies that focus the sequencing to particular regions, either by making use of hybridization or by enzyme digestions [30].
Recent studies have obtained ASM readouts from mapped bisulfite reads, by assigning them to the alleles of each known heterozygous SNP. Methylation levels are then determined for all allele-linked cytosines in the reads (see [20, 31, 32] for recent examples). The ASM cal-culated in this way is interpreted as SD-ASM, and it does not include imprinted ASM nor XCI, since they are not necessarily sequence dependent. Calculating ASM in this fashion is limited by the availability of SNP information from either DNA-seq or SNP-array data, or directly from
the BS-seq reads [33]. However, performing different
types of high-throughput experiments is economically restrictive and time consuming, and deriving SNPs from BS-seq reads can be problematic due to bisulfite conver-sion of DNA (i.e., distinguishing a C/T SNP from a C/T conversion of a methylated cytosine) and imbalanced strand coverage (i.e., when the Watson and Crick strands are not equally or highly covered) [33].
are the only available executable methods that detect ASM without SNP information. In brief, the allelicmeth method creates a contingency table with the counts of methylated and unmethylated reads covering a pair of CpG sites. A score is calculated via Fisher’s exact test that represents the probability that both CpG sites have an equal proportion of methylated–unmethylated reads. amrfinder also calculates ASM but at a regional level. It fits two statistical models, one assuming that both alleles are equally methylated, and the other assuming different methylation states for the two alleles. A region is consid-ered to have ASM by comparing the likelihoods of the
two models. A more recent algorithm termed
Methyl-Mosaic relies on the principle that bimodal methylation patterns, independent from the genotype, are a good indicator of ASM [35]; however, to our knowledge there is no publicly available implementation.
Based on the current state of ASM detection from BS-seq reads, we set out to develop a simple yet effective method to screen for genomic regions that exhibit loss or gain of ASM between samples from distinct conditions. The methods mentioned above detect ASM in individual samples; however, they do not allow a flexible compari-son between groups of samples, such as that performed in a typical differential methylation analysis [36, 37], where the goal is to find the effect of treatments or dis-eases on methylation, reflected as increase or decrease of methylation levels. Here, we are interested in per-forming such differential analysis but focusing on the effect of ASM, reflected as gain or loss of allele specific-ity. For this task, we introduce DAMEfinder (Differential Allele-specific MEthylation finder), an R package [38] that consists of (i) a scoring function that reflects ASM for several samples; (ii) integration with limma [39] and bumphunter [40] to detect differentially allele-specific methylated regions (DAMEs); and (iii) accurate estima-tion of false discovery rates (FDR). We demonstrate the ASM score and DAMEfinder on two real datasets, one based on targeted enrichment BS-seq, comparing nor-mal colonic mucosa to cancerous colorectal lesions, and another on whole genome BS-seq (WGBS), comparing blood monocytes from healthy females and males.
Results
The overall DAMEfinder workflow
Figure 1 gives an overview of the pipeline. We make con-siderable use of existing tools and keep inputs/outputs in standard formats. To make use of the package, the user must independently use bismark to map paired-end BS-seq reads against a reference genome (Fig. 1a). Once this is done, the user has the option to detect ASM for each sample in two ways: (1) using the output from methtuple [41], which computes read counts of pairs of nearby CpG
sites. From these counts, we compute an ASM score; (2) using an additional VCF file containing heterozy-gous SNPs. For each SNP we call methylation from the reads containing that SNP, and calculate an ASM score for each CpG site (Fig. 1b and details). From the set of scores, we leverage routines from the bumphunter and limma packages to calculate a statistic and detect regions showing persistent change in ASM. We call these regions
DAMEs (Fig. 1c). We estimate and control a regional
FDR through permutations or by implementation of the Simes method [42].
The ASM score
SNP‑based ASM
The most straightforward way of detecting SD-ASM from mapped reads is by assigning them to either of the alleles at each known heterozygous SNP. Methylation status is then determined for each allele-linked cytosine in the reads. We have used this strategy to calculate an SNP-based ASM score ( ASMisnp ), and considered it
to be the genuine form of SD-ASM, since it is derived from an extra layer of information, i.e., the genotype of an individual.
Ideally, the genotype should originate from genome sequencing; however, this type of data is scarce in large cohorts of samples. Therefore, we have employed Bis-SNP [33] to call SNPs directly from the BS-seq reads. The method uses Bayesian methods to infer strand-specific base calls, with SNP population frequencies as prior probabilities.
We extract the reads overlapping every heterozygous SNP in a VCF file with the GenomicAlignments R pack-age [44], and for each read determine the methylation status of the CpG sites. Sites that are not in reads con-taining an SNP are not considered. We calculate ASMisnp
for each CpG site i contained in the reads of an SNP as
where XMir and XMia correspond to the number of methyl-ated reads from the reference r allele, and the alternative
a allele. In practice, it makes no difference which allele is the reference or the alternative. Xir and Xia correspond to the total number of reads covering the reference and the alternative allele (see schematic diagram in Fig. 1b). The score ranges from 0 to 1, where a score of 1 repre-sents the scenario where one allele is completely methyl-ated, and the other allele is fully unmethylated; a value of 0 means an equal proportion of methylated sites in both alleles.
(1)
ASMisnp=
XMir Xir −
Page 4 of 19 Orjuela et al. Epigenetics & Chromatin (2020) 13:25
Tuple‑based ASM
Instead of restricting ASM detection to allele-linked reads, we can make use of an entire set of CpG sites to screen for different types of ASM. For this task, we designed a score under the assumption that pairs of CpG sites in the same DNA molecule (read) are correlated [45,
46], and that in a biallelic organism, intermediate levels
of methylation could represent allele specificity, i.e., the proportion of methylated reads in a pair of CpG sites or tuple is close to 0.5. We make this assumption knowing that other scenarios exist in which intermediate methyla-tion can occur (e.g., cellular heterogeneity). Therefore, we consider this score only as a proxy for ASM.
We calculate the score as a weighted log-odds ratio:
where X·i corresponds to the number of reads covering a unique pair of CpG sites i, generated by running the methtuple tool. CpG sites in a pair can be methylated MM, unmethylated UU, or mixed (UM or MU). A con-stant c is added to every Xi to avoid dividing by 0. The log-odds ratio is multiplied by a weight, wi , which is set
such that the ratio of MM:UU can depart somewhat from a 50:50 relation, while MM or UU tuples, which repre-sent absence of allele specificity, are attenuated to 0. This is calculated as
where ǫ represents the degree of allowed departure from
a 50:50 ratio (i.e., 0.5), and θi:
represents the moderated proportion of MM to MM
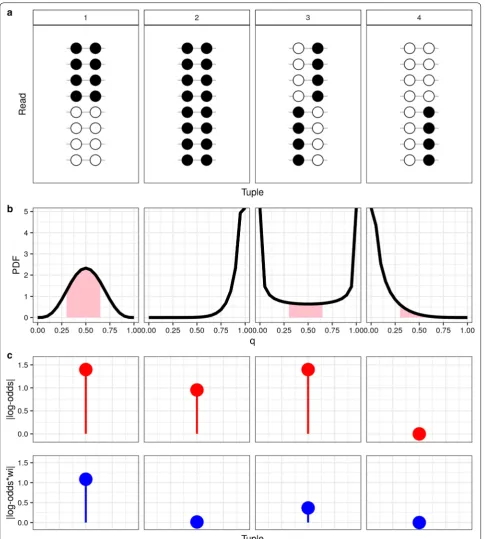
+ UU reads. It is based on a beta model, where γ is a hyperparameter set to penalize fully methylated or fully unmethylated tuples, i.e., when the MM:UU balance goes farther from a 50:50 relation. In Fig. 2, we show 4 exam-ples in which the score is calculated with and without wi . According to our assumption, example 1 is the best case of ASM (Fig. 2a), yet we see for example, that examples 1 and 3 have the same absolute log-odds ratio (without wi ),
but imposing the weight reduces the score in example 3 below that of example 1 (Fig. 2c). We also demonstrate how the ASMtuple score is affected by the tuning of ǫ and γ (Additional file 1: Figure S13A, B). ǫ has the most impact
in the score, i.e., smaller departures from 50:50 result in lower values of ASMituple , whereas only very large values of γ (e.g. > 5) influence the distribution of ASMituple.
ASM score validation
SD‑ASM
To test the ASMtuple score, we used the ASMsnp score
as an indicator of true SD-ASM, and calculated the
ASMtuple score, the allelicmeth and amrfinder scores,
and a score representing absolute deviation from 50% methylation (methdeviation; see “Methods”), in a single normal tissue sample from the colorectal cancer (CRC) dataset (see “Methods”). We set CpG tuples with ASMsnp
above specific thresholds (0.5 and 0.8) to be true ASM. These resulted in 1284 and 69 CpG tuples with SD-ASM, respectively, which corresponded to 0.069% and 0.003% of all the tuples scanned in this sample.
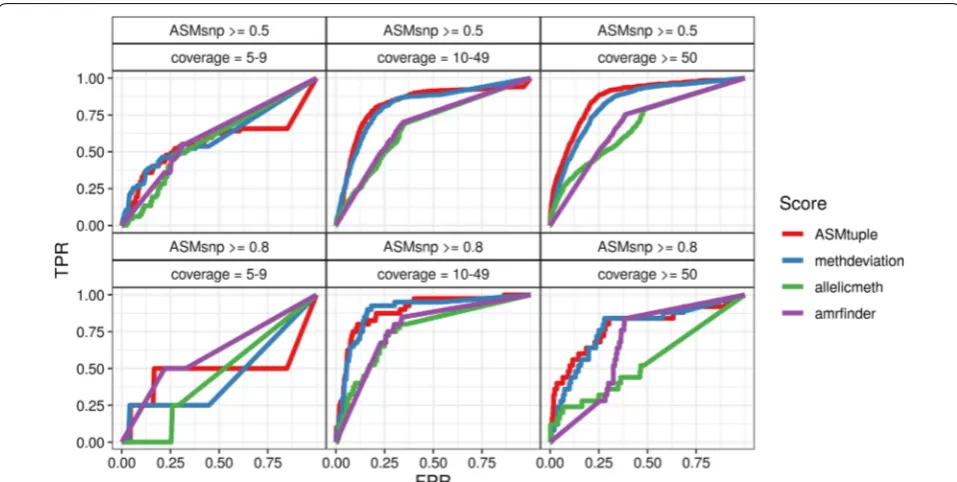
Figure 3 shows the true-positive rate (TPR) and false-positive rate (FPR) achieved by the 4 evaluated scores
(2) ASMituple=
log10(X i
MM+c)(XUUi +c) (XMUi +c)(XUMi +c)
·wi (3) wi =P(0.5−ǫ < θi<0.5+ǫ|XMMi ,XUUi ,γ )
(4) θi|XMMi ,XUUi ,γ ∼Beta(γ +XMMi ,γ +XUUi ),
at different CpG tuples classified in 3 different coverage thresholds (left to right). Two ASMsnp cutoffs (top to
bot-tom) were chosen as the truth. ASMtuple was consistently more sensitive and specific than the other three scores, especially as coverage increased. Intermediate meth-ylation values yielded comparable results; however, the
ASMtuple was able to detect more cases of “real” ASM in
all combinations. allelicmeth increasingly failed as cov-erage and ASMsnp value increased. amrfinder performed
better than allelicmeth at higher true values. The dis-tributions of the scores from each facet in Fig. 3 are in Additional file 1: Figures S11A, B and S12A–D.
Chromosome X inactivation
As an additional validation of the ASMtuple score, we
used the blood dataset (see “Methods”) to compare
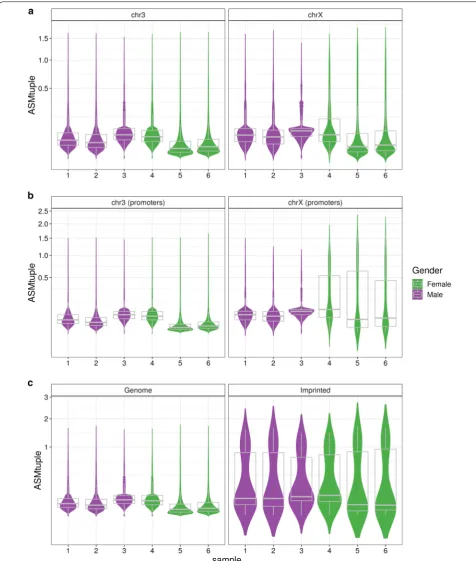
healthy male and female samples. In principle, females should exhibit allele specificity in the X chromosome due to XCI and thus higher ASMtuple values. Figure 4 shows the distribution of ASMtuple values across all samples in the dataset, in chromosome 3 and chromosome X. From a whole genome perspective (Fig. 4a), there is little dif-ference between males and females in X chromosome (mean of sample-means females: 0.13, males: 0.098), and practically no difference in chromosome 3 (0.060, 0.074). However, by focusing on CpG tuples located in promoter regions (1 kb upstream the transcription start site—TSS), we observed ASM values increased only in chromosome X of females (Fig. 4b; 0.30, 0.088).
Imprinted ASM
In the same blood dataset, we also compared the ASMtuple scores from the promoters of imprinted genes reported in [11] (see “Methods”) to the scores from the rest of the genome (Fig. 4c). As expected, ASM scores were higher in the tuples located within imprinted pro-moters, for both males and females.
DAME detection
As depicted in Fig. 1, after calculating ASMtuple or
ASMsnp in the DAMEfinder pipeline, we continue to
Page 6 of 19 Orjuela et al. Epigenetics & Chromatin (2020) 13:25
Fig. 2 ASMtuple weighting strategy. We show 4 examples of read-patterns in a single tuple. a All cases have 8 reads covering a single tuple. Example 1 has XMMi and XUUi =4 , and XUMi , XMUi =0 . Example 2 XMMi =8 , the rest of combinations 0. Example 3 XUMi , XMUi =4 , and example 4 XUUi , XUMi =4 . b Probability density function (PDF) for each Beta(γ+XMMi ,γ+XUUi ) of the 4 examples, when γ =0.5 . Pink-shaded area corresponds to 0.5±ǫ ,
To detect DAMEs, we first obtain a regression coef-ficient βij followed by a t-statistic using the R
pack-age limma [39] (see “Methods”), on the transformed ASMituple score, or on the ASMisnp score, for each CpG
position i (tuple or site), across j samples (see “Methods” for model).
We detect regions of contiguous CpG positions where
βij persistently deviates in the same direction from zero;
this is done in two ways:
Permuting bumphunted regions
The regionFinder function from bumphunter is used to scan for regions (R) where CpG sites close in proximity have βij above a user-defined threshold K, which
corre-sponds to a percentile of βij . For each region detected, the
function also calculates an area A=
iǫR|βij| . For the
CRC dataset, we used the default value K =0.7 , and
dis-tance between CpG positions up to 100 bp.
We assess significance of every region detected by assigning an empirical p value. For every non-redundant permutation of the coefficient of interest (chosen from a column in the design matrix X), regionFinder is applied again. All the areas generated by all permutations are pooled to generate a null distribution of areas [47]. We
define the p values for each R as the proportion of null areas greater than the observed A; p values are adjusted
using the Benjamini–Hochberg method [48] from the
stats R package [38].
Cluster‑wise correction
Optionally, we define regions that exhibit changes in ASM by first generating clusters of CpG sites with clus -terMaker. For each cluster, we aggregate all the CpG
position p values generated by limma using the Simes
method [42], which is applicable when test statistics
exhibit positive dependence [49]. As implemented in
[50], we calculate
where p(1),. . .,p(n) are the ordered p values of each CpG
position i in a cluster c, and n is the number of CpG posi-tions in the cluster. pc summarizes evidence against the null hypothesis that all CpG positions are not differential. We adjust pc as above.
Evaluation of DAME detection
We compared the different strategies to control FDR in the DAME detection pipeline, by applying them to a semi-simulated dataset and plotting the TPR and FDR
(5) pc=min{np(i)/(i)}
Page 8 of 19 Orjuela et al. Epigenetics & Chromatin (2020) 13:25
achieved at different adjusted p value thresholds (0.01, 0.05, 0.1) (Fig. 5). We designed a small set of simulated DAMEs to evaluate the FDR control of the above strate-gies. We took 6 samples of normal tissue from the CRC dataset and calculated ASMsnp scores in each of them.
We assumed these scores to be the ASMsnp baseline in
the simulation. Then, we divided the samples into two groups of three samples each, and for all the CpG sites covered by the 6 samples, we defined clusters of con-tiguous CpG sites. For each truly differential cluster, we added signal to a randomly determined subset of adja-cent CpG sites (see “Methods” for more details).
Overall, the empirical p value controlled the FDR,
whereas the Simes method tended to be less conservative but more sensitive (Fig. 5 and Additional file 1: Figure S1 for same plot tested with different parameters).
Discovery of DAMEs in colorectal cancer dataset
We used a previously published dataset comprising 6 patients with diagnosed colorectal cancer, three with CIMP (CpG-Island Methylator Phenotype), and three
without CIMP (see “Methods”); DNA from normal
mucosa and cancer lesions was bisulfite-sequenced. We ran DAMEfinder on this dataset in both modes, there-fore obtaining the ASMsnp and ASMtuple scores. After
fil-tering for coverage (more than 5 reads) and for sites with more than 80% of samples covered, we obtained infor-mation for 43,420 CpG sites using the ASMsnp . Using
the tuple score, we obtained summaries for 1,849,831 CpG pairs. Within the DAMEfinder pipeline, we gener-ated multi-dimensional scaling (MDS) plots using each score (Fig. 6a, b), and observed that both scores are able to recover distinct CRC phenotypes. However using the
ASMtuple score, samples cluster according to tissue type
(normals, CIMP cancer and non-CIMP cancer) (Fig. 6a),
whereas using the ASMsnp score, only the two cancer
Page 10 of 19 Orjuela et al. Epigenetics & Chromatin (2020) 13:25
Fig. 6 ASM scores on the CRC dataset. a MDS plot of all the samples in the CRC dataset, based on all the the ASMtuple scores. Scores were square-root transformed before plotting. b MDS plot based on the ASMsnp scores. Scores were arcsine transformed. MDS plots were generated with
the plotMDS function from limma and the top 1000 most variable positions. N: normal mucosa; C: CRC. Each pair of samples from the 6 patients
with CRC is numbered from 1 to 6. c A DAME detected in CIMP CRCs using the ASMtuple score shows a higher signal than using the ASMsnp score.
types are distinguishable, while the normal tissues cluster with their matched cancers (Fig. 6b).
We screened for DAMEs comparing cancer to nor-mal tissue, in CIMP and non-CIMP independently. Both SNP and tuple-based scores were calculated, and for each separately, DAMEs were detected using the Cluster-wise correction (Additional file 1: Figure S2 for p values of both Cluster-wise correction and
Per-mutations). When using the ASMsnp score, we could
not detect DAMEs with an adjusted p value below
0.05. Using the ASMtuple score, we were able to detect 4051 DAMEs in the CIMP samples (versus matched normal samples), and 258 in the non-CIMP samples. We noticed that regions detected using ASMtuple were also detected using ASMsnp , but with lower strength
of signal and with p values above a cutoff of 0.05 (one example in Fig. 6c), and other regions showing contra-dicting changes in ASM (one example in Additional file 1: Figures S3, S4). Although the latter was rare (from all the 2219 DAMES detected in CIMP using
ASMsnp , without a p value cutoff, only 0.36% disagreed
on the ASM change), the cases we did find, overlapped
tuple-DAMEs with the highest p values, e.g., regions
at the bottom of the DAME list. In addition, we found DAMEs corresponding to known regions exhibit-ing loss of imprintexhibit-ing in cancer, includexhibit-ing those in the genes MEG3, H19, and GNAS [13, 51] (Fig. 7).
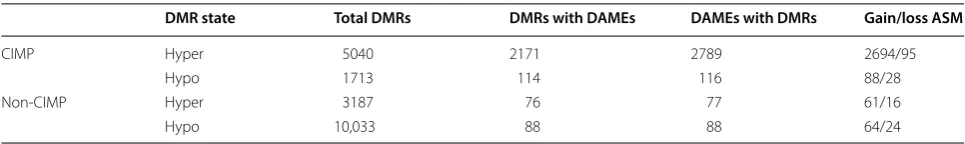
Considering the high number of DAMEs detected in the CIMP contrast compared to the non-CIMP contrast, we thought this could be a consequence of hypermeth-ylation in CIMP [52], and so a typical DMR (differentially methylated region) analysis would be able to detect these same regions. To corroborate this, we performed a DMR analysis on the CIMP and non-CIMP contrasts using the dmrseq R package [47] (Additional file 1: Figure S5 for top DAMEs and DMRs per comparison). We found that from the 6753 DMRs (5,040 hypermethylated, 1713 hypomethylated) detected in the CIMP comparison,
2285 overlap with DAMEs (hypermethylated DMRs =
32%, hypomethylated DMRs = 1.7% from total DMRs),
and from 13,220 DMRs in the non-CIMP comparison,
only 164 overlap (hypermethylated DMRs = 0.57%,
hypomethylated DMRs = 0.66%) (Table 1).
Because of this overlap, we conclude that a proportion (1146 [28%] in CIMP, 93 [36%] in non-CIMP) of DAMEs would not be detected via a typical DMR analysis.
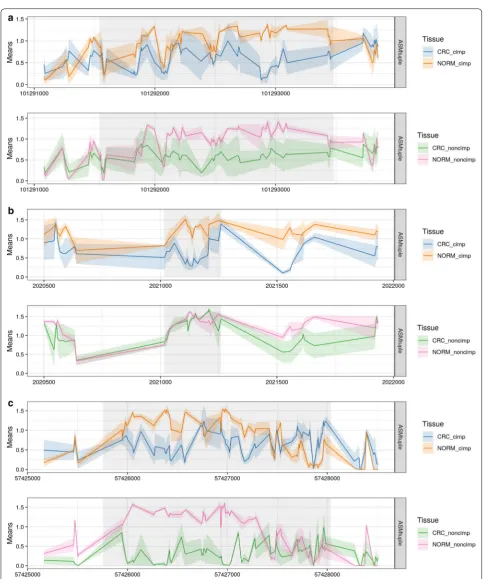
Fig-ure 8 shows 4 examples of DAMEs missed by the DMR
detection. In principle, these regions exhibit differential methylation according to the global methylation levels (bottom panels of each region); however, the hypermeth-ylation reaches intermediate values, which might not represent a sufficiently high effect size to be detected. In the context of differential ASM, these intermediate values
are highly scored, based also on the allele specificity of the change. Therefore, even though these are not highly ranked DAMEs, they were still detected as such.
Discussion
We have developed a scoring method that provides a measure of allele-specific methylation, and developed a method (DAMEfinder) that detects regions that display loss or gain of allele-specific methylation, by leveraging existing methods into a single framework. We offer the possibility to detect regions exhibiting ASM based on genotype information ( ASMsnp ), or independent from it
( ASMtuple ). The latter offers a novel approach for
iden-tifying different types of ASM, such as imprinted, non-imprinted, XCI, and new types yet to be described.
We have considered the ASMsnp score as genuine
SD-ASM, and calculated it using heterozygous SNPs. We employed Bis-SNP to extract the SNPs from the BS-seq reads. The methods’ accuracy (as occurs with normal SNP callers) requires a high read depth, because infor-mation from both strands of DNA is necessary to infer if a cytosine has been bisulfite-converted or not. The authors of the tool found that heterozygous SNPs require a minimum of 10X coverage to be accurately called (80% sensitivity), and as depth is gradually increased to 30X, sensitivity reaches 100%. For our colorectal cancer analy-sis we only used coverages above 10X, and observed that increasing coverages did not affect our ASMsnp score
(Additional file 1: Figure S7D). We also observed that the ROC curves from Fig. 3 did not change in the last two coverage groups (10–49 and ≥ 50).
Regarding the performance of the SNP-independent scores (allelicmeth, deviations from 50% methyla-tion and ASMtuple ), we observed that ASMtuple showed favorable performance at identifying individual cases of SD-ASM at sites with different coverage levels. The scaled methylation also demonstrated high sensitivity and specificity, and as the true SD-ASM score ( ASMsnp )
and coverage increased, results were close to those of the ASMtuple score. Nonetheless, the advantage of using the
ASMtuple score is the flexibility in its implementation; in
specific, the weight that is added to the log-odd ratio can be easily adapted as described in “Methods”.
Page 12 of 19 Orjuela et al. Epigenetics & Chromatin (2020) 13:25
the variability, which in turn implies consistent ASM in the majority of samples from an experimental condition.
Our ASMtuple score was able to distinguish female from male samples based on XCI, which we have considered as another case of true ASM. When analyzing the entire genome, we did not find differences between males and females. The fact that the entire female chromosome X does not contain high ASM, or that the global distribu-tion of methyladistribu-tion is not skewed toward intermediate values has been shown before [53]. In addition, the pres-ence of genes escaping XCI may also affect global ASM. It is known that 15% of genes escape XCI, and an additional 10% varies in the inactivation state among the female population [54]. Therefore, a mixture of ASM scores in females is an accurate reflection of the complex dynamics of XCI.
We were also able to validate the score by compar-ing the promoters of 89 known imprinted genes with the rest of the genome. We observed an increase in the ASM of imprinted genes, with a bimodal distribution of ASM scores. This can be a reflection of tissue or cell type specificity in imprinted genes, meaning not all known imprinted genes show ASM throughout the somatic cell lineage, as is traditionally assumed [55]. Studies have reported tissue and cell type-specific allelic expression [56, 57] and tissue-specific ASM [23] in known imprinted genes, supporting our finding that imprinting is not equally maintained in all genes in every tissue and/or cell type.
Although the ASMtuple score is able to recover differ-ent cases of ASM, we acknowledge that there are other cases not linked to ASM, such as cellular heterogeneity, in which a proportion of reads are fully methylated, and the rest are fully unmethylated. With the technology we have used (BS-seq), it is very difficult to discern hetero-geneity from real ASM in some locations, and we believe that to identify ASM, single-cell BS-seq (scBS-seq) data may become the most suitable high-throughput technol-ogy. Previous studies have shown the use of scBS-seq to detect heterogeneity within a single cell type [58] and cell states [59]. However, the accurate detection of methyla-tion from scBS-seq is still a difficult task, mainly due to the extensive DNA damage from the bisulfite treatment.
There are currently around 21 different protocols to pro-file single-cell DNA methylation, mostly bisulfite-based, each one aiming at improving recovery of CpGs and mapping efficiency [60]. However, it has not been estab-lished how these methods compare to each other, and a consistent framework for their data analysis does not exist, as is the case for bulk BS-seq protocols. Therefore, there is still work ahead to precisely quantify ASM using scBS-seq.
Another limitation arises when considering cancerous tissue samples, because of high intra-tumor heterogene-ity of several biological features, including cellular mor-phology and gene expression [61]. Our method does not account for this additional variability, and we recognize this as a limitation. However, we believe the ASM scores are still robust enough to detect allelic patterns as shown by the recovery of the colorectal cancer subtypes in Fig. 6
and that even changes in cell composition, which would also affect DMR detection, can be interesting events to understand.
Regarding DAME detection, we offer two strategies that differ in the statistical stringency. In our experi-ence, fewer regions are obtained by permuting the group labels, since the FDR control is more conservative. How-ever, more regions can always be detected by setting the
K threshold lower, while still controlling the FDR. The Cluster-wise correction, or Simes method, is less con-servative, and therefore can be used as an alternative to extract more detection power. This is likely because of the global hypothesis tested at each DAME, where at least one CpG site in a region is changed.
We applied DAMEfinder to a real dataset to detect DAMEs in CIMP and non-CIMP cancers (versus paired
normal samples). We found that the ASMtuple and
ASMsnp scores are consistent in describing the CIMP
status of samples, but as expected, the ASMsnp score was
dominated by SD-ASM, because its calculation relies on the heterozygous SNPs of each sample; paired samples thus clustered with each other not by tissue, as observed with the ASMtuple score. In addition, ASMtuple typically
detected more DAMEs, which we attribute to two rea-sons. First, there are ∼40× more places in the genome where ASMtuple can be calculated. Second, because the Table 1 DMRs overlapping DAMEs
Hyper- or hypo-methylated DMR refers to the increase or decrease of methylation in cancers in comparison with paired normal samples, while gain or loss of ASM refers to whether cancers have more or less allele specificity than paired normal samples
DMR state Total DMRs DMRs with DAMEs DAMEs with DMRs Gain/loss ASM
CIMP Hyper 5040 2171 2789 2694/95
Hypo 1713 114 116 88/28
Non-CIMP Hyper 3187 76 77 61/16
Page 14 of 19 Orjuela et al. Epigenetics & Chromatin (2020) 13:25
tuple score is a more general calculation, i.e., it quanti-fies the mixing of methylated and unmethylated reads, instead of relying on allele information.
We also compared the DAME detection to a typical DMR analysis of the same samples, and found that DMRs detected may or may not include DAMEs. Most DMRs overlapping DAMEs were hypermethylated in CIMP cancers, which led us to conclude that most DAMEs reflected gain of ASM from a low methylation baseline. This result shows how differential ASM is a more refined definition of differential methylation, and can therefore provide additional information regarding methylation disruptions in disease (or different conditions).
Conclusion
Cytosine methylation restricted to only one allele, i.e., ASM, is a particular pattern of methylation that should be approached differently than the rest of the human methylome. We have designed DAMEfinder to screen for ASM and identify regions of differential ASM. The lat-ter can be viewed as a special case of differential meth-ylation. Previous studies have quantified ASM within one sample; however, to our knowledge, there is no method that identifies loss or gain of ASM between conditions. DAMEfinder fills this gap. Studying changes in ASM can help us understand epigenetic processes in development and diseases. To this aim, further studies are necessary to associate ASM to allele-specific gene expression and to verify whether gain or loss of ASM would affect gene dosage and eventually phenotypes.
Methods
The code used to generate the article figures and data processing is available from https ://githu b.com/markr obins onuzh /allel e_speci ficit y_paper . The R package is available from https ://githu b.com/markr obins onuzh / DAMEfi nder .
Datasets
Colorectal cancer (CRC) dataset
The CRC dataset came from our published study [52]
describing the progression of a methylation signature from pre-cancerous lesions to colorectal cancer tissue in two types of CRC. We used 12 samples from 6 patients with sporadic cancer (arrayexpress accession number:
E-MTAB-6949, Table 2). For each sample, DNA from
both CRC lesion and normal mucosa was bisulfite-treated and sequenced according the Roche SeqCapEpi CpGiant protocol, where only DNA captured by probes was sequenced. We analyzed 12 files in total. For details on data generation refer to [52].
Blood dataset
We used data generated by the Blueprint Consortium. We downloaded raw paired-end fastq files from venous blood of 3 healthy females and 3 healthy males (CD14-positive, CD16-negative classical monocyte, EGA data-set: EGAD00001002523) (Table 3).
Quality control and mapping
Quality control was done using fastQC (version 0.11.4) [62]. The reads were subsequently trimmed using Trim -Galore! (version 0.4.5) [63]. Reads were mapped to the
reference genome using bismark (version 0.18.0). Bow
-tie2 (version 2.2.9) was used to map to genome hg19 in the CRC dataset, and hg38 in the Blood dataset.
Dupli-cate reads were removed with the deduplicate command
from bismark. Deduplicated bam files corresponding to technical replicates in the Blood dataset were merged with samtools merge [64] for each sample.
Table 2 Colorectal cancer sample characteristics
C CRC, N paired sample of normal mucosa, non-CIMP the mismatch repair gene MLH1 normally expressed, CIMP MLH1 silenced by promoter hypermethylation a Sample ID changed from arrayexpress
Sample IDa CIMP
status Sex Number of mapped reads
Average
coverage Average coverage in probes
N1 76,801,310 3.025 78.06
C1 Non-CIMP F 68,010,696 2.47 61.62
N2 74,815,980 2.97 69.96
C2 CIMP M 62,122,636 2.47 63.16
N3 66,608,688 2.64 63.88
C3 Non-CIMP M 57,828,284 2.28 57.52
N4 66,108,442 2.62 58.61
C4 CIMP M 59,390,888 2.35 61.25
N5 70,070,214 2.56 59.0032
C5 Non-CIMP M 68,575,884 2.50 49.98
N6 59,056,548 2.15 49.52
C6 CIMP F 79,669,532 2.92 71.39
Table 3 Blood data sample characteristics
a Sample ID changed from source
Sample IDa Sex Number of mapped
reads Average coverage
1 M 390,837,942 12.73
2 M 420,368,438 13.70
3 M 305,490,164 9.95
4 F 383,782,378 12.50
5 F 581,667,082 18.86
Page 16 of 19 Orjuela et al. Epigenetics & Chromatin (2020) 13:25
SNP calling
We extracted heterozygous SNPs from the CRC dataset bam files with Bis-SNP (version 1.0.0) [33] by running the BisulfiteGenotyper mode with default parameters,
using the dbSNP (Build150) [65] generated VCF file
from the NCBI Human Variation Sets (GRCh37p13, last modified:07-10-2017).
methtuple
methtuple (version 1.5.3) [41] was used to produce a list of unique tuples of size two and the corresponding MM, MU, UM, and UU counts where M stands for “methyl-ated” and U for “unmethyl“methyl-ated”. The bam files of each sample are those of PE reads and so they were sorted by queryname before using methtuple, as the tool demands it.
Tuple‑based ASM score
We used γ =0.5 and ǫ=0.2 for all analyses, and allowed for a maximum distance of 150 base pairs between two CpGs in a tuple. Additional file 1: Figure S6 shows
ASMtuple diagnostic plots for the CRC dataset (and
Addi-tional file 1: Figure S7 with ASMsnp).
ASMtuple score transformation
We apply a square root transformation to the ASMtuple
score before running limma, to get a more stable mean– variance relationship.
allelicmeth
allelicmeth (MethPipe version 3.4.3) [34] is a tool that also detects ASM for a given sample directly from BS-seq reads. The tool is part of the MethPipe pipeline
[66], which does not use standard bam files. We used
commands from the pipeline to transform our bismark bam files from the CRC dataset into mr files, the input to allelicmeth. The output is a bed file with p values for each pair of CpG sites, reflecting the degree of allele specificity.
amrfinder
amrfinder (MethPipe version 3.4.3) [34] also detects ASM from the BS-seq reads, however it generates regional scores. As with allelicmeth, we transformed bismark bam files from the CRC dataset into mr files, then ran methstates to generate epiread files, and used these to run amrfinder with default parameters. The output is a bed file with p values for each genomic region with consistent ASM.
(6)
L(ASMtuple)=
ASMtuple Score evaluation
We converted the ASMsnp into a tuple-ASMsnp as
XMi1r+XMi2r
Xi1r+Xi2r −
XMi1a+XMi2a
Xi1a+Xi2a
, where 1 and 2 are the the first and second CpG site in a tuple i. We treated this converted score as true allele-specific methylation to test our scores at two thresholds: ≥ 0.5 and ≥ 0.8.
We transformed the p values generated by allelicmeth and amrfinder with a negative log base 10. We assigned the same transformed p values to all CpG tuples included in a single amrfinder region.
We also compared to a score based on whether the proportion of methylated reads to total number of reads deviates from 0.5, but transformed so a value of 0.5 is indicative of high ASM, and 1 or 0 is the lowest ASM. The score is 1−2(methylation−0.5
).
We used these four metrics to build ROC curves at dif-ferent read coverages (5–9, 10–49 and ≥ 50) and at dif-ferent thresholds of ASMsnp , for a single normal mucosa
sample in the CRC dataset.
As an additional validation, we used the Blood data-set to obtain the ASMtuple scores from the promoters
of known imprinted genes reported in [11]. Only gene
symbols that were traceable with biomaRt [67, 68] were included, and genes labelled to be imprinted in placenta were removed, as indicated in [69, 70].
t‑statistic calculation
From the limma R package [39], we use lmFit to fit a lin-ear model for each CpG position, and eBayes to calcu-late a moderated t-statistic on the transformed ASMtuple
score, or on the ASMsnp score. For the former, we set the
median of two CpGs in a tuple as the CpG position of that tuple. Transformed ASM scores across samples are given as input to lmFit, as well as a design matrix that specifies the conditions of the samples of interest. As specified in [39, 71], a CpG site-wise or tuple-wise linear model is defined as
where for each CpG site or tuple i, we have a vector of ASM scores yi and a design matrix X that relates these
values to some coefficients of interest βi.
In the end, we test for a specific contrast that Ho:Cβij=0.
Smoothing
We group the positions into genomic clusters using the clusterMaker function from the bumphunter R pack-age [40]. Then, we use the loessByCluster function to perform loess within each cluster, and obtain β˜ij , our
smoothed estimate.
FDR control evaluation
We selected 6 samples of normal tissue from the CRC dataset and calculated their ASMsnp scores as a baseline
in the simulation. We divided the samples in 2 groups of 3. We generated 1038 clusters of CpGs with the clus -terMaker function from the bumphunter package, and set a maximum distance between CpGs of 100 bp (Addi-tional file 1: Figure S8). We chose 20% of all clusters to be truly differential, and to each of them added effect to a number of randomly selected consecutive CpGs. The effect size is the same for every chosen CpG per clus-ter, and is obtained by inverse transform sampling of the form FX−1(u)=x , where u∼Unif(0.35, 0.75) , and FX(x) the CDF of Beta(1, 2.5) [47] (Additional file 1:
Fig-ure S9). In addition, for each truly differential cluster, we randomly selected the sign of the effect size (positive or negative), as well as the group of samples that contains the effect size.
We generated 50 of these simulations, and for each of them, ran DAMEfinder with the cluster-wise correc-tion, and the permutation correction (Additional file 1: Figure S10 for distributions of null and observed areas) with three different K thresholds: 0.2, 0.5, 0.8. We used the iCOBRA R package (version 1.12.1) [72] to calculate TPR and FDR at different adjusted p value thresholds: 0.01, 0.05, 0.1.
DMR detection
We identified DMRs with the dmrseq R package (version 1.5.11) [47] for each cancer subtype. We specified the
tis-sue via the testCovariate parameter (CIMP, non-CIMP
or normal), and the patient with the adjustCovariate
parameter. The cutoff parameter (cutoff of the single CpG coefficient that is used to discover candidate regions) was set as 0.05 and the rest of parameters were set as default.
Supplementary information
Supplementary information accompanies this paper at https ://doi. org/10.1186/s1307 2-020-00346 -8.
Additional file 1. Additional figures.
Acknowledgements
The authors thank Abdullah Kahraman for technical support at previous stages of the project; Pierre-Luc Germain and Izaskun Mallona for feedback on the manuscript; and the Robinson lab for feedback on figures and analysis.
Authors’ contributions
MM and MDR conceived the study. SO, DM and MDR wrote package, performed analyses. SO, GM and MDR wrote the paper. All authors read and approved the final manuscript.
Funding
GM and SO acknowledge funding from the SNF Grant 310030-160163/1. MDR acknowledges support from the University Research Priority Program Evolu-tion in AcEvolu-tion at the University of Zurich.
Ethics approval and consent to participate
The bulk of the data used in this study is from public repositories. This study makes use of data generated by the Blueprint Consortium. A full list of the investigators who contributed to the generation of the data is available from http://www.bluep rint-epige nome.eu. Funding for the project was provided by the European Union’s Seventh Framework Programme (FP7/2007-2013) under grant agreement no 282510 – BLUEPRINT.
Consent for publication All authors consent to publication.
Competing interests
The authors declare that they have no competing interests.
Author details
1 Institute of Molecular Life Sciences and SIB Swiss Institute of Bioinformatics, University of Zurich, Winterthurerstrasse 190, 8057 Zurich, Switzerland. 2 Insti-tute of Molecular Cancer Research, University of Zurich, Winterthurerstrasse 190, 8057 Zurich, Switzerland. 3 Friedrich Miescher Institute for Biomedical Research, Maulbeerstrasse 66, 4058 Basel, Switzerland.
Received: 9 October 2019 Accepted: 21 May 2020
References
1. Cedar H, Bergman Y. Linking DNA methylation and histone modification: patterns and paradigms. Nat Rev Genet. 2009;10:295–304. https ://doi. org/10.1038/nrg25 40.
2. Bonasio R, Tu S, Reinberg D. Molecular signals of epigenetic states. Sci-ence. 2010;330(6004):612–6. https ://doi.org/10.1126/scien ce.11910 78. 3. Bird AP. Use of restriction enzymes to study eukaryotic DNA methylation:
II. the symmetry of methylated sites supports semi-conservative copying of the methylation pattern. J Mol Biol. 1978;118(1):49–60. https ://doi. org/10.1016/0022-2836(78)90243 -7.
4. Suzuki MM, Bird A. DNA methylation landscapes: provocative insights from epigenomics. Nat Rev Genet. 2008;9:465–76. https ://doi. org/10.1038/nrg23 41.
5. Bergman Y, Cedar H. DNA methylation dynamics in health and disease. Nat Struct Mol Biol. 2013;20:274–81. https ://doi.org/10.1038/nsmb.2518. 6. Clark SJ, Statham A, Stirzaker C, Molloy PL, Frommer M. DNA methylation:
bisulphite modification and analysis. Nat Protocols. 2006;1(5):2353–64. https ://doi.org/10.1038/nprot .2006.324.
7. Liu Y, Siejka-Zielinska P, Velikova G, Bi Y, Yuan F, Tomkova M, et al. Bisulfite-free direct detection of 5-methylcytosine and 5-hydroxymethylcyto-sine at base resolution. Nat Biotechnol. 2019;37(4):424–9. https ://doi. org/10.1038/s4158 7-019-0041-2.
8. Reddington JP, Pennings S, Meehan RR. Non-canonical functions of the DNA methylome in gene regulation. Biochem J. 2013;451(1):13–23. https ://doi.org/10.1042/BJ201 21585 .
9. Ferguson-Smith AC. Genomic imprinting: the emergence of an epige-netic paradigm. Nat Rev Genet. 2011;12:565–75. https ://doi.org/10.1038/ nrg30 32.
10. Bartolomei MS, Ferguson-Smith AC. Mammalian genomic imprinting. Cold Spring Harb Perspect Biol. 2011;3(7). https ://doi.org/10.1101/cshpe rspec t.a0025 92.
11. Tucci V, Isles AR, Kelsey G, Ferguson-Smith AC. The Erice Imprinting Group: Genomic imprinting and physiological processes in mammals. Cell. 2019;176(5):952–65. https ://doi.org/10.1016/j.cell.2019.01.043. 12. Knoll JHM, Nicholls RD, Magenis RE, Graham JM Jr, Lalande M, Latt SA,
Page 18 of 19 Orjuela et al. Epigenetics & Chromatin (2020) 13:25
13. Cui H, Onyango P, Brandenburg S, Wu Y, Hsieh C-L, Feinberg AP. Loss of imprinting in colorectal cancer linked to hypomethylation of H19 and IGF2. Cancer Res. 2002;62(22):6442–6.
14. Schwienbacher C, Gramantieri L, Scelfo R, Veronese A, Calin GA, Bolondi L, et al. Gain of imprinting at chromosome 11p15: a pathogenetic mechanism identified in human hepatocarcinomas. Proc Natl Acad Sci. 2000;97(10):5445–9. https ://doi.org/10.1073/pnas.09008 7497.
15. Lyon MF. Gene action in the X-chromosome of the Mouse (Mus musculus L.). Nature. 1961;190(4773):372–3. https ://doi.org/10.1038/19037 2a0. 16. Kerkel K, Spadola A, Yuan E, Kosek J, Jiang L, Hod E, et al. Genomic surveys
by methylation-sensitive SNP analysis identify sequence-dependent allele-specific DNA methylation. Nat Genet. 2008;40:904–8. https ://doi. org/10.1038/ng.174.
17. Schalkwyk LC, Meaburn EL, Smith R, Dempster EL, Jeffries AR, Davies MN, et al. Allelic skewing of DNA methylation is widespread across the genome. Am J Hum Genet. 2010;86(2):196–212. https ://doi.org/10.1016/j. ajhg.2010.01.014.
18. Tycko B. Allele-specific DNA methylation: beyond imprinting. Hum Mol Genet. 2010;19(R2):210–20. https ://doi.org/10.1093/hmg/ddq37 6. 19. Gertz J, Varley KE, Reddy TE, Bowling KM, Pauli F, Parker SL, et al. Analysis
of DNA methylation in a three-generation family reveals widespread genetic influence on epigenetic regulation. PLoS Genet. 2011;7(8):1–10. https ://doi.org/10.1371/journ al.pgen.10022 28.
20. Onuchic V, Lurie E, Carrero I, Pawliczek P, Patel RY, Rozowsky J, et al. Allele-specific epigenome maps reveal sequence-dependent stochastic switch-ing at regulatory loci. Science. 2018;361(6409). https ://doi.org/10.1126/ scien ce.aar31 46.
21. Wang H, Lou D, Wang Z. Crosstalk of genetic variants, allele-specific DNA methylation, and environmental factors for complex disease risk. Front Genet. 2019;9:695. https ://doi.org/10.3389/fgene .2018.00695 . 22. Do C, Lang CF, Lin J, Darbary H, Krupska I, Gaba A, et al. Mechanisms and
disease associations of haplotype-dependent allele-specific DNA meth-ylation. Am J Hum Genet. 2016;98(5):934–55. https ://doi.org/10.1016/j. ajhg.2016.03.027.
23. Marzi SJ, Meaburn EL, Dempster EL, Lunnon K, Paya-Cano JL, Smith RG, et al. Tissue-specific patterns of allelically-skewed DNA methylation. Epi-genetics. 2016;11(1):24–35. https ://doi.org/10.1080/15592 294.2015.11274 79.
24. Faraday N, Yanek LR, Yang XP, Mathias R, Herrera-Galeano JE, Suktitipat B, et al. Identification of a specific intronic PEAR1 gene variant associ-ated with greater platelet aggregability and protein expression. Blood. 2011;118(12):3367–75. https ://doi.org/10.1182/blood -2010-11-32078 8. 25. Binder EB, Salyakina D, Lichtner P, Wochnik GM, Ising M, Pütz B, Papiol S,
et al. Polymorphisms in FKBP5 are associated with increased recurrence of depressive episodes and rapid response to antidepressant treatment. Nat Genet. 2004;36(12):1319–25. https ://doi.org/10.1038/ng147 9. 26. Klengel T, Mehta D, Anacker C, Rex-Haffner M, Pruessner JC, Pariante
CM, et al. Allele-specific FKBP5 DNA demethylation mediates gene-childhood trauma interactions. Nat Neurosci. 2012;16:33–41. https ://doi. org/10.1038/nn.3275.
27. Zhang Y, Rohde C, Reinhardt R, Voelcker-Rehage C, Jeltsch A. Non-imprinted allele-specific DNA methylation on human auto-somes. Genome Biol. 2009;10(12):138. https ://doi.org/10.1186/ gb-2009-10-12-r138.
28. Serre D, Lee BH, Ting AH. MBD-isolated Genome Sequencing provides a high-throughput and comprehensive survey of DNA methylation in the human genome. Nucl Acids Res. 2009;38(2):391–9. https ://doi. org/10.1093/nar/gkp99 2.
29. Down TA, Rakyan VK, Turner DJ, Flicek P, Li H, Kulesha E, et al. A bayesian deconvolution strategy for immunoprecipitation-based DNA methylome analysis. Nat Biotechnol. 2008;26:779–85.
30. Laird PW. Principles and challenges of genome-wide DNA methylation analysis. Nat Rev Genet. 2010;11:191–203. https ://doi.org/10.1038/nrg27 32.
31. Cheung WA, Shao X, Morin A, Siroux V, Kwan T, Ge B, et al. Functional variation in allelic methylomes underscores a strong genetic contribu-tion and reveals novel epigenetic alteracontribu-tions in the human epigenome. Genome Biol. 2017;18(1):50. https ://doi.org/10.1186/s1305 9-017-1173-7. 32. Zhu P, Guo H, Ren Y, Hou Y, Dong J, Li R, et al. Single-cell DNA
methy-lome sequencing of human preimplantation embryos. Nat Genet. 2018;50(1):12–9. https ://doi.org/10.1038/s4158 8-017-0007-6.
33. Liu Y, Siegmund KD, Laird PW, Berman BP. Bis-SNP: combined DNA meth-ylation and SNP calling for bisulfite-seq data. Genome Biol. 2012;13(7):61. https ://doi.org/10.1186/gb-2012-13-7-r61.
34. Fang F, Hodges E, Molaro A, Dean M, Hannon GJ, Smith AD. Genomic landscape of human allele-specific DNA methylation. Proc Natl Acad Sci USA. 2012;109(19):7332–7. https ://doi.org/10.1073/pnas.12013 10109 . 35. Martos SN, Li T, Ramos RB, Lou D, Dai H, Xu J-C, et al. Two approaches reveal a new paradigm of ’switchable or genetics-influenced allele-specific DNA methylation’ with potential in human disease. Cell Discov. 2017;3:17038.
36. Robinson MD, Kahraman A, Law CW, Lindsay H, Nowicka M, Weber LM, Zhou X. Statistical methods for detecting differentially methylated loci and regions. Front Genet. 2014;5:324. https ://doi.org/10.3389/fgene .2014.00324 .
37. Shafi A, Mitrea C, Nguyen T, Draghici S. A survey of the approaches for identifying differential methylation using bisulfite sequencing data. Brief Bioinform. 2018;19:737–53. https ://doi.org/10.1093/bib/bbx01 3. 38. R Core Team. R: a language and environment for statistical computing.
Vienna: R Foundation for Statistical Computing; 2019. R Foundation for Statistical Computing. https ://www.R-proje ct.org/.
39. Ritchie ME, Phipson B, Wu D, Hu Y, Law CW, Shi W, Smyth GK. limma pow-ers differential expression analyses for RNA-sequencing and microarray studies. Nucl Acids Res. 2015;43(7):47. https ://doi.org/10.1093/nar/gkv00 7.
40. Jaffe AE, Murakami P, Lee H, Leek JT, Fallin MD, Feinberg AP, Irizarry RA. Bump hunting to identify differentially methylated regions in epigenetic epidemiology studies. Int J Epidemiol. 2012;41(1):200–9. https ://doi. org/10.1093/ije/dyr23 8.
41. Hickey P. Methtuple 2014. https ://githu b.com/PeteH aitch /metht uple. 42. Simes RJ. An improved Bonferroni procedure for multiple tests of sig-nificance. Biometrika. 1986;73(3):751–4. https ://doi.org/10.1093/biome t/73.3.751.
43. Krueger F, Andrews SR. Bismark: a flexible aligner and methylation caller for Bisulfite-Seq applications. Bioinformatics. 2011;27(11):1571–2. https :// doi.org/10.1093/bioin forma tics/btr16 7.
44. Lawrence M, Huber W, Pagès H, Aboyoun P, Carlson M, Gentleman R, et al. Software for computing and annotating genomic ranges. PLoS Comput Biol. 2013;9(8):1–10. https ://doi.org/10.1371/journ al.pcbi.10031 18. 45. Shoemaker R, Deng J, Wang W, Zhang K. Allele-specific methylation
is prevalent and is contributed by cpg-snps in the human genome. Genome Res. 2010;20(7):883–9. https ://doi.org/10.1101/gr.10469 5.109. 46. Affinito O, Palumbo D, Fierro A, Cuomo M, Riso GD, Monticelli A, et al.
Nucleotide distance influences co-methylation between nearby cpg sites. Genomics. 2019. https ://doi.org/10.1016/j.ygeno .2019.05.007. 47. Korthauer K, Chakraborty S, Benjamini Y, Irizarry RA. Detection and
accu-rate false discovery accu-rate control of differentially methylated regions from whole genome bisulfite sequencing. Biostatistics. 2018;007: https ://doi. org/10.1093/biost atist ics/kxy00 7.
48. Benjamini Y, Hochberg Y. Controlling the false discovery rate: a practi-cal and powerful approach to multiple testing. J R Stat Soc Ser B. 1995;57(1):289–300.
49. Benjamini Y, Heller R. Screening for partial conjunction hypoth-eses. Biometrics. 2008;64(4):1215–22. https ://doi.org/10.111 1/j.1541-0420.2007.00984 .x.
50. Lun ATL, Smyth GK. De novo detection of differentially bound regions for ChIP-seq data using peaks and windows: controlling error rates correctly. Nucl Acids Res. 2014;42(11):95. https ://doi.org/10.1093/nar/gku35 1. 51. Menigatti M, Staiano T, Manser CN, Bauerfeind P, Komljenovic A, Robinson
MD, et al. Epigenetic silencing of monoallelically methylated miRNA loci in precancerous colorectal lesions. Oncogenesis. 2013;2:56. https ://doi. org/10.1038/oncsi s.2013.21.
52. Parker HR, Orjuela S, Oliveira AM, Cereatti F, Sauter M, Heinrich H, et al. The proto CpG island methylator phenotype of sessile serrated adenomas/polyps. Epigenetics. 2018;13(10–11):1088–105. https ://doi. org/10.1080/15592 294.2018.15435 04.
•fast, convenient online submission •
thorough peer review by experienced researchers in your field • rapid publication on acceptance
• support for research data, including large and complex data types •
gold Open Access which fosters wider collaboration and increased citations maximum visibility for your research: over 100M website views per year •
At BMC, research is always in progress.
Learn more biomedcentral.com/submissions
Ready to submit your research? Choose BMC and benefit from: 54. Carrel L, Willard HF. X-inactivation profile reveals extensive variability in
X-linked gene expression in females. Nature. 2005;434(7031):400–4. https ://doi.org/10.1038/natur e0347 9.
55. Wood AJ, Oakey RJ. Genomic imprinting in mammals: emerging themes and established theories. PLoS Genet. 2006;2(11):1–9. https ://doi. org/10.1371/journ al.pgen.00201 47.
56. Hippenmeyer S, Johnson RL, Luo L. Mosaic analysis with double mark-ers reveals cell-type-specific paternal growth dominance. Cell Rep. 2013;3(3):960–7. https ://doi.org/10.1016/j.celre p.2013.02.002. 57. Baran Y, Subramaniam M, Biton A, Tukiainen T, Tsang EK, Rivas MA, et al.
The landscape of genomic imprinting across diverse adult human tissues. Genome Res. 2015;25(7):927–36. https ://doi.org/10.1101/gr.19227 8.115. 58. Smallwood SA, Lee HJ, Angermueller C, Krueger F, Saadeh H, Peat J, et al.
Single-cell genome-wide bisulfite sequencing for assessing epigenetic heterogeneity. Nat Methods. 2014;11:817–20. https ://doi.org/10.1038/ nmeth .3035.
59. Farlik M, Sheffield N, Nuzzo A, Datlinger P, Schönegger A, Klughammer J, et al. Single-cell DNA methylome sequencing and bioinformatic infer-ence of epigenomic cell-state dynamics. Cell Rep. 2015;10(8):1386–97. https ://doi.org/10.1016/j.celre p.2015.02.001.
60. Karemaker ID, Vermeulen M. Single-cell DNA methylation profiling: tech-nologies and biological applications. Trends Biotechnol. 2018;36(9):952– 65. https ://doi.org/10.1016/j.tibte ch.2018.04.002.
61. Marusyk A, Polyak K. Tumor heterogeneity: causes and consequences. Biochim Biophys Acta Rev Cancer. 2010;1805(1):105–17. https ://doi. org/10.1016/j.bbcan .2009.11.002.
62. Andrews S. fastqc 2015. https ://www.bioin forma tics.babra ham.ac.uk/ proje cts/fastq c/.
63. Krueger F. Trim Galore! 2017. http://www.bioin forma tics.babra ham.ac.uk/ proje cts/trim_galor e/.
64. Li H, Handsaker B, Wysoker A, Fennell T, Ruan J, Homer N, et al. The Sequence Alignment/Map format and SAMtools. Bioinformatics. 2009;25(16):2078–9. https ://doi.org/10.1093/bioin forma tics/btp35 2. 65. Sherry ST, Ward M-H, Kholodov M, Baker J, Phan L, Smigielski EM, Sirotkin
K. dbSNP: the NCBI database of genetic variation. Nucl Acids Res. 2001;29(1):308–11. https ://doi.org/10.1093/nar/29.1.308.
66. Song Q, Decato B, Hong EE, Zhou M, Fang F, Qu J, et al. A reference methylome database and analysis pipeline to facilitate integrative and comparative epigenomics. PLoS ONE. 2013;8(12):1–9. https ://doi. org/10.1371/journ al.pone.00811 48.
67. Durinck S, Moreau Y, Kasprzyk A, Davis S, De Moor B, Brazma A, Huber W. BioMart and bioconductor: a powerful link between biological databases and microarray data analysis. Bioinformatics. 2005;21:3439–40. https ://doi. org/10.1093/bioin forma tics/bti52 5.
68. Durinck S, Spellman PT, Birney E, Huber W. Mapping identifiers for the integration of genomic datasets with the R/bioconductor package biomaRt. Nat Protocols. 2009;4:1184–91. https ://doi.org/10.1038/nprot .2009.97.
69. Court F, Tayama C, Romanelli V, Martin-Trujillo A, Iglesias-Platas I, Okamura K, et al. Genome-wide parent-of-origin DNA methylation analysis reveals the intricacies of human imprinting and suggests a germline methylation-independent mechanism of establishment. Genome Res. 2014;24(4):554–69. https ://doi.org/10.1101/gr.16491 3.113.
70. Pervjakova N, Kasela S, Morris AP, Kals M, Metspalu A, Lindgren CM, et al. Imprinted genes and imprinting control regions show predomi-nant intermediate methylation in adult somatic tissues. Epigenomics. 2016;8(6):789–99. https ://doi.org/10.2217/epi.16.8.
71. Smyth GK. Linear models and empirical Bayes methods for assessing dif-ferential expression in microarray experiments. Stat Appl Genet Mol Biol. 2004;3(1):1–25. https ://doi.org/10.2202/1544-6115.1027.
72. Soneson C, Robinson MD. iCOBRA: open, reproducible, standardized and live method benchmarking. Nat Methods. 2016;13:283. https ://doi. org/10.1038/nmeth .3805.
Publisher’s Note