Available Online at www.ijpret.com 192
INTERNATIONAL JOURNAL OF PURE AND
APPLIED RESEARCH IN ENGINEERING AND
TECHNOLOGY
A PATH FOR HORIZING YOUR INNOVATIVE WORK
FORECASTING STOCK MARKET USING SVM
MR. UMESH S. THAKARE, PROF. PRAFUL SAMBHARE Dept. Of Computer Science and Engg, P. R. Pote college of engineering, Amravati, India.Accepted Date: 05/03/2015; Published Date: 01/05/2015
\
Abstract: Prediction of stock market is a long-time attractive topic to researchers from
different fields. In particular, numerous studies have been conducted to predict the movement of stock market using machine learning algorithms such as support vector machine (SVM) and reinforcement learning. In this project, we propose a new prediction algorithm that exploits the temporal correlation among global stock markets and various financial products to predict the next-day stock trend with the aid of SVM. Recent studies introduce particular strategies that overcome these problems. Support Vector Machine (SVM) is a relatively new learning algorithm that has the desirable characteristics of the control of the decision function, the use of the kernel method, and the sparsity of the we implement an algorithm witch support to the SVM and predict the stock marketing value.
Keywords: Stock Classification; Data Mining; Support Vector Machine; Forecasting;
Multivariate Classification
Corresponding Author: MR. UMESH S. THAKARE
Access Online On:
www.ijpret.com
How to Cite This Article:
Umesh S. Thakare, IJPRET, 2015; Volume 3 (9): 192-201
Available Online at www.ijpret.com 193 INTRODUCTION
The macroeconomic environment and the financial market are complex, evolutionary, and non-linear dynamical systems. The field of financial forecasting is characterized by data intensity, noise, non-stationarity, unstructured nature, and hidden relationships. Predicting financial indicators is therefore a difficult task. However, forecasting is important in the sense that it provides concrete data
for investment decisions. How can we predict whether the price of a particular stock will go up or down in the upcoming year? In the modern techniques, one way is to develop a predictor basedon the information in the historical data. First of all, we should selected some major factors that may
influence the performance of the stocks, we can further discover an interesting model from our dataset to predict the future performance of any stocks. That is to say, we need to learn a model that can map those factors into the class attribute which indicates the whole performance of stocks. Support vector machine (SVM) is a machine learning technique that can be used for this purpose of classification.
Established on the unique theory of the structural risk minimization principle to estimate a function by minimizing an upper bound of the generalization error, SVM is shown to be very resistant to the over-fitting problem, eventually is to our belief that data of oversea stock and other financial markets, especially those having strong temporal correlation with the upcoming US trading day, should be useful to machine learning based predictor, and our speculation is verified by numerical results. achieving a high generalization performance. Another keproperty of SVM is that training SVM is equivalent to solving a linearly constrained quadratic programming problem so that the solution of SVM is always unique and lobally optimal, unlike neural networks training, which requires nonlinear optimization with the danger of getting stuck at local minima.
First of all, we should selected some major factors that may influence the performance of the stocks, that can be divided into two major group Company Specific and Mnemonics we can further discover an interesting model from our dataset to predict the future performance of any stocks. For increasing the profit we consider the following values :
Net Revenue
Available Online at www.ijpret.com 194 Net Income
Net Income is a company's total earnings (or profit), calculated by taking revenues and adjusting for the cost of doing business, depreciation, interest, taxes, and other expenses
Price per earnings ratio of stock
A valuation ratio of a company's current share price compared to its per-share earnings. Calculated as: Market Value per Share/Earnings per Share (EPS).
Diluted earnings per share
A performance metric used to gauge the quality of a company's earnings per share (EPS) if all convertible securities were exercised.
Consumer spending
It is also known as personal consumption expenditure. It is the largest part of aggregate
demand or effective demand at the macroeconomic level.
Consumer investment
In economics, investment represents capital expenditure by companies in an economic model, which is distinct from consumer expenditure, government expenditure, and net exports.
Unemployment rate
The percentage of the total labor force that is unemployed but actively seeking employment and
willing to work
Inflation rate
The percentage increase in the price of goods and services, usually annually
Federal funds rate
Available Online at www.ijpret.com 195
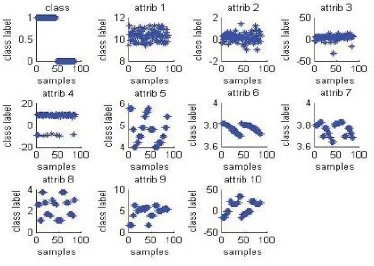
Figure1. Scatterplots of the dataset
Dow Jones industrial average
It is an index that shows how 30 large, publicly owned companies based in the United States have traded during a standard trading session in the stock market.
True Group Poor
True Group Good
Poor 37 2
Good 1 38
Total 38 40
N correct 37 38
Proportion 97.36% 95%
N=78 N CORRECT= 75
Proposition correct=96.15%
Table I. The results of the SVM model’s classification on training samples
Available Online at www.ijpret.com 196
theory of the structural risk minimization principle to estimate a function by minimizing an upper bound of the generalization error, SVM is shown to be very resistant to the over-fitting problem, eventually achieving a high generalization performance. Another key property of SVM is that training SVM is equivalent to solving a linearly constrained quadratic programming problem so that the solution of SVM is always unique and globally optimal, unlike neural networks training, which requires nonlinear optimization with the danger of getting stuck at local minima.
Obser vatio n
Stock Predicte
d Group
Actual Group
1 Comput
er Associat e 2002
Good Poor
2 Comput
er Associat e 2001
Poor Good
3 Ford 2002
Poor Poor
4 Ford 2001
Good Good
5 Intel 2002
Good Good
6 Kellogg 2002
Good Good
7 Ups2002 Good Good
Available Online at www.ijpret.com 197
2002
9 Microso ft 2002
Good Good
10 Tyson 2002
Good Poor
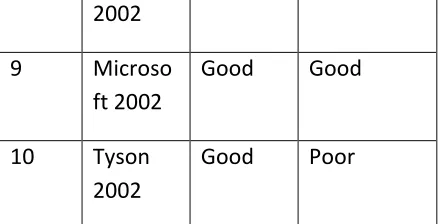
Table II. Classification of test samples by SVM classifier
The rest of this article is organized as follows. we will give brief theoretical overviews of SVM. In we focus on the application of SVM on the stocks market. introductionofthesevariables.Also,welabeleachstockin aspecificyear inourdataset asagoodorapoorinvestment. Althoughthere isnodefinitivemethodfordefininga market investment as“good” or “poor”, we use amethod that is simpleandobjective:ifthepriceofacompany’sstockover agivenyear rose,itisclassifiedasagoodinvestment,
otherwiseitisclassifiedasapoorinvestment.Ourtrainingsamplewasbasedonarandomselectionof15
companies,forallyearsfrom 1995-2002,wheredatawas
providedintheirannualreports.Thismadeasamplesizeof88 distinct company-year observations. Tocreate a test sample, we randomly selected totally10stocksoutofthe data set, andthe remaining 78 entries were used as the trainingsamples.
From theelementaryanalysisofthedatasetshownin Figure 1andFigure2, wecaneasilyseethe value distribution of each attribute. The value range of each attribute has their own pattern, so it seems that linear classificationisveryhardtobuildacorrectrelationfrom all the attributes to the class label in this case. However, the SVMisgood atnon-linearclassificationandcanbetriedto developastrongconnectionfrom theinputattributestothe classlabelbysupervisedlearning.
SVM Classification accuracy rate
Training Data Set
97.435% (76/78)
Available Online at www.ijpret.com 198
Data Set
TABLE III. ACCURACY RATES
II. LITERATURE REVIEW
1.Stock Market Value Prediction Using Neural Networks
The idea of neural networks was first inspired by human beings nervous system which consists of a number of simple processing units called neuron . Each neuron receives some signals from outside or from other neurons and then by processing them in activation function produces its output and sends it to other neurons. Each input impact is different from other inputs. For example in figure two the impact of the ith neuron on jth neuron is shown with wij, the weight of the connection between neuron i and j.
Figure2: Stock market prediction by using ANN
2.Stock Market Value Prediction Using Support Vector Machines
Recently, a new technique within the field of computational intelligence, that of Support Vector Machines (SVM), has been applied to financial markets. In the current literature, these have in some cases shown to be more effective than ANN’s (Kim, 2003; Thissen et al., 2003; Liu and Wang, 2008). This section starts with introducing the underlying theory behind the SVM, in which the bare basics are briefly introduced, necessary to effectively apply SVMs in financial forecasting. Subsequently, the application of SVMs in financial forecasting is investigated.
Available Online at www.ijpret.com 199
between them (we will see later a refinement to this definition) . It follows from the risk minimization principle (an assessment of the expected loss or error, i.e., the misclassification of samples) that the generalization error of the classifier is better if the margin is larger. The separating hyper plane that are the closest points for different classes at maximum distance from it is preferred, as the two groups of samples are separated from each other by a largest margin, and thus least sensitive to minor errors in the hyper plane‟s direction .
Figure 3: Iterative process Varying SVM Parameter
About the Work:
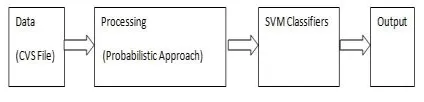
The above figure show that the actual implementation of the stock market prediction by using Support Vector Machine. Here we actually done the collection of data by using the CVS file common value also we collect the value from the web and send to the processing after that probabilistic approach it will send to the SVM Classifiers and after that we generated the out put of the predicted value.
Figure4:Proposed work for SVM Parameter
Future Research
Available Online at www.ijpret.com 200
Refining the SVM may lie in finding a better structure in terms of the kernel function, which might be a combination of various kernels. It might also lie in how the free parameters for the SVM are selected, perhaps by an alternative computational intelligence method. This would require further research on the topic that points to the direction of genetic algorithms in combination with SVM. By imitating the biological evolution process, genetic algorithms try to find optimal or new optimal solutions with relatively modest computational requirements.
Alternatively, future research may be conducted on combining different inputs from various data sources to an SVM prediction model. One could thereby think of inputs from various macroeconomic indicators that might have an effect on the exchange rate.
CONCLUSION: In the project, we proposed the use of data collected from different global
financial markets with machine learning algorithms to predict the stock index movements. Our findings can be summarized into three aspects:
1. Correlation analysis indicates strong interconnection between the Market stock index and global markets that close right before or at the very beginning of trading time.
2. Various machine learning based models are proposed for predicting daily trend of Market stocks. Numerical results suggests high accuracy
3. A practical trading model is built upon our well trained predictor. The model generates higher profit compared to selected benchmarks.
There are a number of further directions can be investigated starting from this project. The first one is to explore other creative and effective methods that might yield even better performance on stock market forecasting. Second, models can be modified to take care of the tax and fees in the trading process. Finally, we can investigate the mechanism of short sale and maximize our profit even when the market is bullish.
REFERENCES
1. Zhen Hu, Jie Zhu, and Ken Tse “Stocks Market Prediction Using Support Vector Machine”. 2013 6th International Conference on Information Management, Innovation Management and Industrial Engineering
Available Online at www.ijpret.com 201
3. C.J.C. Burges, “A Tutorial on Support Vector Machines for Pattern Recognition”, Data
4. Mining and Knowledge Discovery, Volume 2, pp. 1-43, Kluwer Academic Publishers, Boston, 1998.
5. C. Cortes and V. Vapnik, “Support Vector Networks”, Machine Learning, 20, 273-297, 1995.
6. M.Pontil and A. Verri, “Properties of Support Vector Machines”, Technical Report, Massachusetts Institute of Technology, 1997.
7. E.E. Osuna, R. Freund and F. Girosi, “Support Vector Machines: Training and Applications”, Technical Report, Massachusetts Institute of Technology, Artificial Intelligence Laboratory, AI Memo No. 1602, , 1997.
8. N. Ancona, Classification Properties of Support Vector Machines for Regression, Technical Report, RIIESI/CNR-Nr. 02/99.
9. Jianwen Xie, Jianhua Wu, Qingquan Qian: Feature Selection Algorithm Based on Association Rules Mining Method. ACIS-ICIS 2009: 357-362.
10.T. Joachims, Making Large-Scale SVM Learning Practical, Technical Report, L 8-24, Computer Science Department, University of Dortmund, 1998.