Abstract—BINUS Square is a dormitory for students of Bina Nusantara University, Jakarta which provides Internet facility with wireless media. Since 2010, there have been many complaints on network performance such as slow connections or frequent break up of connections. Although the configuration and network capacity has been regularly fixed and upgraded, the complaints keep on repeating. The current study is formulated by using multiple case methodologies such as data retrieval by using SNMP polling tools, Access Point (AP) Monitoring, Syslog, and field measurements. It is noted that the distance factor, the number of users and signal strength do not influence the speed with an average of 4,769 Kbps for download and 874 Kbps for upload. However the roaming activity occurring in WLAN is equal to 30% of 10,418 roaming events, which in turn lead to the slow speed of the connections.
Index Terms— wireless traffic, access point monitoring, syslog, network analyzer, SNMP polling
I. INTRODUCTION
INUS Square – Hall of Residence is a temporary residence for students of Bina Nusantara University which is occupied by 985 students. Since it was opened in 2010, the residence has been equipped with Internet access, a common facility offered by many education institutions [1-3] nowadays. Nevertheless, complaints of slow Internet access or break up of connections are greater than complaints for other facilities. This is because most students mainly access the Internet applications such as instant messaging, browsing and streaming for 24 hours. The characteristics of campus wireless network has been studied by Papadopouli [4] et. al., and Schwab and Bunt [5]. These provide the information about where, when, how much, and for what their wireless network is being used. Such information is important in evaluating design principles and planning for future network expansion.
Kortz and Essien [6] observed wireless network performance at Dartmouth College by implementing 3 different ways of Syslog recording: SNMP, polling and sniffer. In this implementation, a card switches access points (AP), identified by a ‘roams out to/ roams from’ message to a new AP. They also reported in their writing that they found
R. Wijaya and R. Hedwig are with the Computer Engineering Department, Bina Nusantara University, Jakarta, Indonesia (phone: +6221-534-5830 ext. 2144; e-mail: [email protected] and [email protected], respectively).
J.M. Kerta is with the IT Directorate of Bina Nusantara Foundation, Jakarta, Indonesia (phone: +6221-534-5830 ext. 2300; e-mail: [email protected]).
that the roaming activity was as high as 40%, which will be compared later to BINUS square one. According to Geier [7], roaming process, even as low as 68ms, could interfere with the application layer. This is due to the hold off implementation in the network interface card (NIC), which is a wireless network interface card identified by MAC address, where data re-transmission occurs during hold off period.
Using the same idea, this study was proposed to characterize residence’s wireless network so that the problem can be identified and solved.
The current study identified five ways to gather data: traffic monitoring through SNMP polling [8,9], syslog [10,11], network analyzer [12], AP monitoring [13] and field measurements. Pre-processing data based on Perl [14] was carried out before data gathering through syslog and AP monitoring. After data gathering, analysis was carried out by using descriptive statistics where a CDF graph was applied, and quantitative analysis approximation by means of double linear regression.
The proposed hypothesizes are as follow:
Hypotheses 1 (H0) The number of users (X1) does not influence the download speed (Y1) (H1) The number of users (X1) influences the download speed (Y1) Hypotheses 2 (H0) Signal strength (X2) does not
influence the download speed (Y1) (H1) Signal strength (X2) influences the download speed (Y1)
Hypotheses 3 (H0)The distance between user and AP (X3) does not influence the download speed (Y1)
(H1) The distance between user and AP (X3) influences the download speed (Y1)
This research also uses cumulative distribution function graph so we could obtain the 50 percent median and 95 percent certain value. The sampling was done by taking 30 user rooms for t-test and variant analysis. Independent and dependent variables are shown in Table I while double regression model that is used in this research is Y1=b0+b1X1+b2X2+b3X3.
TABLE I.
INDEPENDENT AND DEPENDENT VARIABLES
Independent Variables
Number of users (X1) Signal strength/RSSI (X2) Distance between user and AP (X3) Dependent Variables Download speed (Y1)
Influences of Wireless Traffic toward WiFi
Performance at BINUS Square - Jakarta
Rico Wijaya, Johan Muliadi Kerta, and Rinda Hedwig
II. RESULTS AND DISCUSSION
The network profile of BINUS Square can be seen on figure 1 where the Proxy server was used as the Internet data cache in order to reduce the bandwidth usage for extranet access. Figure 2 shows the wireless LAN network topology with 1 Mikrotik gateway, 1 Mikrotik hotspot (router), 22 manageable Ethernet switches, a wireless controller and 163 AP that can be used for the Internet access. In this case, BINUS Square uses Ruckus Wireless as the access point.
The international bandwidth available in BINUS Square is 25Mbps (night time). The usage of international download bandwidth monitored since Nov 25th, 2011 until December
24th, 2011 showed that the maximum bandwidth of 78.82
Mbps was not above its maximum point of 80Mbps. The observation was also made for network traffic when the international bandwidth was set and the aggregate bandwidth was as high as 384Kbps and 80Mbps, respectively. It was found that the utilization of the bandwidth was never full for a long time. However, only a traffic peak was observed.
Figure 3 shows the activity between AP in the same WLAN and AP in different WLAN. It can be seen that the high roaming activity can cause instability of connections since network needed to update the IP address very frequently. This roaming occurred even though the users did not move locations. This was caused by an overlapping signal area with the same WLAN Service Set Identifier (SSID).
Fig 1. Layer 3 network topology of BINUS Square.
Fig 2.Layer 2 network topology of BINUS Square per November 2010.
The graph of cumulative density function (CDF) of user number and Received Signal Strength Indicator (RSSI) can be seen in Figure 4. It shows that there was Internet activity on every floor, although some floors were not being occupied during the research period (16th to 18th floor). In this research,
the measurement result was taken by taking signal data via wireless monitor and speed test. The statistical test using SPSS can be seen below.
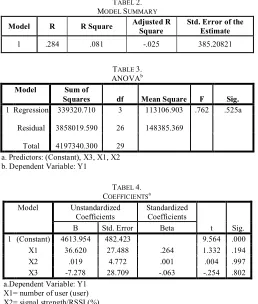
Download Speed Model (Y1)
TABEL 2.
MODEL SUMMARY
Model R R Square Adjusted R Square Std. Error of the Estimate
1 .284 .081 -.025 385.20821
TABLE 3.
ANOVAb
Model Sum of
Squares df Mean Square F Sig.
1 Regression 339320.710 3 113106.903 .762 .525a
Residual 3858019.590 26 148385.369
Total 4197340.300 29 a. Predictors: (Constant), X3, X1, X2 b. Dependent Variable: Y1
TABEL 4.
COEFFICIENTSa
Model Unstandardized
Coefficients Standardized Coefficients
t Sig. B Std. Error Beta
1 (Constant) 4613.954 482.423 9.564 .000
X1 36.620 27.488 .264 1.332 .194
X2 .019 4.772 .001 .004 .997
X3 -7.278 28.709 -.063 -.254 .802 a.Dependent Variable: Y1
X1= number of user (user) X2= signal strength/RSSI (%) X3= Distance between user and AP (m) Y1 = download speed (kbps)
Table 4 shows that the equation for double linear regression as is as follow:
Y1= 4613.954 + 36.620 * X1+ 0.019 * X2 -7.2278 *
X3………(1)
The partial hypotheses test on B1
1. H0 : B1 = 0 (X1 does not influence Y1)
Ha : B1 ≠ 0 (X1 influences Y1)
2. t0=1.332
3. From t table, α=0.05, df = 26, t0.025(26)= 2.056
4. Since t0=1.332 <t0.025(26)=2.056 then H0 is accepted,
which means X1 does not influence Y1
The partial hypotheses test on B2
1. H0 : B2 = 0 (X2 does not influence Y1)
Ha : B2 ≠ 0 (X2 influences Y1)
2. t0=0.004
3. From t table, α=0.05, df = 26, t0.025(26)= 2.056
4. Since t0=0.004<t0.025(26)=2.056 then H0 is accepted,
which means X2 does not influence Y1
1. H0 : B3 = 0 (X3 does not influence Y1)
Ha : B3 ≠ 0 (X3 influences Y1)
2. t0= -0.254
3. From t table, α=0.05, df = 26, t0.025(26)= 2.056
4. Since t0= -0.254<t0.025(26)=2.056 then H0 is accepted,
which means X3 does not influence Y1
Fig 3.Roaming activity that is measured.
From the partial test on B1, B2, and B3 it can be concluded
that the number of users, signal strength, and distance between users and the AP does not influence the download speed. It means that equation (1) cannot be applied to predict the download speed.
A network analyzer is used to find out the kinds of applications mostly used by users in the WiFi network. The data gathering is taken from Sangfor server. The data was collected for 13 days and it was found that there were 20,751,344 requests, as shown in Figure 5.
From all data analysis tested and observed we concluded that that there was excessive roaming activity and that when users were connected to the network, they depended solely on Network Interface Card (NIC) [15] firmware in choosing the AP. Moreover, roaming also occurred due to overlapped channels. Knowing these issues, some solutions were proposed for BINUS Square to consider. First, BINUS Square should ask all users to update their NIC driver software either in their computer or other communication devices connected to the network. Users who have customizable NICs should set their NIC aggressiveness rate to the lowest level. Using this arrangement it is hoped that the excessive roaming can be reduced.
Second, we advised that BINUS Square rearrange their AP transmitting power, AP placements, and SSID arrangement. It is due to high transmitting powers that many channel overlapping has occurred. In order to reduce the roaming activity, the transmitting power should be set to the position in which the signal can be received by each user who stays in the same floor to as high as >-75dBm. For the user who moves to different floors it is set to as low as <-75dBm. By this arrangement the AP roaming from one floor to another can be neglected since the transmitting power is simply too low.
Third, since the AP coverage is reduced due to the small AP coverage area (assuming the second suggestion is applied), subsequently the placement of each AP should be rearranged in order to avoid blind spots. The SSID should be set differently from one floor to another floor.
Fig 4.Graph of cumulative density function (CDF) of user number and RSSI.
Fig 5. Percentage of application requested by user (Network Analyzer)
Kotz and Essien [6] also presented almost the same research for Dartmouth College. However there are differences, such as in terms of time used for observation where observation was taken only at a certain time (from Nov 20th, 2011 until Dec 24th, 2011 and from 19:00 to 22:00) while
Kotz did it for a whole month. Both indicate that roaming is the main issue in this research. Unlike Dartmouth College, BINUS Square has a vertical area where most of the users stayed in their room and did not move from one room to another room. We also show that eventhough the users were not mobile, the activity of roaming remained heavy. An example of roaming from 14th floor to 15th floor within 1
second can be seen in Table 5.
TABEL 5.
ROAMING ACTIVITY 2011/12/12
19:00:27 Low AP[C1501] radio [11b/g] detects User[00:1e:64:0c:83:40] in WLAN[Boarder@Binus Square] roams from AP[C1401]
2011/12/12
19:00:27 Low AP[C1401] radio [11b/g] detects User[00:1e:64:0c:83:40] in WLAN[Boarder@Binus Square] roams out to AP[C1501]
Compared to Kotz [6], data collection of sessions did not included the ones which will be performed in the next experiment (for future report). This is due the limit of data collection which needed a longer period of time compared to the one in this paper. However, in the result it can be see that roaming was indicated by ‘AP join’ activity either in a subnet or extra-subnet. This was recorded every 3 hours. The roaming activity in the card quite varied from 1 time to 165 times while the AP was active 24 hours a day. The traffic of AP can be seen in Figure 6 where heavy traffic only happened in the floors that were occupied with more students.
Fig 6. Graph of cumulative density function (CDF) of number of users in each floor.
III. CONCLUSION
From this research we concluded that the excessive roaming activity is the main cause for the bad wireless connection in BINUS Square. Moreover, the roaming activity that comes from different WLANs can cause instability and frequently cut-off of the connection. The cause of low performance during download/upload is not yet certain since number of users, signal strength, and distance between user and the AP do not influence the speed performance. This is probably due to the bandwidth limitation that is applied for each user (5Mbps for download and 1Mbps for upload) as well as maximum number of users that can be connected to each AP (10 user per AP). However, there is no evidence in this
research, and further investigation is necessary in the future to confirm this prediction. Such an investigation is currently being conducted for a future report.
REFERENCES
[1] Lockwood J.W., “Implementation of Campus-Wide Wireless Network Services Using ATM, virtual LANs, and Wireless Basestation”, Proceeding of IEEE Wireless Communications and Networking
Conference (WCNC 1999), vol. 2, 1999, p. 603 – 605.
[2] Hills A.,” Wireless Andrew [mobile computing for university campus]”,
IEEE Spectrum, 36 6 [1999] p. 49 – 53.
[3] Zhiwen Yu,Yunji Liang,BukanXu,Yue Yang,and Bin Guo, “Towards a Smart Campus with Mobile Social Networking”, Proceeding of International Conference on Internet of Things (iThings/CPSCom) and
4th International Conference on Cyber, Physical and Social Computing,
2011, p. 162 – 169.
[4] Papadopouli M.,HaipengShen, Raftopoulos E., Ploumidis M., and Hernandez-Campus F., “Short-Term Forecasting in a Campus-Wide Wireless Network”, Proceeding of IEEE 16th International Symposium
on Personal, Indoor and Mobile Radio Communications (PIMRC 2005),
vol. 3, 2005, p. 1446 – 1452.
[5] Schwab D., and Bunt R., “Characterising the Use of a Campus Wireless Network”, Proceeding of 23rd Annual/Joint Conference of the IEEE
Computer and Communications Societies (INFOCOM 2004), vol. 2,
2004, p. 862 – 870.
[6] Kortz D., and Essien K., “Analysis of a Campus-Wide Wireless Network”, J. Wireless Network, vol. 11, 1-2 (2005), p. 115 – 133. [7] Geier J., “The IT Business Edge Network”, retrieved September 10th,
2011, from The IT Business Edge Network Website, http://www.smallbusinesscomputing.com
[8] Xiao Laisheng,PengXiaohong, Wang Zhengxia,Xu Bing, and Hong Pengzhi, “Research on Traffic Monitoring Network and Its Traffic Flow Forecast and Congestion Control Model Based on Wireless Sensor Networks”, Proceeding of International Conference on Measuring
Technology and Mechatronics Automation (ICMTMA’09), vol. 1, 2009,
p. 142 – 147.
[9] Kyo-Cheul Hwang, Jong-Joon Hong, and Kyoon-Ha Lee, “A SNMP Group Polling for the Management Traffic”, Proceeding of the IEEE
Region 10 Conference (TENCON 99), vol. 2, 1999, p. 797 – 800.
[10] Corey V., Peterman C., Shearin S., Greenberg M.S., and Van Bokkelen J., “Network Forensics Analysis”, IEEE Internet Computing, vol. 6, 6 (2002), p. 60 – 66.
[11] Stearley J., “Towards Informatic Analysis of Syslog”, Proceeding of IEEE International Conference on Cluster Computing, 2004, p. 309 – 318.
[12] Sanpietro F., Ferrero A., Pisani U., andBrunetti L., “Accuracy of a Multiport Network Analyzer”, IEEE Transactions on Instrumentation
and Measurement, vol. 44, 2 (1995), p. 304 – 307.
[13] Siris V.A., and Evaggelatou D., “Access Point Selection for Improving Throughput Fairness in Wireless LANs”, 10th IFIP/IEEE International
Symposium on Integrated Network Management (IM’07), 2007, p. 469 –
477.
[14] Cicekli I., and Nugues P.M., “An Introduction to Language Processing with Perl and Prolog”, Natural Language Engineering, vol. 16, 2 (2010), p. 193 – 195.
[15] Weinsberg Y., Pavlov E., Amir Y., Gat G., and Wulff S., “Putting It on the NIC: A Case Study on Application Offloading to a Network Interface Card (NIC)”, Proceeding of 3rd IEEE Consumer
Communications and Networking Conference (CCNC 2006) vol. 2,