Introduction
Job satisfaction of academic members is important for improvement, efficiency and effectiveness of the upper higher education sector. It is therefore important that those individuals who join the teaching profession should be dedicated and competent in their work. A teacher can perform to the maximum of his capacity; if he/she is satisfied with his/her job. Job satisfaction is pleasant and positive attitude possessed by a person towards his professional life. According to Reddy and Rajasekharan (1991), job satisfaction expresses the degree of congruence between one’s expectations and the reality that job provides. Job satisfaction is of great significance for efficient functioning of any organization and the persons involved. Every profession has certain aspects responsible for job satisfaction along with attitude and teaching is not an exception unless and until a teacher derives satisfaction on job performance and develops a positive attitude towards education, he cannot initiate desirable outcomes to cater to the needs of the society. Only satisfied and well-adjusted teacher can think of the well-being of the pupils. (Lal & Shergill,2012). Job satisfaction is one of the most widely discussed issues in organizational behavior, personnel and human resource management and organizational management. As teaching does require a great deal of thoroughness and commitment, so in teaching it is more important to have mental commitment and loyalty than physical presence. (Ali et.al.2009). The nature of educational and research environments requires the job satisfaction factor to be inspected from different aspects. Among the influential factors on job satisfaction, is the biographical characteristics of people. Studying the relation between job satisfaction and gender as the number of women is increasing in businesses is among the issues which have drawn the
attention of researchers.(Valentine, S.(2000) and Garcıa,et.al(2005). In some cases women had a higher job satisfaction ration than men, and in some others the reverse has been proved. In the light of this background, the study is designed to investigate the job satisfaction level of male and female college teachers of Udaipur city.
Objectives:
The study was conducted with the following objectives-
1. To determine the overall job satisfaction among college teachers.
2. To find out the differences in job satisfaction level of college teachers with special reference to gender.
Methodology:
Descriptive survey method of research was used in executing the present study. Descriptive method provides a method of investigation to study, describes and interprets what exists at present. Based on the objectives framed, the study was conducted in Udaipur city.
Sample size:
To collect the desired information about the jab satisfaction level among college teachers, 64 respondents were selected on the basis of stratified random sampling techniques from six educational institutions of higher education in Udaipur city. The samples were comprised of 32 males and 32 females fulfilling the laid criteria of selection.
Development of research tool:
Job satisfaction questionnaire was used as tool to accomplish the objectives of the present research work. The researcher herself designed the tool in consultation with the subject matter specialists and after extensive review of available literatures. The Received on: 27/06/2015
Accepted on: 30/07/2015 Published on: 20/08/2015
Corresponding Author Meenu Srivastava
Professor and Head, Department of Textiles and Apparel Designing, College of Home Science, MPUAT, Udaipur, Rajasthan, India
E-mail :[email protected]
QR Code for Mobile users
Job Satisfaction among Teaching Faculty with Reference
to Gender
Meenu Srivastava1 and Dolly Mogra2
1 Professor and Head, Department of Textiles and Apparel Designing, College of Home
Science, MPUAT, Udaipur, Rajasthan, India
2Guest faculty, Department of Textiles and Apparel Designing, College of Home Science,
MPUAT, Udaipur, Rajasthan, India ABSTRACT
instrument is composed of 24 items related to following four variables;
Peer relationship factor
Work environment factor
Administrative factor
Economic factor Pretesting:
The primary draft of the questionnaire was tested for feasibility and effectiveness with a group of 10% non-sample subjects. Modification in the schedule was made on the basis of pretesting and after final correction and modifications the schedule was used for data collection.
Data collection
In order to collect data from selected respondents of three private and three public colleges of Udaipur city, the researcher carefully administered developed tool of data collection and personal data sheet to get information about various independent and dependent and demographical variables Gender i.e. male & female, background of the teachers i.e. age, experience, cadre, qualification and stream, etc The respondents were contacted at their work places during February -March, 2015.
Analysis of data
The study uses descriptive statistics to report overall pattern of data and underlined response and behavioural pattern of sample in a specified situation. The overall satisfaction score are developed into three categories based on mean score and classified as high level, moderate and low level of satisfaction. The frequency distribution is tabulated to depict the overall participation of respondents. In order to find out the significance of difference between the selected variables and job satisfaction of college teachers, ‘t’ test technique was employed.
i) Frequency and percentage: Frequency and percentage were used to analyze the data on the basis of their general background information, and satisfaction level,etc. The rating obtained were tabulated according to the scores obtained and converted in percentage.
ii) Weighted Mean Scores (WMS) :Scores obtained by each of the selected four factors of job satisfaction by the respondents were converted into WMS to get weighted mean score of various factors of job satisfaction. Weighted Mean Score were calculated by the formula;
Sum of raw scores obtained by respondents WMS = 100 Maximum obtainable scores
iii)Mean
Mean= x/N Where,
x = Sum of scores
N = Total number of items iv) Standard Deviation
S.D. = x2/N = (X-M)2/N Where,
X = Individual Score
M = Mean of the given set of scores N = Total number of scores
x = Deviation of each score from mean v) ‘t’ test
S.E. D= 2 /N1 2 /N2 Where,
SE = Standard error
1 = Standard deviation of the first sample
2 = Standard deviation of the second sample N1 = Size of first sample
N2 = Size of second sample
Results: The major findings of the study have been summarized as follows:
Background information of the respondents
The study includes equal number of both male and female respondents. The general background characteristics of the respondents have been analysed in terms of age, educational qualification, years of experience, cadre, designation, discipline, nature of job and type of institution of the respondents. All the respondents belonged to the various higher educational public and private institutes of Udaipur city.
Age: The researcher selected 32 respondents each from both gender. The age wise distribution of these respondents has been presented in fig.
1&2.:-Fig-1&2 showing age wise distribution of male and female respondents
Data in fig.1-2, shows that the maximum percentages (39%) of the respondents were found in the age group of 31- (21.87%). Equal percentages of the respondents were found in both the age groups 20-30 and 41-50 years in the female respondents’ category whereas in male category 31.25 respondents belonged to 41-50 years age group followed by 25 per cent in 20-30 years. About 10.94 per cent respondents were in the age range of 41-45 years of age group respectively. Type of institution:
Table 1: Frequency and percentage distribution of respondents according to type of institution
n=64
Variables Respondents Total
Public Private
f % f % f %
Male 16 25 16 25 32 50
Female 16 25 16 25 32 50
Table 1 shows the distribution of respondents according to type of institution in which they were employed. It is apparent from the table that half of the respondents i.e. 50 per cent were males while 50 per cent were females.
Education:
Education is one of the most important determinants of a person’s social status. It refers to the number of years of formal schooling completed by the respondents at the time of investigation. On the basis of their educational level, the respondents were categorized as
follows:-Fig-3 showing educational qualification of respondents The data pertaining to education shows that most of the respondents (62.50%) were well educated and hold PhD degree. It was found that a very few respondents (4.69 %) had education up post-graduation. The above table also depicts that the rate of NET qualified respondents were found higher in female respondent’s category (34.38 %) in comparison to their male counterparts (28.13%).
Nature of appointment:
Frequency and percentage distribution of respondents according to nature of appointment has been given below:-
Table 2: Frequency and percentage distribution of respondents according to nature of appointment
n=64
Variables Respondents Total
Male Female
f % f % f %
Permanent 16 25 16 25 32 50
Contractual 16 25 16 25 32 50
The findings of the table 2 show that an equal number of both male and female respondents (50%) were selected based on their job permanency to elicit the required information.
Streams :
It indicates the teaching area/subject of the respondents. The researcher again selected an equal number of male and female respondents from both
arts and science faculty. Table 3 depicts distribution of respondent by their stream.
Table 3: Frequency and percentage distribution of respondents according to their steam
N=64
Variables Respondents Total
Male Female
f % F % f %
Arts 16 25 16 25 32 50
Science 16 25 16 25 32 50
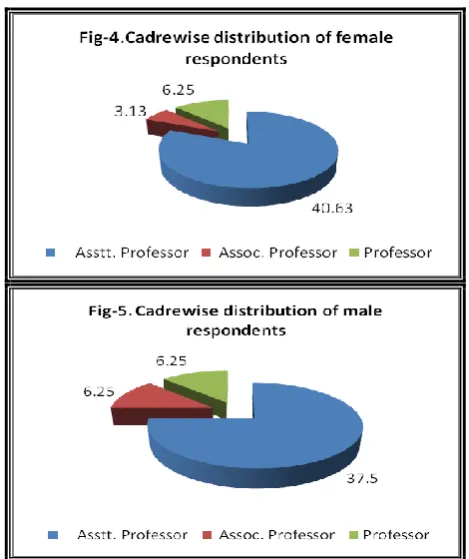
Data presented in Table 3 is self explanatory. It clearly shows that 50 per cent of the respondents each belonged to arts and science streams respectively. Cadre of job:
The data presented in the fig.4 & 5 indicates that half of the sample was of guest faculty hired on contractual basis in the beginning of the academic session. Remaining half of the sample was of permanent nature and among them ,majority (39.06%) of the respondents were found in the cadre of Assistant Professor.
Fig-4 & 5 showing distribution of respondents by cadre of job
Only 4.69 per cent of the respondents belonged to the cadre of Associate Professor. From the table, it is clear that all thequal number of male and female respondents were there in the Professor cadre.
Teaching experience:
Fig-6. Showing distribution of respondents by years of experience.
Job satisfaction factors:
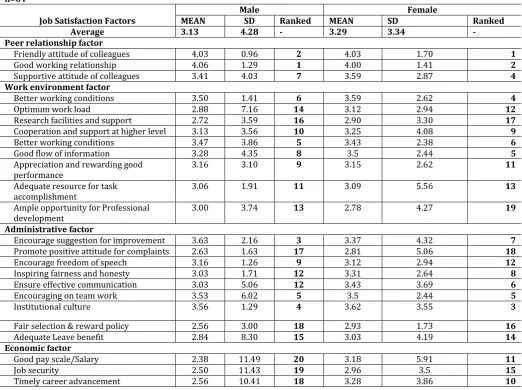
Table-4 portrays Mean, standard deviation and relative ranking of various items studied under selected four variables of job satisfaction .i.e. Peer relationship,
working environment, administrative and economic factors between male and female faculty members.
Table-4. Mean, SD and comparative ranking of Job Satisfaction factors between male and female faculty n=64
Job Satisfaction Factors
Male Female
MEAN SD Ranked MEAN SD Ranked
Average 3.13 4.28 - 3.29 3.34 -
Peer relationship factor
Friendly attitude of colleagues 4.03 0.96 2 4.03 1.70 1
Good working relationship 4.06 1.29 1 4.00 1.41 2
Supportive attitude of colleagues 3.41 4.03 7 3.59 2.87 4
Work environment factor
Better working conditions 3.50 1.41 6 3.59 2.62 4
Optimum work load 2.88 7.16 14 3.12 2.94 12
Research facilities and support 2.72 3.59 16 2.90 3.30 17
Cooperation and support at higher level 3.13 3.56 10 3.25 4.08 9
Better working conditions 3.47 3.86 5 3.43 2.38 6
Good flow of information 3.28 4.35 8 3.5 2.44 5
Appreciation and rewarding good performance
3.16 3.10 9 3.15 2.62 11
Adequate resource for task accomplishment
3.06 1.91 11 3.09 5.56 13
Ample opportunity for Professional development
3.00 3.74 13 2.78 4.27 19
Administrative factor
Encourage suggestion for improvement 3.63 2.16 3 3.37 4.32 7
Promote positive attitude for complaints 2.63 1.63 17 2.81 5.06 18
Encourage freedom of speech 3.16 1.26 9 3.12 2.94 12
Inspiring fairness and honesty 3.03 1.71 12 3.31 2.64 8
Ensure effective communication 3.03 5.06 12 3.43 3.69 6
Encouraging on team work 3.53 6.02 5 3.5 2.44 5
Institutional culture 3.56 1.29 4 3.62 3.55 3
Fair selection & reward policy 2.56 3.00 18 2.93 1.73 16
Adequate Leave benefit 2.84 8.30 15 3.03 4.19 14
Economic factor
Good pay scale/Salary 2.38 11.49 20 3.18 5.91 11
Job security 2.50 11.43 19 2.96 3.5 15
Timely career advancement 2.56 10.41 18 3.28 3.86 10
The level of job satisfaction among male faculty members (M=3.13, SD=4.28) and female faculty members (M=3.29, SD=3.34) were reported in the analysis. The data clearly shows that female respondents were found more satisfied than their counterparts.
whereas it was reversed among male respondents, who ranked working environment factor above administrative factor. The first two ranks were captured by Friendly attitude of colleagues and Good working relationship irrespective of gender. Institutional culture, Encouraging on team work, Better working conditions, Better working conditions, Supportive attitude of colleagues, Good flow of information, Encourage suggestion for improvement, etc. were other higher ranked factors by both the faculty. Economic factors was least ranked by male faculty as shown by their respective ranks (18, 19 and 20).
Weighted scores of Job satisfaction factors:
The weighted scores are developed to analyze the comparative position of different variables leading to the level of satisfaction between male and female respondents. Fig-7 & 8 depicts the weighted scores of different job satisfaction factors .i.e. peer relationship, working environment, administrative and economic factors.
The statistics show that peer relationship factors contribute the most in increasing the level of satisfaction. An equal weight age is assigned to both administrative and working environment factors among male respondents and were rated as second most important factor in creating job satisfaction, whereas in case of female respondents administrative factor was assigned more weight age as compared to work environment factor followed by economic factor which is rated as least important factor with respect to level of satisfaction by both the respondent’s group. Hajiha et.al. 2009 also reported that the most influential factors on women's job satisfaction are promotion opportunities and relations with their coworkers. As for men, work itself, relations with co-workers, supervision, and salary affect their job satisfaction respectively
Table-5. Significance of the difference (t-value) between male and female faculty with respect to job satisfaction
Gender N Mean S.D. t-value Significance at
0.05 level
Male 32 75.09 14.69 3.206 significant Female 32 79.06 10.63
It is clear from the table-5 that the calculated t’’-value is 3.206, which is significant at 0.05 level. Hence, it is inferred that there exists significant between the male and female faculty with respect to their job satisfaction. In this, the female respondents have better job satisfaction as compared to the male counterparts.
Conclusion
Thus, it can be concluded that teaching faculty of higher educational institutes possessed average level of job satisfaction. Peer relationship factor contribute the most in increasing the level of satisfaction followed by work environment and administrative factors. From the analysis we can infer that efforts be done to encourage and maintain good interpersonal relationship among peers and superiors at work place. Work environment should be healthy and should provide openness to its employee for better satisfaction. The results of this research showed that there is significant difference in job satisfaction between male and female faculty members.
References:
1. Ali Hajiha, Farhad Ghaffari & Asal Bahrami .2009. A Study of Component Gender in Job Satisfaction of University Lecturers. Business Research :167.
2. Duong, Minh-quang .2014. “The relationship between demographic characteristics and faculty job satisfaction in vietnamese higher education”.European journal of research and reflection in educational sciences, 2 :(3) : 16. www.idpublications.org.
3. Garcıa, B.J., Gargallo, C.A., Marzo, N.M. and Rivera, T.P. (2005), “Job satisfaction: empirical evidence of gender differences”, Women in Management Review, Vol. 20 No. 4, p. 280.
4. Lal,R. & Shergill, S.S .2012. A comparative study of job satisfaction and attitude towards education among male and female teachers of degree colleges. International journal of marketing, financial services & management research.1(1):57-65.
5. Reddy, K.S. Rajasekharan,T. 1991. Job satisfaction, job involvement and work involvement of permanent and temporary employees. Indian journal of applied psychology.28(1):5-10.
6. S.Sabarinathan & N.Nandha Kumar . “A Study On Job Satisfaction Among The College Faculty In Erode”.IOSR Journal of Business and Management (IOSR-JBM) e-ISSN : 2278-487X, p-ISSN : 2319-7668, PP 16-18 www.iosrjournals.org
7. Valentine, S. (2000), “Supervisor gender, leadership style, and perceived job
design”, Women in Management Review, Vol. 15 No. 3, p. 117.
Cite this article as: