Available Online at www.ijpret.com 671
INTERNATIONAL JOURNAL OF PURE AND
APPLIED RESEARCH IN ENGINEERING
AND TECHNOLOGY
A PATH FOR HORIZING YOUR INNOVATIVE WORK
FEATURE EXTRACTION AND CLASSIFICATION OF ECG
PHADTE SNEHA KISAN, AMITA DESAI
Dept. Electronics Communication & Instrumentation, Farmagudi, Goa.
Accepted Date: 15/03/2016; Published Date: 01/05/2016
\
Abstract- ECG signal plays an important role in diagnosing most of the Heart diseases. Cardiac cycle in an ECG signal consists of the P-QRS-T waves. Analysis of the extracted features shows that they differ considerably between normal heart rhythm and Cardiac arrhythmia. This paper proposes ECG signal classification using an Artificial Neural Network classifier, based on feature extraction of the ECG signal. Features based on the ECG waveform shape and heart beat intervals are used as inputs to the classifiers.
Keywords: ECG analysis, ECG Morphology, Feature Extraction, Artificial Neural Network, Arrhythmia.
Corresponding Author: MS. PHADTE SNEHA KISAN
Access Online On:
www.ijpret.com
How to Cite This Article:
Available Online at www.ijpret.com 672
INTRODUCTION
A lot of work has been made in the past for assessing the Cardiac vascular diseases
(CVD) [1].In the past few years cardiovascular disease has occurred as one of the deadliest disease causing death all round the world. The key reason of cardiovascular disease is irregularities of heart rate [2]. Electrocardiogram (ECG) is a diagnosis tool that reports the electrical activity of heart. The Electrocardiogram (ECG) is the record of variation of the bio potential signal of the human heartbeats. ECG is a continuous wave plotted time over the x-axis and mV on the y-axis. Electrodes are placed on the user’s skin. It is a noninvasive diagnostic tool, meaning that ECG signal can be measured on the surface of human body [3] [4]. It is an important tool in diagnosing the state of the heart diseases. ECG is a record of direction and magnitude of the electrical signal generated by the heart’s atria and ventricles [5]. This is caused by the repetitive polarization and depolarization taking place to acquire the sufficient flow of blood throughout the body. Any disorder of heart rate or rhythm, or change in the morphological pattern, is an indication of an arrhythmia. Manual observation for analyzing the recorded ECG waveform takes lengthier time for the decision making. Hence Artificial Intelligence based detection & classification system is used [6].
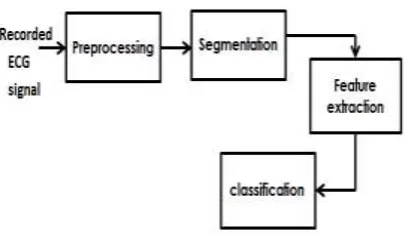
III. PROPOSED METHOD
Proposed system consists of four steps:
1) Pre-processing of the ECG signals for noise reduction
2) Segmentation of ECG
3) Feature Extraction of ECG
4) Classification of ECG.
Available Online at www.ijpret.com 673
IV. PRE-PROCESSING OF ECG SIGNAL
1) MIT BIH Arrhythmia Database:
The records used in this paper are generated from the ECG signals provided by the Physionet MIT-BIH database [7]. There are total 48 records. The database comprises 23 records (numbered from 100 to 124 inclusive with some numbers missing) chosen at random from this set, and 25 records (numbered from 200 to 234 inclusive, with some numbers missing) carefully chosen from the same set to include a variety of clinically important phenomena that would not be well characterized by a small random sample of Holter recordings. These signals are filtered using BPF at 0.1 Hz - 100Hz. Sampling of these signals is performed at 360 Hz.
2) Signal Averaging:
In MIT BIH Arrhythmia Database records, the first signal is a modified limb lead II (MLII), found by placing the electrodes on the chest. The second signal is generally a modified lead V2;found by placing the electrodes on the chest. Therefore averaging of the two signals is needed.
3) Powerline noise filtering:
Electromagnetic fields from power lines introduce the noise components that appear at power-line frequency (60 Hz) and their higher harmonics. Power line interference was removed by using a notch filter centered at 60Hz. Such noise can cause problems in understanding low amplitude waveforms.
4) Baseline drift filtering:
Baseline drift occurs due to body respiration. It causes the ECG waveform off the baseline
and it wanders in levels rather than maintaining the nominal amplitudes [8]. Baseline drift is removed by subtracting the mean of the signal from signal itself.
5) Low pass and High pass filter:
Transfer functions are used to design the low pass and high pass filters. Low pass and high pass are applied to attenuate the low frequency and high frequency noises.
V. SEGMENTATION
Available Online at www.ijpret.com 674
1) Differentiation:
The filtered ECG signal is differentiated to achieve the slope information. It is used for finding the high slopes that typically differentiate the QRS complexes from other ECG waves. It suppresses the low frequency components of P and T waves. It provides a large gain to the high-frequency components arising from the high slopes of the QRS Complex. The derivative with transfer function is given as
y(nT)
2) Squaring:
The squaring operation makes the result positive and highlights large differences resulting from QRS complexes. The high frequency components in the signal related to the QRS complex are enhanced. The small differences arising from P and T waves are suppressed. The squaring function is given by
y (nT) =[x(nT)]2
3) Moving Window Integration and Thresholding:
The slope of the R wave is not the absolute method to detect QRS complexes in an ECG. There may be several long duration and large amplitude QRS waves in the ECG which is abnormal hence a moving window integrator is used so that these waves can be identified as well. The difference equation for this moving window integrator is
y(nT)= (1/M) [(x(nT) – (M-1)T) + (x(nT) – (M-2)T) +…+x(nT)] .
Thresholding is done to detect the R peaks.
V. FEATURE EXTRACTION
Available Online at www.ijpret.com 675 extracted namely the amplitude of Q wave, amplitude of S wave, amplitude of R wave and QRS complex from this procedure.
The fifth feature is the RR interval. It is the distance between two succeeding R peaks .It is found by computing the mean of the detected R peaks.
VI. ARTIFICIAL NEURAL NETWORK
ANNs consist of processing elements (neurons), which are connected to each other .The strengths of the connections are called weights. It contains of a layer of input neurons, a layer of output neurons and one or more hidden layers in it. The number of output neuron is two, and the number of hidden unit neuron is chosen as 44.The most common method to find the optimal number of hidden layers is by trial and error. There is no prior knowledge of hidden layers. The training becomes excessively time-consuming when the number of hidden layers increases. The backpropagation algorithm is a nonlinear technique because of the nonlinear threshold element contained in each node. Its behavior is very complex because of the layered structure. The training function used is traingd, it updates weight and bias values according to gradient descent. If training is inadequate, the network will not learn the examples offered to it. Extremely excessive training of the network will force it to memorize the training examples. The Artificial neural network classifies the ECG based on the five features into two different classes namely normal heart rhythm and cardiac Arrhythmia.
V. RESULTS
Available Online at www.ijpret.com 676
Figure.3. Pre-processed ECG signal in frequency domain
Available Online at www.ijpret.com 677
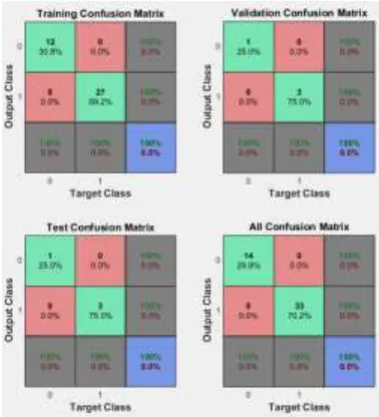
Figure .5.Confusion plot of Artificial Neural Network
Figure.6. Performance plot of Artificial Neural Network
CONCLUSION
Available Online at www.ijpret.com 678
REFERENCES
1. S.Karpagachelvi, Dr.M.Arthanari, M.Sivakumar,” ECG Feature Extraction Techniques”,
International Journal of Computer Science and Information Security, Vol. 8, No. 1, April
2010.
2. Rameshwari S Mane, A N Cheeran, Vaibhav D Awandekar and Priya Rani,”Cardiac Arrhythmia Detection By ECG Feature Extraction”, International Journal of Engineering
Research and Applications: 2248-9622, Vol. 3, Issue 2, March -April 2013.
3. B. Anuradha, V. C. Veera Reddy,”ANN for Classification of Cardiac Arrhythmias”, ARPN Journal of Engineering and Applied Sciences , ISSN 1819-6608, Vol. 3, NO. 3, June 2008. 4. Anand Kumar Joshi, Arun Tomar, Mangesh Tomar,” A Review Paper on Analysis of Electrocardiograph (ECG) Signal for the Detection of Arrhythmia Abnormalities”,
International Journal of Advanced Research in Electrical, Electronics and Instrumentation Engineering, ISSN (Online): 2278 – 8875, Vol. 3, Issue 10, October 2014.
5. A. D. Dongare, R.R.Kharde, Amit D.Kachare,” Introduction to Artificial Neural Network”,
International Journal of Engineering and Innovative Technology:2277-3754, Volume 2, Issue
1, July 2012.
6. V. X. Afonso, W.J. Tompkins, T.Q. Nguyen, and S. Luo, “ECG beat detection using filter banks”, IEEE Trans. Biomed. Eng., vol. 46, pp.192–202, 1999.
7. MIT-BIH Arrhythmia Database (Cited in 8 Octomber 2015):
http://physionet.org/physiobank/database/mitdb/
8. Rajesh D. Wagh, Kiran R. Khandarkar, Dipanjali D. Shipne, Shaila P. Kharde,” Noise Removal from Electrocardiogram (ECG) a Comparison Approaches”, International Journal of
Advanced Research in Computer Engineering & Technology (IJARCET) Volume 3 Issue 1,