-192-PREDICTORS OF DEPRESSED LEFT VENTRICULAR FUNCTION IN PATIENTS
PRESENTING WITH ST-ELEVATION MYOCARDIAL INFARCTION
Tarek Ahmed Naguib, Eslam Abdel Moneim Elsherbeiny, Ahmad Mohamed AbdelFattah Elzayyat and Ayman Elsayed Mohamed Tantawy*
Cardiology Department, Faculty of Medicine, Zagazig University
ABSTRACT
Background: Left ventricular dysfunction after ST segment elevation myocardial infarction (STEMI) is the most important factor affecting morbidity and mortality. The primary objective of reperfusion therapy is to restore epicardial flow and to reperfuse the myocardial tissue. However, in some cases lack of microvascular reperfusion and, consequently, significant left ventricular (LV) dysfunction persist despite the rapid and sustained restoration of blood flow. Early in the course of STEMI, therapies that may harm patients who develop LV dysfunction, such as beta-blockers, are often administered.
Aim of the work: construct a predictive score of the risk of developing left ventricular dysfunction in patients with STEMI.
Patient and methods: This study was done in Cardiology department, Zagazig University on 100 patients; 78 males (78%) & 22 females (22%) with first acute STEMI underwent successful primary percutaneous intervention (pPCI). Within 72 hours of admission, all of the following parameters were reported: risk factors, blood pressure, heart rate, KILLIP class, need for mechanical ventilation (MV), cardiac enzymes, admission blood sugar, kidney function, lipid profile, electrocardiographic data (ST elevation in millimeters (mm), location of infarction, ST resolution, QRS width in milliseconds (ms), Selvester score), echocardiography (ejection fraction by Simpson's method, wall motion score index) and angiographic data (culprit artery, Total number of diseased vessels, severity of coronary artery disease, Gensini score and door to balloon time).
Results: LV dysfunction was associated with decreased renal function (creatinine >1.1 mg/dl, p= 0.029), number of diseased vessels >2 (p=0.034), absence of complete ST segment resolution (p< 0.001), wall motion score index > 2.05 (p=0.008), sum of ST segment elevation >13.5 mm (p<0.001), QRS width >98.5 ms (p<0.001), Selvester score >3.5 (p<0.001) Gensini score >95 (p<0.001), anterior location of infarction (p =0.002) and KILLIP class >1 (p=0.003). A prediction score using these variables stratified patients into low, intermediate and high-risk groups for LV dysfunction; positive likelihood ratios for LV dysfunction in these groups were 2.9, 2.1, and 2.4, respectively.
Conclusions: 10 key predictors of in-hospital LV dysfunction after STEMI were identified; a risk score based on these predictors helps to quickly identify patients presenting with STEMI who are at the highest risk for developing significant LV dysfunction and could guide optimal therapeutic choices.
Key words: ST-elevation myocardial infarction, left ventricular dysfunction, predictors, score, primary angioplasty.
INTRODUCTION
lthough the incidence of ST-segment elevation myocardial infarction (STEMI) has decreased over the past decade, it remains a common and morbid diagnosis [1].
It is a life threatening situation, rapid and correct decision making for life saving of patients in emergency room is very important [2].
Primary treatment for patients with acute STEMI is fibrinolysis or primary angioplasty. The use of primary PCI has improved the outcome of STEMI patients significantly [3].
Ischemic heart disease is the most common contributor to left ventricular dysfunction. The extent of left ventricular (LV) function varies considerably among patients with extensive coronary disease, and clinical and angiographic factors associated with LV impairment are poorly characterized. Specifically, whether clinical, demographic and angiographic characteristics differ among patients and are predictive of LV ejection fraction has not been determined [4].
Despite aggressive primary therapy, prognosis remains poor in patients with large
infarctions and severe left ventricular (LV) dysfunction [5].
Early in the course of ST-segment elevation myocardial infarction (STEMI), therapies that may harm patients who develop left ventricular (LV) dysfunction are often administered. Early identification, preferably in the emergency department (ED), of patients at highest risk for developing left ventricular (LV) dysfunction could serve to inform the use of certain therapies
[6].
AIM OF THE WORK
The present study aimed to construct a predictive score of the risk of developing left ventricular dysfunction in patients with ST segment elevation myocardial infarction.
PATIENTS AND METHODS
-193-participation of the study. Medical research and ethics committee approved the study.
Inclusion Criteria:
Patients with first acute STEMI. STEMI was diagnosed by elevation of cardiac biomarkers associated with symptoms of ischemia and a new ST elevation, presumed new onset left bundle branch block (LBBB) or pathological Q waves.
ST-segment elevation was defined as J-point elevation in 2 contiguous leads of 2 mm in leads V1, V2, or V3 and 1 mm in other leads. ST-segment depression 1 mm in leads V1 to V3, consistent with a posterior STEMI was also considered ST-segment elevation [6].
Those with previous history of coronary artery disease other than previous myocardial infarction were also included in the study group.
Exclusion criteria:
Patients with previous Myocardial infarction, Previous diagnosis of heart failure, Pre-existing significant valvular heart disease, Patients with old left bundle branch block (LBBB), Those who did not do echocardiography during the index STEMI (within 72 hours of admission) or those whom it was difficult to delineate the endocardial border by Simpson's method, Patients with instent restenosis, Patients with previous CABG.
Grouping the patients: Patients were divided according to the ejection fraction (EF) by echocardiography in to 2 groups: Group (I): 36 patients with EF ≤ 40%, Group (II): 64 patients with EF > 40%
All patients were subjected to all of the following:
A) Complete history taking: with special emphasis on age, sex, risk factors including hypertension, diabetes mellitus, smoking, dyslipidemia and history of coronary artery disease (any mention of previous or simply listing coronary artery disease in the medical history was qualified as a history of coronary artery disease.
B) Thorough physical examination including:
Pulse and blood pressure (systolic and diastolic), neck veins, edema of lower limbs, abdominal and chest examination, cardiac examination including inspection, palpation and auscultation, Patients who had undergone mechanical ventilation were reported, Patients who had developed heart failure were classified regarding KILLIP class as: class I: no clinical signs of heart failure, class II: rales or crackles in
the lungs, an S3, and elevated jugular venous pressure, class III: frank acute pulmonary edema and class IV: cardiogenic shock.
C) Resting 12-lead standard surface electrocardiogram:
ECG was done on admission at emergency room triage at a paper speed of 25 mm/second and amplification of 10 mm/mv. STEMI was diagnosed according to the following: New ST segment elevation at J-point in ≥ 2 contiguous leads of ≥ 2 mm in leadsV1, V2, or V3 and ≥ 1 mm in other leads. ST-segment depression ≥ 1mm in leads V1 to V3, consistent with a posterior STEMI, was considered as ST-segment elevation[6]. ST segment elevation, measured 20 ms after the J point. The height (in mm) of ST segment elevations was measured in leads I, aVL, and V1 through V6 for anterior infarction; leads II, III, aVF for inferior infarction and leads V5 to V6 for lateral. The sum of all measured ST segment elevations was expressed as STE. Resting ECG was repeated for all patients 90–120 minutes following first balloon inflation, from which the sum of ST segment elevations was measured again. The difference between both was then taken and divided by the initial one. The result then accepted as ST segment elevation resolution (STR) and expressed as a percentage.
STE) ( Initial ECG second on the STE) ( -STE) ( Initial = STR
Patients were divided into three groups according to the degree of ST-segment resolution: < 30% (no resolution); 30% to 70% (partial resolution); and > 70% (complete resolution) [7].
QRS width was measured manually using calipers. The lead recording the widest QRS was used for the analysis. Development of atrial fibrillation or ventricular fibrillations during course of admission was reported for every patient.
-194-Table 1: Modified Selvester QRS score [8].
D) Laboratory investigations:
Blood samples for total CK, CK-MB were collected, peak values were taken for each of them in 1st 24 hours. Troponin T (cTn) was considered positive if it exceeds the 99th percentile of normal reference (above 0.035ng/mL), Random blood sugar on admission, Kidney functions with special emphasis on creatinine level, Lipid profile measured after 12 hours of fasting including cholesterol, triglyecerides (TG), high density
lipoprotein(HDL) and low density
lipoprotein(LDL).
E) Echocardiography
All patients underwent two dimensional (2D) echocardiography during index hospitalization in first 72 hours using (Hewlette Packard) Sonos 5500 set. Recordings and calculations of different parameters were performed according to the recommendations of the American Society of Echocardiography [9]. Examinations were done with the patient in left lateral position; utilizing
left parasternal long axis, short axis, apical 4, apical 5 and apical 2 chamber views. The main outcome was calculation of ejection fraction (EF) using 2D measurements of volumes, the biplane Simpson's method. Both left ventricle end diastolic (LVED) and end systolic (LVES) volumes in apical four chamber (A4C) and apical two chamber (A2C) views were measured. End-systole was defined as the frame with the smallest cavity area and end diastole as the frame with the largest LV cavity area (Figure 1) The EF was then calculated using the following formula for each view:
EF (%) = [(EDV - ESV) / EDV] x 100 [9]
The mean of the two readings (the biplane) ejection fraction was then taken. The cutoff point of 40% was chosen before the analysis; 40% represents a clinically meaningful delineation between mild LV dysfunction (or normal LV function) and moderate to severe LV dysfunction
-195-Figure 1: Method of calculation of biplane Simpson method [9].
Visual semi quantitative assessment of regional wall motion and thickening for WMSI was performed. We used the 16-segment model recommended by the ASE [10].At the basal and mid-ventricular levels, the left ventricle was divided into six segments and at the apical level it was divided into four segments. The score for each segment was graded according
to the following system: normal, 1; hypokinesia, 2; akinesia, 3; dyskinesia, 4. The total wall motion score (WMS) was obtained by adding the score for each segment. The WMSI was calculated by dividing the total wall motion score by 16, as shown in Figure 2.
-196-F) Coronary Angioplasty:
All patients transferred directly to cath lab in a timely fashion in accordance with guidelines, the door to balloon time (DBT) was calculated. All patients received chewable aspirin 300 mg and clopidogrel 600 mg before the procedure. Coronary angiography was done in the standard fashion; after local infiltration anesthesia by lignocaine, the common femoral artery was punctured using seldinger's technique. Judkins left catheter was used for left coronary angiography, Judkins or Amplatz right catheter was used for right coronary angiography preloaded with a 0.035 inch tapered, movable core J- wire advanced through the sheath. Coronary angiography was performed in multiple projections for adequate analysis of target lesions. Heparin (10,000 U) was administered after coronary anatomy was defined. Floppy wire 0.014 zinger was used to negotiate the culprit lesions, Export aspiration catheter for thrombus aspiration then drug eluting stent (Endeavor resolute integrity) was put either after balloon dilatation or directly only in IRA [12].
Patients were then transferred to CCU, kept on intravenous glycoprotein (GP) IIb/IIIa aggrastat
with platlet monitoring and other anti ischemic treatment. Digital coronary angiograms were analyzed offline with an automated edge detection system (Philips Integris HM 5000, Netherland). Infarct related artery (IRA) was identified and its severity was calculated as: Total when there was no antegrade flow across the lesion, Subtotal when there was penetration without perfusion. Contrast material passes beyond the area of obstruction but fails to opacify the entire coronary bed distal to the obstruction for the duration of the cine angiographic filming sequence.
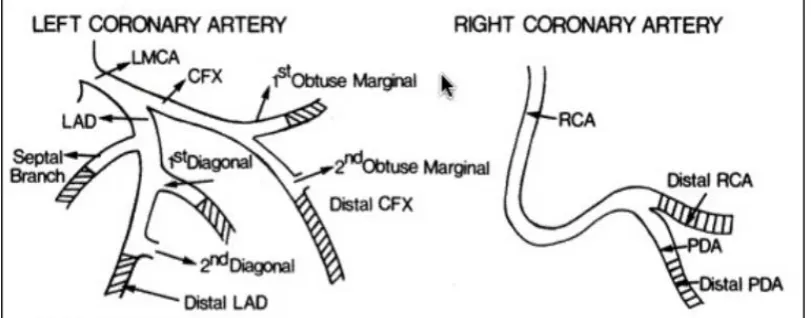
Total number of vessels having lesions as well as number of total occlusions other than culprit one were calculated. Coronary lesions other than culprit one were considered significant if any stenosis of ≥ 70% in at least one major epicardial coronary artery. For left main (LM), lesion ≥ 50% was considered significant. The extent of coronary atherosclerosis was assessed by the modified Gensini score [13]. In this score, angiographic coronary artery disease extension points calculated from stenosis score × segment score in 8 coronary segments [14]. Figure 3 and
Table 2
-197-Table 2: Modified Gensini risk score [14].
Statistical analysis
All statistical data were processed using the IBM SPSS 19 software. Data were expressed as mean ± standard deviation (SD). Student t-test, and chi-square test were used to compare the variables. Correlations between the ejection fraction and other parameters were analyzed. A stepwise multivariate analysis was done for independent variables. Odds ratios and 95% confidence intervals were also calculated. A P value of less than 0.05 was considered significant. A prediction score was developed to provide a schema for the assessment of a patient’s likelihood of having depressed LV function using variables readily accessible during patient admission. Key predictors from the multivariate logistic regression as well as likely significant confounders based on clinical knowledge were included in the prediction score. Cutoffs were established with the design of maximizing the
sensitivity of the prediction score. Fit was assessed using a receiver-operating characteristic curve.
RESULTS Demographic data and risk factors:
The mean age of the patients was 52.6 ± 8.9 years, 78 patients (78%) were males and 22 (22%) were females, 59 patients (59%) were diabetic, 49 patients (49%) were hypertensive , 44 patients (44%) were current smokers, 61 patients (61%) were dyslipidemic, 27 patients (27%) with positive family history of CAD, 8 patients (6%) needed mechanical ventilation during their admission, All patients had undergone primary PCI for reperfusion.
-198-Table 3: Demographic and clinical data in the study groups (I&II) according to ejection fraction.
Variable Group I (n) = 36 Group II (n) = 64 P-Value Age (χ ±SD) 54.1 ± 10.2 51.7±8.1 0.234 NS
Gender n (%)
Female 10 (27.8%) 12 (18.8%)
0.2 NS
Male 26 (72.2%) 52 (81.2%)
HTN n (%) 15 (41.7 %) 34 (53.1%) 0.2 NS
Known DM n (%) 22 (61.1%) 37 (57.8%) 0.7 NS
Smoker n (%) 14 (38.9 %) 30 (46.9%) 0.4 NS
Dyslipidemia n (%) 21 (58.3%) 40 (62.5%) 0.6 NS
CAD history n (%) 10 (27.8%) 17 (26.6%) 0.89 NS
SBP (χ ±SD) 130.03±16.9 131.61±20.69 0.680 NS
DBP (χ ±SD) 80.42±10.72 82.58±13.1 0.375 NS
Heart rate (χ ±SD) 76.03±13.84 73.34±14.22 0.360 NS
KILLIP class n (%)
I 19 (52.8%) 52 (81.2%)
0.003*
II 17 (47.2%) 12 (18.2%)
Need for MV n (%) 19 (52.8%) 2 (3.1%) 0.001**
n= Number, χ =mean, SD=standard deviation, MV= mechanical ventilation, NS= non- significant, * significant, ** highly significant
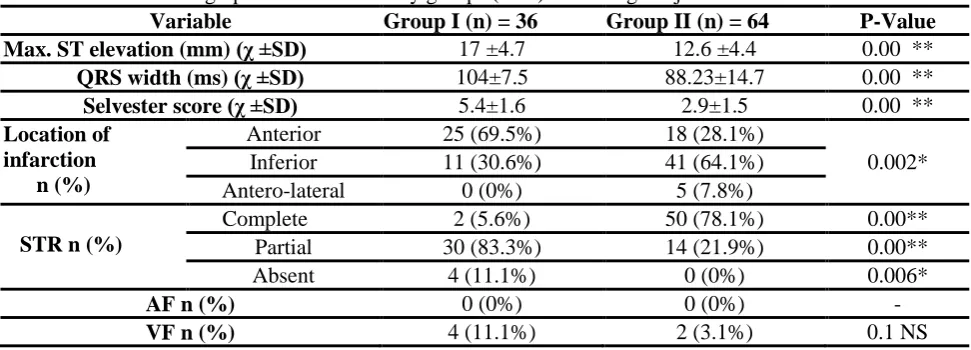
Table 4: Electrocardiographic data in the study groups (I&II) according to ejection fraction.
Variable Group I (n) = 36 Group II (n) = 64 P-Value Max. ST elevation (mm) (χ ±SD) 17 ±4.7 12.6 ±4.4 0.00 **
QRS width (ms) (χ ±SD) 104±7.5 88.23±14.7 0.00 **
Selvester score (χ ±SD) 5.4±1.6 2.9±1.5 0.00 **
Location of infarction n (%)
Anterior 25 (69.5%) 18 (28.1%)
0.002*
Inferior 11 (30.6%) 41 (64.1%)
Antero-lateral 0 (0%) 5 (7.8%)
STR n (%)
Complete 2 (5.6%) 50 (78.1%) 0.00**
Partial 30 (83.3%) 14 (21.9%) 0.00**
Absent 4 (11.1%) 0 (0%) 0.006*
AF n (%) 0 (0%) 0 (0%) -
VF n (%) 4 (11.1%) 2 (3.1%) 0.1 NS
STR= ST segment resolution, ms= milliseconds, AF= atrial fibrillation, VF= Ventricular fibrillation.
Table 5: Laboratory data in the study groups (I&II) according to ejection fraction.
Variable Group I (n) = 36 Group II (n) = 64 P-Value
χ ±SD χ ±SD
Peak CK-MB (ng/ml) 166.5 ± 71.2 186.12 0.15 NS
Troponin (ng/ml) 2.98 ± 2.5 2.7±2.35 0.63 NS
Creatinine (mg/dl) 1.2 ± 0.5 0.95±0.34 0.007*
Cholesterol (mg/dl) 176.4±48.8 185.9±48.7 0.35 NS
TG (mg/dl) 118.9±54.99 144.8±111.2 0.19 NS
HDL (mg/dl) 38.9± 7.8 38.9± 7.96 0.96 NS
LDL (mg/dl) 108.62 108.3± 32.2 0.96 NS
RBS (mg/dl) 200.48±91.3 195.9±85.6 0.81 NS
HDL: high density lipoprotein, LDL: Low density lipoprotein, CK-MB: creatine kinase myocardial band,
-199-Table 6: Echocardiographic data the in study groups
Variable Group I (n) = 36 Group II (n) = 64 P-Value
(χ ±SD) (χ ±SD)
EDV mL 103 ± 18 83 ± 18 <0.001**
ESV mL 66 ± 13 37 ± 11 <0.001**
Biplane EF % 35.6±5.19 54.4±5.6 0.00**
WMSI 2.23± 0.2 1.5 ± 0.22 0.00**
EDV= end diastolic volume, ESV= end systolic volume, EF= ejection fraction, WMSI= wall motion score index, mL= milliliter
Table 7: Angiographic data in the study groups (I&II)
Variable Group I (n) =36 Group II (n) = 64 P-value
Number of totally diseased vessels
Single 6 (16.7%) 39 (60.9%)
0.00 **
Two 14 (38.9%) 20 (31.2%)
Three 11 (30.6%) 3 (4.7%)
Four 4 (11.1%) 2 (3.1%)
Six 1 (2.8%) 0 (0%)
Culprit artery
LAD 25 (69.4) 19 (29.7%)
0.002*
LCX 3 (8.3%) 13 (20.3%)
OM2 0 (0%) 1 (1.6%)
RCA 8 (22.2%) 31 (48.4%)
No. of totally occluded vessels including culprit
One 34 (94.4%) 62 (96.9%) 0.5 NS
Two 2 (5.6%) 2 (3.1%)
Other significant vessels 27 (75%) 15 (23.4%) 0.00**
Culprit vessel severity (χ ±SD) 99.1±1.7 97.23±12.5 0.375 NS
Gensini score (χ ±SD) 136.11±40.5 87.9±31.31 0.00**
DBT (χ ±SD) 80.7±22.23 81.02±21.71 0.939 NS
χ = mean, SD= standard deviation, LAD= left anterior descending, LCX= left circumflex, RCA= right coronary artery, OM= obtuse marginal, DBT= door to balloon time, Significant vessel= left main > 50 % or non-left main lesion 70%.
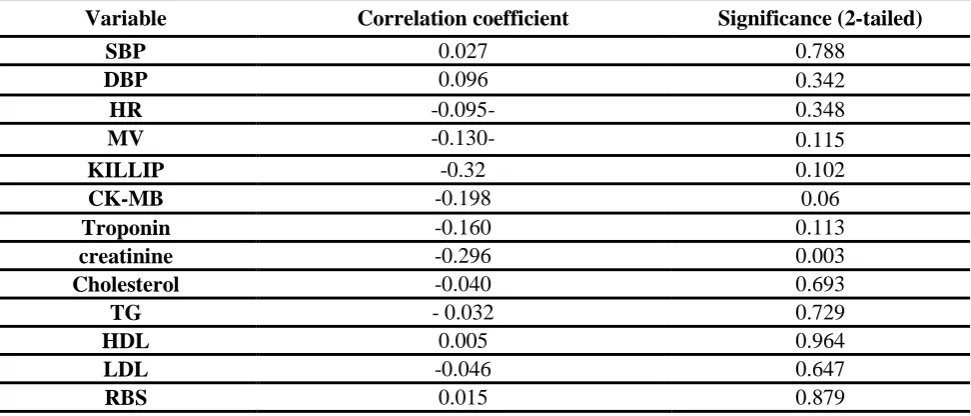
Table 8: Correlations of ejection fraction with clinical and laboratory data
Variable Correlation coefficient Significance (2-tailed)
SBP 0.027 0.788
DBP 0.096 0.342
HR -0.095- 0.348
MV -0.130- 0.115
KILLIP -0.32 0.102
CK-MB -0.198 0.06
Troponin -0.160 0.113
creatinine -0.296 0.003
Cholesterol -0.040 0.693
TG - 0.032 0.729
HDL 0.005 0.964
LDL -0.046 0.647
RBS 0.015 0.879
SBP= systolic blood pressure, DBP= diastolic blood pressure, HR= heart rate, MV= mechanical ventilation,
HDL: high density lipoprotein, LDL: Low density lipoprotein , CK-MB: creatine kinase myocardial band,
-200-Table 9: Correlations between ejection fraction with electrocardiographic and echocardiographic data
Variable Correlations Significance (2-tailed)
STE mm -0.398 < 0.001**
QRS width -0.538 < 0.001**
Selvester score - 0.611 < 0.001**
STR 0.646 <0.001**
WMSI -0.994 < 0.001**
LV ESV -0.625 <0.001**
STE= ST elevation in mm, STR= ST resolution, WMSI= wall motion score index, LV= left ventricle,
ESV= end systolic volume, **= highly significant
Table 10: Correlation of ejection fraction with angiographic parameters
Variable Correlation Significance (2-tailed) Gensini score - 0.530 < 0.001
Culprit vessel severity - 0.024 0.811
DBT - 0.091 0.366
Number of diseased vessels - 0.452 < 0.001
No. of totally occluded vessels -0.235 0.21
DBT: door to balloon time.
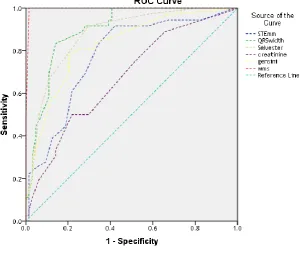
A ROC curve was then constructed for significant continuous quantitative variables and area under the curve AUC, cut off point for every variable was determined as follows: Table 11 and figure 4
-201-Table 11: Cut off points of different variables to detect depressed LV function (EF ≤ 40%)
Variable Cut off point sensitivity Specificity
STE (mm) 13.5 83.3% 65.6%
QRS width (ms) 98.5 83.3% 85.9%
Selvester score 3.5 91.7% 70.3%
Creatinine(mg/dl) 1.1 50% 76.6%
Gensini Score 95 80.6% 75%
WMSI 2.05 97.2 % 98.4%
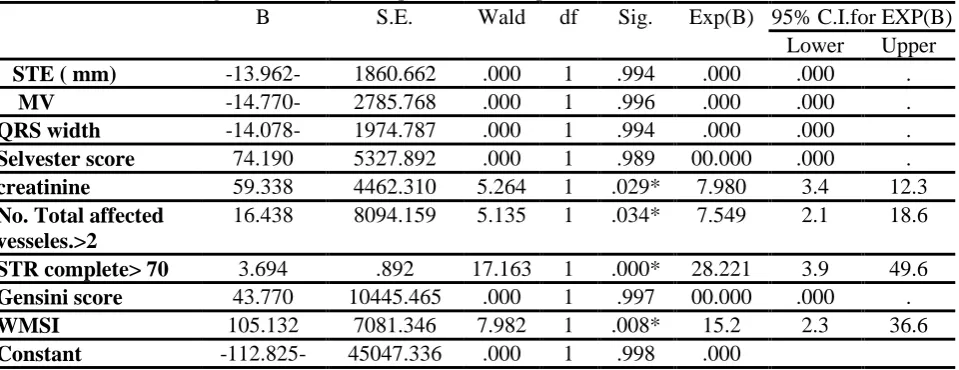
Table 12: multivariate regression analysis for predictors of depressed LV function
B S.E. Wald df Sig. Exp(B) 95% C.I.for EXP(B)
Lower Upper
STE ( mm) -13.962- 1860.662 .000 1 .994 .000 .000 .
MV -14.770- 2785.768 .000 1 .996 .000 .000 .
QRS width -14.078- 1974.787 .000 1 .994 .000 .000 .
Selvester score 74.190 5327.892 .000 1 .989 00.000 .000 .
creatinine 59.338 4462.310 5.264 1 .029* 7.980 3.4 12.3
No. Total affected vesseles.>2
16.438 8094.159 5.135 1 .034* 7.549 2.1 18.6
STR complete> 70 3.694 .892 17.163 1 .000* 28.221 3.9 49.6
Gensini score 43.770 10445.465 .000 1 .997 00.000 .000 .
WMSI 105.132 7081.346 7.982 1 .008* 15.2 2.3 36.6
Constant -112.825- 45047.336 .000 1 .998 .000
STE= ST elevation, MV= mechanical ventilation, STR= ST resolution, WMSI= wall motion score index, df= degree of freedom, S.E= standard of error, CI= confidence interval
By multivariate analysis, we found four significant independent predictors of depressed left ventricle function (EF≤ 40%). They were creatinine level (p= 0.029), total number of affected vessels (p= 0.034), complete STR (p= 0.00) and WMSI (p=0.008).
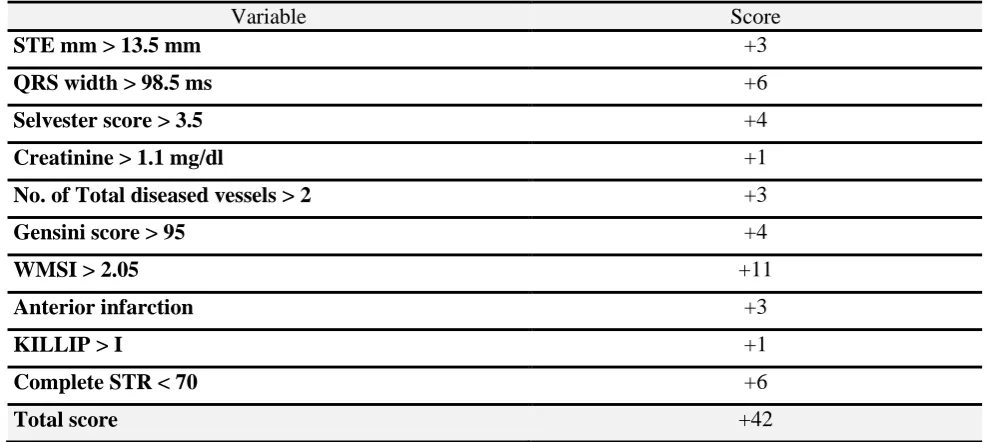
-202-Table 13: Score for prediction of depressed left ventricle function (EF ≤ 40%)
Variable Score
STE mm > 13.5 mm +3
QRS width > 98.5 ms +6
Selvester score > 3.5 +4
Creatinine > 1.1 mg/dl +1
No. of Total diseased vessels > 2 +3
Gensini score > 95 +4
WMSI > 2.05 +11
Anterior infarction +3
KILLIP > I +1
Complete STR < 70 +6
Total score +42
To maximize clinical applicability, cut point of 21 for prediction score was set. At cut point of > 21 (with higher scores representing a higher likelihood of having depressed left ventricle function), test sensitivity was 97.2% and specificity was 98.4% Table 14
Table 14: Significance and Likelihood ratio associated with the predictive score at cut of point 21
GROUP Total X2 P KAPPA
AGREEMENT
P Likelihood ratio
P .>40% ≤ 40%
Score ≤21 63 1 64
91.5 0.00** 0.957 0.00** 111.2 0.00** 98.4% 2.8% 64.0%
>21 1 35 36
1.6% 97.2% 36.0%
Total 64 36 100
100.0% 100.0% 100.0%
In order to assess consistency of the test, sensitivity, specificity, positive predictive value, negative predictive value and accuracy were measured. Table 15
Table 15: Consistency of the predictive score.
Sensitivity specificity +VE predictive -VE predictive accuracy
97.2% 98.4% 97.2% 98.4% 98%
A 3 tiered score was then constructed to divide patients in to 3 categories: Table 16 a) Low risk (score 0-14) with likelihood ratio of 2.9
b) Intermediate risk (15-28) with likelihood ratio of 2.1 c) high risk (29-42) with likelihood ratio of 2.4
Table 16: Likelihood ratios associated with prediction score ranges
Score Group Likelihood ratio
I (EF≤ 40%) II (EF>40%)
0-14 0 (0%) 53 (83%) 2.9
15-28 15 (42%) 11 (17%) 2.1
-203-DISCUSSION
The present study showed no statistical significant difference between the two groups as regard age and sex, hypertension HTN, diabetes mellitus DM, smoking and dyslipidemia. This was concordant with Bhave et al. [6].
Regarding age, our study was discordant with Ali et al. [15] who stated thatolder age may predict LV dysfunction and heart failure in patients treated with thrombolysis for STEMI. This discrepancy could be explained by larger sample volume included in his study, higher mean age and different modalities of revascularization.
Regarding sex, our result was discordant with Shacham et al. [16], they made a comparison of left ventricular function following first STEMI treated with primary percutaneous intervention pPCI and concluded that female patients demonstrated worse systolic and diastolic LV function, despite receiving similar treatment as male patients. This discrepancy could be explained by older females in their study and the co-morbidities they had in their study.
Regarding diabetes mellitus and smoking, our study was discordant with Mateus et al. [17]. They stated that a history of diabetes has consistently been linked to greater morbidity and mortality, both in-hospital and post-discharge, in patients admitted for AMI with or without ST elevation, and may be related to the likelihood of impaired LV systolic function. In addition, in their study smoking increased the risk of left ventricular dysfunction compared to non- or ex-smokers. Although non significant, the prevalence of DM and smoking were higher in those with depressed LV function. This discrepancy might be attributed to different point to define LV dysfunction (they used EF of 45 %).
Our study showed no significant difference between the two groups regarding history of coronary artery disease (CAD), this was concordant with Świątkiewicz et al. [18] but was discordant with Bhave et al. [6]. In their study, a history of coronary artery disease was associated with a 3.1-fold increase in the odds of having depressed LV function (p=0.014). This discrepancy might be attributed to larger sample volume included in their study (434 patients).
Our study showed no significant difference between the two groups regarding systolic blood pressure (SBP), diastolic blood pressure (DBP) and heart rate (HR). This was concordant with
Hamdan et al. [19].
Regarding SBP, our result was discordant with Jia et al. [20]. In their study, SBP was an independent predictor of LV dysfunction in a
multivariate regression analysis. Larger sample volume (850) might explain this discrepancy. In addition, different value used to defined depressed LV function, EF of 50% was used as cut off point. Regarding heart rate, our result was discordant with Honda et al. [21] in which 200 patients with myocardial infarction had undergone
urgent coronary angiography and
revascularization with different modalities, heart rate on admission was a significant independent predictor of depressed LV function before discharge. This discrepancy might be explained by larger patients number, different point of defining depressed function (EF <50%), different ways of revascularization and different grouping of patients (they grouped patients in to four quartiles as regard heart rate).
Regarding KILLIP class, we found a significant association between KILLIP class and EF, KILLIP class II was higher in group I (EF ≤ 40%) (p= 0.003). In a meta-analysis of three angioplasty trials on 2,654 acute myocardial infarction patients conducted by DeGeare et al. [22], their results were concordant with ours. They found that higher KILLIP class was associated with greater in-hospital (2.4%, 7%, and 19% for class I, II, and III, respectively) and 6-month mortality (4%, 10%, and 28% for class I, II, and III, respectively) as well as lower left ventricular ejection fraction (p <0.0001)
Regarding need for mechanical ventilation (MV), we found significant difference between the 2 groups (p= 0.001) being more frequently encountered in group I. This was concordant with
Bhave et al. [6] in which the need for mechanical ventilation was the strongest predictor of depressed LV function (adjusted odds ratio 3.98, 95% confidence interval 1.41 to 11.19, p = 0.009).
We found significant difference between the two groups regarding location of infarction (p= 0.0002).Anterior infarction was more frequent in group I while inferior and anterolateral infarctions were more in group II. This was concordant with
Świątkiewicz et al. [18]. This could be explained by the fact that anterior MI patients experience more pronounced post-infarction LV remodeling and dysfunction than non-anterior MI patients due to a greater magnitude of irreversible ischaemic LV damage without any independent contribution of MI location [23].
-204-In our study, we found a significant difference between the two groups regarding maximum ST segment elevation with negative correlation (r= -0.398, p< 0.001). This finding was in line with a previous study Bhave et al. [6] who found that in STEMI patients ST segment elevation > 2 mm was found to be an independent predictor of depressed LV function. This goes with the fact that the height of ST segment elevations may be a surrogate for the size of the myocardial territory being injured so, it is not surprising that greater magnitude of ST-segment elevations correlates with ventricular dysfunction
[6].
Regarding ST segment resolution, we found a statistically significant difference between both groups in which complete STR > 70% was higher in group II (p<0.001) while partial and absent STR were higher in group I (p<0.001, p= 0.006 respectively).
Our result was concordant with that of
Matetzky et al. [24]. They reported 28% left ventricular dysfunction rate in patients without ST resolution versus 19 % in with ST resolution. In addition, a study conducted by Tomaszuk-Kazberuk et al. [25] was in line with our results, they showed that frequency of left ventricular dysfunction was greater in post MI patients who did not show any ST resolution. They concluded that return of normal LV systolic function is linked to ST resolution.
Lee et al. [26] carried out a study to emphasize the relation between ST resolution and left ventricular recovery. Their results showed that in patients with ST segment resolution left ventricular ejection fraction and muscle contractility improved significantly. While in patients who did not show any ST resolution, changes relating to LV function were insignificant thus, there was no improvement in LV function.
Our results were discordant to a Kosuge et al. [27]. They evaluated the clinical significance of ST resolution in 129 patients with anterior wall MI who underwent successful coronary recanalization within 6 hours after symptom onset by studying the relation to myocardial blush grade. In their study, the QRS score after recanalization and the pre-discharge LV ejection fraction were similar in patients who had ST resolution with blush grade 0 or 1 and in those without ST resolution. They suggested that ST resolution after recanalization does not consistently predict myocardial salvage in patients with anterior MI. This discrepancy may be due to their inclusion of anterior MI only which is known to have a larger area of myocardium affected and
hence lower likelihood of ST resolution and improved LV function.
Regarding QRS width, we found a statistically significant difference between groups as QRS width was higher in-group I more than II (p<0.001) with significant negative correlation with EF (r= -0.538, p<0.001). This was concordant with Murkofsky et al. [28] study in which 270 patients were subjected to radionuclide ventriculography, QRS duration on standard resting ECG was correlated with EF and they concluded that a prolongation of the QRS duration (>0.10 s) on a standard 12-lead ECG was associated with lower LV EF and larger end-systolic and end-diastolic volumes, as determined by radionuclide gated blood pool imaging. The high specificity of the 12-lead ECG for the prediction of abnormal LV systolic function suggests that in patients with QRS duration >0.10 s, there is a high likelihood that the resting LV EF is abnormal. This goes with the fact that increased QRS duration is associated with more advanced remodeling in patients with CAD and poor LV function [29].
On the other hand, in the sight of the Valsartan in acute myocardial infarction (VALIANT) trial, one of the largest long-term study of survivors of acute MI; 14,703 patients were enrolled between 0.5 and 10 days following MI, Yerra et al. [30] found that a prolonged QRS duration at baseline was associated with larger ventricular volumes and reduced systolic function. However, following adjustment for other variables, including age, ejection fraction, and Killip class, the association of prolonged QRS duration for adverse cardiovascular outcomes lost significance. In addition, there were no appreciable differences in ventricular remodeling between the baseline QRS duration groups.
We found statistically significant difference between the two group regarding Selvester score being higher in group I with a strong negative association with EF (r= -0611, p<0.001). This result was in agreement with Ghayal et al. [31]
who investigated the use of ECG selvester score (SS) in estimating infarct size in patients undergoing primary PCI.They concluded that the ECG Selvester score was a better predictor of infarct size and reduced LVEF than cardiac biomarkers in patients undergoing primary PCI for STEMI.
However, our result was discordant with
-205-and pre discharge resting technetium - 99m - sestamibi scan for whether infarct size and left ventricular ejection fraction could be predicted by the pre discharge QRS score or not. They concluded that overall, the correlation between the QRS score and the myocardial perfusion defect extent (rho 0.249; p = 0.08) and ejection fraction (rho -0.229; p = 0.11) was poor. This discrepancy could be explained by lower sample volume in their study, different modalities of reperfusion and the inclusion of those with anterior MI only.
In the present study, we found significant difference between the two groups regarding creatinine level being higher in group I (p= 0.007) with negative correlation of high significance with EF (r= -0.296, p= 0.003). This was consistent with a previous study [6]. In his study, a baseline creatinine level of 1.0 to 1.5 mg/dl was associated with 2.4-fold increase in the odds of having depressed LV function compared to patients whose creatinine levels were <1.0 mg/dl.
Our result was discordant with a more recent study the HORIZONS-AMI trial conducted by Ng et al. [33] in which LVEF was determined in 2648 (73.5%) of 3602 enrolled STEMI patients, who were divided into three groups, severely impaired (LVEF <40%); moderately impaired (LVEF 40–50%); and normal (LVEF ≥50%). In this study, creatinine showed no significant difference among the three groups as regard LVEF (p=0.5). This discrepancy may be explained by different modality in assessing renal impairment (creatinine clearance < 60 ml/min compared to creatinine level in our study) and different grouping as regard LVEF and definition of depressed function.
In our study, we found no significant difference between both groups regarding maximum creatine kinase (CK-MB) level. (p= 0.15) and non significant negative correlation with EF(r= -0.198, p=0.06). This was in line with a study of Grande et al. [34].
However, this result was not concordant with
Turer et al. [35] in which they studied patients from 2 randomized trials and investigated the correlation between peak CK-MB and both infarction size measured by single photon emission tomography (SPECT) and EF measured by echo. They concluded that CK-MB values have significant correlation with both of them (r = -0.30, P = 0.035). This discrepancy might be attributed to small sample size in our study compared to them and different modality in assessment of EF.
This was also discordant with a study of
Hamdan et al. [19].They studied 168 STEMI
patients treated with pPCI. In their study, peak CK was one of the most significant predictors of LV dysfunction after first anterior AMI. (r = 0.3, P = 0.0001). This discrepancy may be explained by their higher sample size of 168 patients.
Regarding troponin level, we found no significant difference between our groups (p=0.63). This result was concordant with a previous study [6].
However, our results were in disagreement with that of Chia et al. [36], they sought to determine the best cardiac biomarker to predict infarct size, left ventricular ejection fraction (LVEF), and clinical outcome in patients undergoing primary percutaneous coronary intervention (PCI) for ST-segment elevation myocardial infarction (STEMI). They concluded that 72-h troponin I (TnI72h) correlated strongly with 5-day and 30-day infarct size (r=0.70; p=0.001). A TnI72h threshold >55 ng/ml was 90% sensitive for large infarct size (≥ 10%) and low LVEF (≤40%) with specificities of 70% and 52%, respectively (p=0.001). This discrepancy might be explained by their larger sample size (378 patients), different method in assessing LV function by single photon emission computed tomography (SPECT) which has higher sensitivity in detecting myocardial salvage and greater frequency of suboptimal TIMI scores post-procedure leading to larger residual infarct size and poorer LV function.
We found no significant difference between the two groups regarding admission random blood sugar (p=0.81). This result was in concordant with a previous study [6].
However, our results were discordant with that of Terlecki et al. [37] in which they studied the effect of admission hyperglycemia on patients with STEMI. In their study on 246 STEMI patients treated by early invasive strategy, they found significant difference as regard LV function represented by ejection fraction between those with normoglycemia versus patients with hyperglycemia being lower in the latter group (p=0.0022). This discrepancy may be explained by higher number of patients included in their study, their lower value of defining hyperglycemia which was 7.8 mmole/L (140 mg/dl) and our higher mean value of admission blood sugar for those with depressed LV function (200 mg/dl).
-206-0.19, HDL p= 0.96, LDL p= 0.96). This was concordant with previous studies [6,19].
On the other hand, in a study conducted by
Mateus et al. [17] aboutimpact of cardiovascular risk factors on LV function in STEMI patients, dyslipidemia was less common in patients with depressed LV function (35.4 % vs. 56.9 %, p = 0.01). This discrepancy might be due to higher sample and higher percentage of dyslipidemic patients in depressed LV function group.
In our study, there was significant difference between the two groups regarding number of diseased vessels (p <0.001) being higher in group I with depressed LV function (p<0.001). This result was concordant with a study of Mateus et al. [17] and also a recent study of Altmann et al. [38], this goes with the fact that increased number of affected vessels impairs perfusion of larger myocardial area and hence impair function [39].
On the contrary, our results were in disagreement with that of Hamdan et al. [19]. In their study, there was no significant difference regarding number of diseased vessels among STEMI patients stratified by EF. This discrepancy may be attributed to different way in stratifying patients as regard EF in to 3 groups (normal to mild, moderate and severe) with nearly comparable number of patients in all groups.
In our study, there was significant difference between the two groups regarding culprit vessel during pPCI (p <0.001). Culprit left anterior descending (LAD) was frequently encountered in group I (EF≤40%) while culprit left circumflex (LCX) and right coronary artery (RCA) were more in group II (EF ≥40%). This result was concordant with that of Altmann et al. [38], this goes with the fact that LAD supplies large myocardial area and its affection impairs perfusion of larger myocardial area and hence impair function [39].
In our study, there was significant difference between the two groups regarding Gensini score (p< 0.001) with strong negative correlation with EF and high statistical significance (r = - 0.53, p<0.001).This was concordant with Jia et al. [20].
This goes with the fact of higher Gensini score is associated with more severe coronary artery disease, lower ST segment resolution and lower LV function [40].
In our study, there was significant difference between the two groups regarding wall motion score index (WMSI) being higher in group I (p < 0.001) with strong negative correlation of high significance with EF (p< 0.001, r= -0.99).
Our result was concordant with Galasko et al. [41]. They sought to characterize post-
myocardial infarction echocardiographic WMSI as a measure of EF both in the immediate aftermath of acute myocardial infarction (AMI) and at six month follow up. 174 AMI were included in the study and they found that WMSIs of 0.6, 0.8, and 1.1 corresponded best to EFs 45%, 40%, and 35%, respectively a greater degree of wall motion abnormality must take place before a lower EF occurs.
Again, it is obviously logic that we did not find discordant studies that negate the association between higher Genisini score and WMSI with depressed LV function.
Our study demonstrated that decreased renal function (creatinine > 1.1 mg/dl), increased total number of diseased vessels > 2, absence of complete ST segment resolution, wall motion score index > 2.05, increased sum of ST segment elevation > 13.5 mm, QRS width > 98.5 ms, Selvester score > 3.5, Gensini score > 95, anterior location of infarction and KILLIP class > 1 are significant predictors of depressed LV function in patients presenting with STEMI.
Using previous variables with their cut off points, a dichotomous prediction score created with the goal of having high sensitivity for depressed LV function. High sensitivity test was considered desirable, because that characteristic allows providers to separate patients into 2 groups: very low risk for LV dysfunction and intermediate to high risk for LV dysfunction. A cut point of 21 was set for this purpose with 97.2% sensitivity and 98.4% specificity. Using a 3-tiered score categorization, discrimination among low-, intermediate-, and high-risk patients was possible.
Of 100 patients included in our study, 53 were considered as low risk patients (score 0-14) with likelihood of 2.9, 26 were considered moderate risk (score 15-28) with likelihood ratio of 2.1 and 21 considered as high risk patients (score 29-42) with likelihood ratio of 2.4.
Study limitation:
1- Small sample size of our study. This could limit the generalizability of our findings. 2- The results obtained from a single medical
center (Zagazig University hospital) 3- Selection bias may present because of
exclusion of few patients who did not do echocardiography during their index hospitalization.
4- Lack of long term follow up of left ventricle function so that we could not detect possible LV function recovery with time.
-207-6- We did not take in to consideration SYNTAX
score in assessing severity of coronary artery disease.
CONCLUSION
Our findings may aid in the clinical management of patients with STEMI in the early stages of their hospitalization. Recent studies have shown that early blocker administration, a therapy long considered the standard of care in the emergency department for STEMI, decreases the risk for arrhythmia and re-infarction but at the cost of a significant increase in the incidence of cardiogenic shock.
A high prediction score for LV dysfunction may identify patients who are likely to have more harm than benefit from early blockade. In contrast, patients with low prediction scores could be targeted as better candidates for early beta-blocker therapy and would more likely tolerate the administration of intravenous fluids. Additionally, high-risk scores could serve as a signal to providers that those patients warrant closer monitoring for the development of congestive heart failure and arrhythmias. Such patients may also need to be repeatedly assessed for select post-infarction therapies, such as eplerenone or an implantable cardioverter-defibrillator.
REFERENCES
1. Jernberg T, Johanson P, Held C, Svennblad B, Lindbäck J, Wallentin L, & SWEDEHEART/RIKS-HIA (2011). Association between adoption of evidence-based treatment and survival for patients with ST-elevation myocardial infarction, JAMA: the journal of the American Medical Association 305, 1677–1684.
2. Golabchi A, Sadeghi M, Sanei H, Akhbari MR, Seiedhosseini SM, Khosravi P, & Alisaeedi AR (2010). Can timi risk score predict angiographic involvement in patients with st-elevation myocardial infarction?, ARYA atherosclerosis 6, 69–73.
3. Antoni ML, Boden H, Delgado V, Boersma E, Fox K, Schalij MJ, & Bax JJ (2012). Relationship between discharge heart rate and mortality in patients after acute myocardial infarction treated with primary percutaneous coronary intervention, European heart journal 33, 96–102.
4. Gao Z, Xu B, Yang Y-J, Kandzari DE, Yuan J-Q, Chen J, Chen J-L, Qiao S-B, Wu Y-J, Yan H-B, Qin X-W, Yao M, Liu H-B, Dai J, Chen T, Teng S-Y, & Gao R-L (2012). Clinical and angiographic correlates of left ventricular dysfunction in patients with three vessel coronary disease, Chinese medical journal 125, 4221–4225.
5. Andrassy M, Volz HC, Riedle N, Gitsioudis G, Seidel C, Laohachewin D, Zankl AR, Kaya Z, Bierhaus A, Giannitsis E, Katus HA, & Korosoglou G (2011). HMGB1 as a predictor of infarct transmurality and functional recovery in
patients with myocardial infarction, Journal of internal medicine 270, 245–253.
6. Bhave PD, Hoffmayer KS, Armstrong EJ, Garg S, Patel A, Macgregor JS, Stein JC, Kinlay S, Ganz P, & McCabe JM (2012). Predictors of depressed left ventricular function in patients presenting with ST-elevation myocardial infarction, The American journal of cardiology 109, 327–331.
7. Schröder R (2004). Prognostic impact of early ST-segment resolution in acute ST-elevation myocardial infarction, Circulation 110, e506–510. 8. Strauss DG, & Selvester RH (2009). The QRS
complex--a biomarker that ‘images’ the heart: QRS scores to quantify myocardial scar in the presence of normal and abnormal ventricular conduction, Journal of electrocardiology 42, 85– 96.
9. Lang RM, Bierig M, Devereux RB, Flachskampf FA, Foster E, Pellikka PA, Picard MH, Roman MJ, Seward J, Shanewise JS, Solomon SD, Spencer KT, Sutton MSJ, Stewart WJ, Chamber Quantification Writing Group, American Society of Echocardiography’s Guidelines and Standards Committee, & European Association of Echocardiography (2005). Recommendations for chamber quantification: a report from the American Society of Echocardiography’s Guidelines and Standards Committee and the Chamber Quantification Writing Group, developed in conjunction with the European Association of Echocardiography, a branch of the European Society of Cardiology, Journal of the American Society of Echocardiography: official publication of the American Society of Echocardiography 18, 1440–1463.
10. Schiller NB, Shah PM, Crawford M, DeMaria A, Devereux R, Feigenbaum H, Gutgesell H, Reichek N, Sahn D, & Schnittger I (1989). Recommendations for quantitation of the left ventricle by two-dimensional echocardiography. American Society of Echocardiography Committee on Standards, Subcommittee on Quantitation of Two-Dimensional Echocardiograms, Journal of the American Society of Echocardiography: official publication of the American Society of Echocardiography 2, 358– 367.
11. Lebeau R, Serri K, Morice M-C, Hovasse T, Unterseeh T, Piéchaud J-F, & Garot J (2012). Assessment of left ventricular ejection fraction using the wall motion score index in cardiac magnetic resonance imaging, Archives of Cardiovascular Diseases 105, 91–98.
-208-Clinical and Applied Thrombosis/Hemostasis 16, 33–41.
13. Gensini GG (1983). A more meaningful scoring system for determining the severity of coronary heart disease, The American journal of cardiology 51, 606.
14. Sullivan DR, Marwick TH, & Freedman SB (1990). A new method of scoring coronary angiograms to reflect extent of coronary atherosclerosis and improve correlation with major risk factors, American heart journal 119, 1262– 1267.
15. Ali AS, Rybicki BA, Alam M, Wulbrecht N, Richer-Cornish K, Khaja F, Sabbah HN, & Goldstein S (1999). Clinical predictors of heart failure in patients with first acute myocardial infarction, American heart journal 138, 1133– 1139.
16. Shacham Y, Topilsky Y, Leshem-Rubinow E, Laufer-Perl M, Keren G, Roth A, Steinvil A, & Arbel Y (2014). Comparison of Left Ventricular Function Following First ST-Segment Elevation Myocardial Infarction Treated With Primary Percutaneous Coronary Intervention in Men Versus Women, The American journal of cardiology
17. Mateus PS, Dias CC, Betrencourt N, Adão L, Santos L, Sampaio F, Mateus C, Primo J, Simões L, Barros H, & Ribeiro VG (2005). Left ventricular dysfunction after acute myocardial infarction--the impact of cardiovascular risk factors, Revista portuguesa de cardiologia: orgão oficial da Sociedade Portuguesa de Cardiologia = Portuguese journal of cardiology: an official journal of the Portuguese Society of Cardiology 24, 727–734.
18. Świątkiewicz I, Magielski P, Woźnicki M, Gierach J, Jabłoński M, Fabiszak T, Koziński M, Sukiennik A, Bronisz A, & Kubica J (2012). Occurrence and predictors of left ventricular systolic dysfunction at hospital discharge and in long-term follow-up after acute myocardial infarction treated with primary percutaneous coronary intervention, Kardiologia polska 70, 329–340.
19. Hamdan A, Kornowski R, Solodky A, Fuchs S, Battler A, & Assali AR (2006). Predictors of left ventricular dysfunction in patients with first acute anterior myocardial infarction undergoing primary angioplasty, The Israel Medical Association journal: IMAJ 8, 532–535.
20. Jia E-Z, Xu Z-X, Yang Z-J, Zhu T-B, Wang L-S, Cao K-J, & Ma W-Z (2011). Severity of coronary atherosclerosis is an independent predictor of the left ventricular ejection fraction, Clinical and experimental pharmacology & physiology 38, 109–112.
21. Honda T, Kanazawa H, Koga H, Miyao Y, & Fujimoto K (2010). Heart rate on admission is an independent risk factor for poor cardiac function and in-hospital death after acute myocardial infarction, Journal of Cardiology 56, 197–203.
22. DeGeare VS, Boura JA, Grines LL, O’Neill WW, & Grines CL (2001). Predictive value of the Killip classification in patients undergoing primary percutaneous coronary intervention for acute myocardial infarction, The American journal of cardiology 87, 1035–1038.
23. Masci PG, Ganame J, Francone M, Desmet W, Lorenzoni V, Iacucci I, Barison A, Carbone I, Lombardi M, Agati L, Janssens S, & Bogaert J (2011). Relationship between location and size of myocardial infarction and their reciprocal influences on post-infarction left ventricular remodelling, European heart journal 32, 1640– 1648.
24. Matetzky S, Novikov M, Gruberg L, Freimark D, Feinberg M, Elian D, Novikov I, Di Segni E, Agranat O, Har-Zahav Y, Rabinowitz B, Kaplinsky E, & Hod H (1999). The significance of persistent ST elevation versus early resolution of ST segment elevation after primary PTCA, Journal of the American College of Cardiology 34, 1932–1938.
25. Tomaszuk-Kazberuk A, Musiał WJ, Dobrzycki S, & Korecki J (2004). Normalisation of elevated ST segment predicts return of left ventricular systolic function and improved outcome in patients with acute myocardial infarction, treated with primary coronary angioplasty, Kardiologia polska 60, 541– 549; discussion 550–551.
26. Lee S-G, Cheong J-P, Shin J-K, Kim J-W, & Park J-H (2002). Persistent ST-segment elevation after primary stenting for acute myocardial infarction: its relation to left ventricular recovery, Clinical cardiology 25, 372–377.
27. Kosuge M, Kimura K, Ishikawa T, Endo T, Sugano T, Hibi K, Nakagawa T, Nakatogawa T, Saito T, Okuda J, Tochikubo O, & Umemura S (2002). Reliability of resolution of ST-segment elevation after coronary reperfusion in predicting myocardial salvage in anterior wall acute myocardial infarction, The American Journal of Cardiology 90, 227–232.
28. Murkofsky RL, Dangas G, Diamond JA, Mehta D, Schaffer A, & Ambrose JA (1998). A prolonged QRS duration on surface electrocardiogram is a specific indicator of left ventricular dysfunction [see comment], Journal of the American College of Cardiology 32, 476–482.
29. De Winter O, Van de Veire N, Van Heuverswijn F, Van Pottelberge G, Gillebert TC, & De Sutter J (2006). Relationship between QRS duration, left ventricular volumes and prevalence of nonviability in patients with coronary artery disease and severe left ventricular dysfunction, European journal of heart failure 8, 275–277.
-209-31. Ghayal P, Mathur A, Hashim H, Raskin A, Di
Giorgio C, Mazza V, Maher J, Gerula C, & Klapholz M (2014). Predictive value of selvester score in estimating infarct size in patients undergoing primary percutaneous coronary intervention, Journal of the American College of Cardiology 63, A153.
32. Adler Y, Zafrir N, Ben-Gal T, Lulu OB, Maynard C, Sclarovsky S, Balicer R, Mager A, Strasberg B, Solodky A, Wagner GS, & Birnbaum Y (2000). Relation between evolutionary ST segment and T-wave direction and electrocardiographic prediction of mycardial infarct size and left ventricular function among patients with anterior wall Q-wave acute myocardial infarction who received reperfusion therapy, The American journal of cardiology 85, 927–933.
33. Ng VG, Lansky AJ, Meller S, Witzenbichler B, Guagliumi G, Peruga JZ, Brodie B, Shah R, Mehran R, & Stone GW (2013). The prognostic importance of left ventricular function in patients with ST-segment elevation myocardial infarction: the HORIZONS-AMI trial, European Heart
Journal: Acute Cardiovascular Care,
2048872613507149.
34. Grande P, Nielsen A, Wagner GS, & Christiansen C (1985). Quantitative influence of serum creatine kinase isoenzyme MB estimated infarct size and other prognostic variables on one year mortality after acute myocardial infarction., British Heart Journal 53, 9–15.
35. Turer AT, Mahaffey KW, Gallup D, Weaver WD, Christenson RH, Every NR, & Ohman EM (2005). Enzyme estimates of infarct size correlate with functional and clinical outcomes in the setting of ST-segment elevation myocardial infarction, Current controlled trials in cardiovascular medicine 6, 12.
36. Chia S, Senatore F, Raffel OC, Lee H, Wackers FJT, & Jang I-K (2008). Utility of cardiac biomarkers in predicting infarct size, left
ventricular function, and clinical outcome after primary percutaneous coronary intervention for ST-segment elevation myocardial infarction, JACC. Cardiovascular interventions 1, 415–423. 37. Terlecki M, Bednarek A, Kawecka-Jaszcz K,
Czarnecka D, & Bryniarski L (2013). Acute hyperglycaemia and inflammation in patients with ST segment elevation myocardial infarction, Kardiologia polska 71, 260–267.
38. Altmann DR, Mutschelknauss M, Ehl N, Koller M, Schaer B, Jörg L, Ammann P, Kühne M, Rickli H, Osswald S, & Sticherling C (2013). Prevalence of severely impaired left ventricular ejection fraction after reperfused ST-elevation myocardial infarction, Swiss medical weekly 143, w13869. 39. De Luca G, Gibson M, Cutlip D, Huber K, Dudek
D, Bellandi F, Noc M, Maioli M, Zorman S, Zeymer U, Secco GG, Mesquita Gabriel H, Emre A, Arntz H-R, Rakowski T, Gyongyosi M, Hof AWJV, & EGYPT Cooperation (2013). Impact of multivessel disease on myocardial perfusion and survival among patients undergoing primary percutaneous coronary intervention with glycoprotein IIb/IIIa inhibitors, Archives of cardiovascular diseases 106, 155–161.
40. Esen Zencirci A, Zencirci E, Degirmencioglu A, Karakus G, Ugurlucan M, Gunduz S, Ozden K, Erdem A, Karadeniz F, Ekmekci A, Erer H, Sayar N, & Eren M (2014). The relationship between Gensini score and ST-segment resolution in patients with acute ST-segment elevation myocardial infarction undergoing primary percutaneous coronary intervention, Kardiologia polska
41. Galasko GI, Basu S, Lahiri A, & Senior R (2001). A prospective comparison of echocardiographic wall motion score index and radionuclide ejection fraction in predicting outcome following acute myocardial infarction, Heart (British Cardiac
![Figure 1: Method of calculation of biplane Simpson method [9].](https://thumb-us.123doks.com/thumbv2/123dok_us/8762020.1752464/4.595.175.417.437.677/figure-method-calculation-biplane-simpson-method.webp)
![Table 2: Modified Gensini risk score [14].](https://thumb-us.123doks.com/thumbv2/123dok_us/8762020.1752464/6.595.61.364.107.333/table-modified-gensini-risk-score.webp)