Research Article
Circular Causality of R&D and Export in EU countries
Dilek Çetin1,2 and Michele Cincera3
Received: 25/11/2014Revised: 03/01/2015Accepted:05/03/2015
Abstract
The main objective of the study is to explore the relationship between Research and Development (R&D) investments and export behaviour in EU countries in the aspect of competitiveness. To this end, the micro-aggregated Community Innovation Survey 3 (CIS3) is used. Both the volume and the decision of R&D investment and export are found to be mutually dependent. Particularly, in manufacturing industry, the effect of export on R&D is underestimated and the one of R&D on export is overestimated. In the knowledge intensive sectors, circular causality link is broken between the R&D and export.
Keywords:Research and Development (R&D), export, EU, manufacturing, services.
JEL Codes: F14, O33
1Department of Economics, Kırıkkale University, Kırıkkale, Turkey.
2 Corresponding Author: email: dilekcetin@kku.edu.tr, dilekchetin@gmail.com
1. Introduction
Competitiveness is one of the main policy objectives in the current agenda of countries. One of the goals of the Lisbon strategy and of its successor, the strategy 2020, has been to increase Research and Development (R&D) expenditures to 3% of the GDP by 2020 to ensure competitiveness. One indicator of competitiveness is the export volume of a country. To increase exports and to compete with other countries, new and cheaper goods and services needs to be introduced in the market. To this end, innovation and R&D activities are important and necessary. As R&D is one unavoidable integrant for export, the reverse is also valid. Export is one channel of technology transfer. By exporting, the learning capacity of countries is significantly increased through knowledge spillovers. The main question is how R&D investments affect and are affected by international trade, especially by export. This paper analyses whether this relationship is mutually dependent, i.e. simultaneous, or not.
This paper is structured as follow. Section 2 reviews the literature of existing studies. In the section 3, the model constructed from the literature as well as the methodology implemented is exposed. Section 4 details the construction of the dataset and section 5 discusses the estimation results. Finally, the main findings of the paper are summarized in the conclusion and some policy implications are discussed.
2. Literature Review
Before starting to analyze the relationship between the R&D and export behaviour of the firms, it is useful to discuss common features of these two activities. The competitiveness literature is the linking point, while the knowledge spillovers literature is the common point. According to Marsh and Tokarick (1994) and Durand et al. (1992), export unit values of manufacturing goods are one of the five competitiveness indicator. The underlying fact is that when a firm has the ability to export, it proves that either it has a price or cost advantage over foreign firms which makes the firm competitive. R&D investments come to the stage when firms want to compete not only with domestic ones but also with foreign rivals. R&D investments are one of the main tools to become more competitive due to the price or cost advantage. This explains how R&D activities affect the exports.
Knowledge spillovers represent one of the main channel explaining how R&D investments are influenced from export. Three main sources of technological knowledge spillovers have been identified in the literature: foreign direct investments, R&D investments and trade (Cincera and van Pottelsberche de la Potterie, 2001). As regard the transmission mechanism of knowledge spillovers through trade, in particular imports, Coe and Helpman (1995), in their study at the macro level, constructed a R&D spillovers pool by taking the sum of foreign countries' R&D stocks weighted with the fraction of imports from these countries in GDP. However, one pitfall of their analysis is the assumption of a linear relationship between the share of imports and foreign R&D. Still one of the most influential and important studies in this area, one of its main conclusion is the fact that total factor productivity growth of one country depends not only on its own R&D stock but also on the ones of trade partners.
The size of the firm is a crucial determinant for both for the propensity and the volume of R&D investment and export. Schumpeter (1942) is the first economist to set forth that large firms spend more on R&D than smaller ones. In the Schumpeterian hypothesis, it is claimed that the relation between the R&D and size of the firm has an inverted U-shape. In the R&D literature, many studies (Gustavsson and Poldahl, 2003; Kleinknecht and Ploot, 1992) consider the 'size' as a main variable. Also 'size' is an important indicator in the trade literature. Economists studying the export function also consider 'size' as a main variable (Sjoholm, 2003; Wakelin, 1998). In the literature, there is not a unique common size variable used. Some studies consider employment (Bernard and Jensen, 2004) while others use sales (Gustavsson and Poldahl, 2003) or revenue (Aw et al., 2008) as a proxy for size.
In the R&D and export relationship, the effect of export on R&D is more ambiguous than the effect of R&D on export. In the export function, some researchers consider only innovation (Bernard and Jensen, 2004) or R&D (Sjoholm, 2003), while others use both (Rodriguez and Rodriguez, 2005). In the international trade literature, the effect of innovation is more visible than the effect of R&D (Roper and Love, 2002). This is mainly due to the fact that exporting firms are believed to be more competitive and have better a performance in terms of productivity, innovativeness, etc. than the non-exporting ones. New products or processes insure to have advantages over the other firms especially for small firms. Small and Medium Enterprises might not have enough R&D budget but new products and/or processes would allow them to improve their competitiveness in the foreign markets.
The decision and volume of export is also likely to be affected by other variables. The influence of the technological capacity or R&D investments of firms' might affect both the export intensity and export decision equally or differently. For example, Rodriguez and Rodriguez (2005) found that R&D investments have a significant influence the export intensity but no influence on the export decision. On the other hand, Zhao and Li (1997), investigating this question for China, suggest that technology has a crucial role in international competitiveness. Both the propensity and intensity of export is affected by the level of R&D investments.
In the R&D and trade literature, single estimation techniques (Bernard and Jensen, 2004; Sjoholm, 2003; Wakelin, 1998; Kleinknecht and Ploot, 1992; Gustavsson and Poldhal, 2003) are generally implemented. Simultaneous estimation techniques are rarely used (Smith et al., 2002; Aw et al.; 2008, Fors and Svenson, 2002). This is partly due to technical difficulties and data constraints. As emphasized by Ball (1963), simultaneous estimation techniques have advantages over the single estimation techniques. First of all, exogenous or predetermined variables which are used in the single equation model become unknown or endogenous variables with the simultaneous estimation. This results in a smaller bias compared to the single equation case. Nonetheless, as mentioned above, it is more cumbersome to implement.
Table 1: Selected studies that examine the simultaneous relation between R&D and export
Author Main Focus
Country of Interest
Time period
Number of
observations Database
Estimation
Method Dependent Variables
Hughes (1986) Exports and Innovation UK
1968-1975
46 manufacturing
industries UK R&D Data IV method
Export/gross output(1978), R&D/value added(1975)
Suh (1993)
Domestic Sales, Exports
and R&D Korea 1991 612
A survey conducted by Korea Industrial Technology Association
(KITA) Tobit
Domestic Sales, Exports, R&D Expenditures
Zhao and Li
(1997) R&D and Export China 1992 535 (1552)
China's Leading Companies which the survey conducted by State Statistical Bureau
of China
Logit & Simultaneous
Estimation
1. X(0,1) 2. Export Growth Rate,
R&D Spending/Sales, Profit/Total fund
Fors and
Svenson (2002) R&D and Foreign Sales Sweden
1986,
1990 201 MNEs
The data is collected by the Research Institute of Industrial Economics Simultaneous Tobit R&D/Sales& Foreign Sales/Sales Smith et
al.(2002) Role of R&D in Exports Denmark
1995,
1997 3424 Danish R&D statistics Bivariate Probit
1.X(0,1) 2.R&D(0,1)
Aw et al. (2005) & Aw et al.
(2007)
Export, R&D and
Productivity Taiwan
1986, 1991,1996
1779, 987, 649
A survey conducted by Statistical Bureau of Taiwan's Executive Yuan
1. Bivariate Probit 2. Simultaneous
3. Survival 4. Selection
1. X(0,1), R&D(0,1) 2. X/Sales, R&D/Sales
3. Survival 4. Productivity
Aw et al. (2008)
R&D, Export and
Productivity Taiwan
2000, 2002, 2003,
2004 7772
The data collected by Ministry of Economic
Affairs Probit, Tobit
The first simultaneous analysis of the relationship between exports and innovation is performed by Hughes (1986) who is also aware of the fact that this simultaneity is not tested before him (Hughes, 1986: 388). Based on a panel of 46 manufacturing industries in the UK, the author finds a simultaneous relationship and he defines the competitive position of UK with technology, skill and industry structure which are the main determinants of export composition in the UK.
Smith et al. (2002) stated that R&D is the most influential determinant on the export decision of the firm. The authors found that R&D and export are mutually dependent. Aw et al. (2008) found also significant interaction between export and the R&D decision for Taiwanese firms. Fors and Svenson (2002) use foreign sales instead of export values. The authors also support the hypothesis of a two-way relationship between the R&D and foreign sales for Sweden but multinationals enterprises only. Zhao and Li (1997) found the same evidence for China by using a three equations simultaneous model (export growth rate, R&D intensity and profit rates).
Suh (1993) ended up with different results than the ones reported in other studies (Smith et al., 2002; Zhao and Li, 1997; Fors and Svenson, 2002; Aw et al., 2008). The author found a negative and insignificant R&D elasticity of export meanwhile the export elasticity of R&D is negative and significant. The author explains this extreme situation by the behaviour of Korean firms which are more imitators than creators of new knowledge, i.e., firms tend to rely more on the technology in the foreign market which they enter instead of generating original technologies themselves.
This study is aiming to fill the gap in the literature on the simultaneous relation of R&D and export a cross countries. Among all the studies conducted to the knowledge of the authors, this study is the first one to cover more than one country and more importantly focusing on EU countries.
3. The model and the methodology
In this paper, two main hypotheses and a couple of sub-hypotheses will be tested. One of the main hypotheses is to test whether the decision of firms' to start/perform R&D and export are affected from each other.
H1: R&D and export decisions of a firm are dependent on each other.
The determinants of the propensity of performing R&D and exporting will be also analyzed. For this, R&D and export equations are estimated separately by a probit model. On the other hand, to test the main hypothesis both equations are estimated by a bivariate probit model.
To explore the propensity of firms to perform R&D and export, two separate probit models,
a binary response model which is based on a probit link function, is estimated4. The firm either
do R&D (RD=1) or not (RD=0) during the period over which the survey is conducted. This
decision is explained by a set of factors (X1'). The decision of the firm to export (EXP=1) or
not (EXP=0) during the period over which the survey is conducted depends on another set of
factors (X2') (Greene, 1997; Long, 1997).
Formally, the probit model for R&D is given by,
) ' ( ) 1
Pr(RD F X1
) ' ( 1 ) 0
Pr(RD F X1
) ' ( ) ( ) 1 Pr( 1 ' 1 X dt t RD X
And the probit model for export by,
) ' ( ) 1
Pr(EXP F X2
) ' ( 1 ) 0
Pr(EXP F X2
) ' ( ) ( ) 1 Pr( 2 ' 2 X dt t EXP X
where (.) and (.)are the standard normal distribution and PR indicates the probability. The
coefficients ( and) are typically estimated by maximum likelihood methods.
As opposed to the logit model, the probit model allows one to use more than one equation, with correlated disturbances which is very similar to seemingly unrelated regression (SUR) models. The general specification of a two-equation probit, specifically bivariate probit model is (Greene, 1997: 906),
1 1 1 * ' X
RD RD=1 if RD*>0, 0 otherwise
2 2 2 * ' X
EXP EXP=1 if EXP*>0, 0 otherwise
0 ) ( )
(1 E 2
E
1 ) ( )
(1 Var2
Var
, )
( 1 2
Cov
The bivariate probit is estimated by the maximum likelihood method, by maximizing the
log-likelihood function with respect to traditional parameters ( and ) and which is the
interaction term between the residuals (Greene, 1997).
The second main hypothesis is to test whether the volume of firms' R&D and export are related to each other. When the R&D level of a firm increases, does it also affect its level of exports? And conversely when export increases, does it affect the R&D of the firm. Considering export levels of firms' as an indicator for the competitiveness of the firm, the question might be asked as follows. Does more R&D will cause the firm more competitive? And as the competitiveness of the firm increases, does it increase the R&D level? Also a politically related question may be put forward. Are R&D oriented policies affecting export-oriented or competitiveness policies? Or is it the other way around?
The model for R&D is given by:
1 1 ' X RD 0 )
(1
E 2 1 1) ( Var
For export, we have:
0 )
(2
E
2 2 2)
(
Var
With the two single equation econometric models, the sub-hypothesis is tested. The second main hypothesis can be defined as follows.
H2: The volume of R&D and export of a firm directly are simultaneously determined.
To test this hypothesis, it is necessary to use a simultaneous estimation technique:
1 2
1
1' '
X EXP
RD
2 4
2
3' '
X RD
EXP
0 ) ( )
(1 E 2
E
2 1 1)
(
Var , Var(2)22, Cov(1,2)0
0 ) ' ( ) '
( 1 X1 E 2 X2
E
Zellner and Theil (1962) propose the Three Stages Least Squares (3SLS) estimator which
is asymptotically efficient5. Another condition necessary to meet the rank and order conditions
for the identification of the system of equations is required. This condition basically consists of some extra exogenous variables in the set of factors explaining the independent variables (
2 1 X
X ) to distinguish the equations.
2 1 X
X = Size of the firm, square of the size, skilled labor, age, foreign ownership, EU dummies, industry and services sectors dummies and outlier dummies
In the 3SLS estimation, to meet the identification of the system of equations, the set of
vector explaining the export behaviour (X2) is supplemented with the following variables:
22
X = Innovation and export volume of the previous year.
The dependent (endogenous) and the independent (exogenous) variables are identified in Table 2. The data set consists of micro aggregated data based on firms located in different industry and service sectors which have structurally different R&D and export levels. Therefore, the sectors are classified into eight groups according to their level of technology (EUROSTAT, 2015a; Eurostat, 2015b). To handle the outlier problem, outlier dummies have been constructed. As a rule of thumb, last 5 % of the observations are treated as outliers.
For the empirical analysis, the micro-aggregated Community Innovation Survey 3 (CIS3) is used. Mairesse and Mohnen (2001) checked the robustness of the estimates obtained by using micro-aggregated versus the original data and also differences between the two first waves of these surveys, i.e. CIS1 and CIS2. The main conclusion of their analysis is that a procedure is implemented to exclude outliers from the analysis; the econometric results based on the micro aggregated data are about the same to the ones obtained from the original data. When micro-aggregated data is used; significance and the sign of the coefficients are not affected meanwhile the coefficients are biased. In order to address these problems, we also implement in this study a 'cleaning' procedure to get rid of the outliers. Yet, from this database independent (exogenous) variables are constructed according to the literature.
Table 2: Definitions of the variables
Dependent Variables Value Definition
DRDSAL 0-1 1 if a firm reported R&D and 0 otherwise over the period of the survey. DXSAL 0-1 1 if a firm reported export and 0 otherwise over the period of the survey. LNRD # Logarithm of the nominal value of R&D expenditures over the period
of the survey.
LNX # Logarithm of the nominal value of export over the period of the survey.
Independent Variables Value Definition
LNSAL # The logarithm of sales, turnover volume of the firm in 2000, as a proxy for the size of the firm.
LNSAL2 # The square of logarithm of sales.
LNEMPHI # The logarithm of the high school graduated employees, as a proxy for the skilled labor
EST 0-1 1 if the firm was established in the last two years (1998-2000) and 0 otherwise.
FOROWN 0-1 1 if the firm is owned by a non-resident and 0 otherwise.
INN 0-1 1 if the firm is doing product or process innovation, and 0 otherwise. LNEXP98 # The logarithm of the nominal value of exports in 1998.
EU15 0-1 1 if the firm is registered in one of the EU countries which became a member state before 1990 and 0 otherwise.
EU25 0-1 1 if the firm is registered in one of EU countries which became a member state between 1990 and 2005, and 0 otherwise.
EU27 0-1 1 if the firm is registered in one of EU countries which became a member state after 2005 and 0 otherwise.
DLT 0-1 Low technology manufacturing industry firms. DMLT 0-1 Medium low technology manufacturing industry firms. DMHT 0-1 Medium high technology manufacturing industry firms. DHT 0-1 High technology manufacturing industry firms.
DLKIMS 0-1 Less knowledge intensive market service firms. DKIFS 0-1 Knowledge intensive financial service firms. DKIMS 0-1 Knowledge intensive market service firms.
DKIHTS 0-1 Knowledge intensive high technology service firms.
OLNRD95 0-1 1 if the micro aggregated LNRD of firm is above the 95 % percentile of this variable and 0 otherwise.
OLNX95 0-1 Binary variable taking the value of 1 if the micro aggregated LNX of firm is above the 95 % percentile of this variable 0 otherwise.
Source: Micro-Aggregated (Anonymized) CIS3 data (Eurostat, 2008)
Finally, the following equations will be estimated using the ad-hoc econometric method discussed in section 3.
Equation of R&D Decision (or Propensity):
1 1
0
X
EU
DSEC
OUTDRDSAL l l s s k k
Equation of Export Decision (or Propensity):
2 1
0
X
EU
DSEC
OUTDXSAL l l s s k k
Equation of R&D volume:
3 2
1
0
X LNX
EU
DSEC
OUTLNRD l l s s k k
Equation of Export volume:
4 3
22 2 1
0
X X LNRD
EU
DSEC
OUTwhere ) , , , 2 , ( 2
1 X f LNSAL LNSAL LNEMPHI EST FOROWN
X
X ;
) 98 ,
(
22 F INN LNX
X ;
) 27 , 25 , 15
(EU EU EU
f
EU ;
) , , , , , , ,
(DLT DMHT DMLT DHT DLKIMS DKIFS DKIMS DKIHTS f
DSEC ;
) 95 ,
95
(OLNRD OLNX
f
OUT .
4. Data
To test the hypotheses, the micro-aggregated (anonymized) Third Community Innovation
Survey (CIS 3) over the period6 is used for the econometric analysis. The data set covers 15
countries (Belgium, Bulgaria, Czech Republic, Estonia, Hungary, Germany, Greece, Iceland, Latvia, Lithuania, Norway, Portugal, Romania, Slovakia and Spain) from 39 sectors and in total 49681 observations. The distribution of the sample data is reported in Table 3.
In our study, the main focus is on EU countries. At the time the survey was performed, only 5 countries, namely Belgium, Germany, Greece, Portugal and Spain, were member states of the EU. Five out of thirteen countries are EU15 countries while six are EU25 countries. Island and Norway are still not EU members as of 2009. For the main analysis, data for thirteen EU countries are used.
Table 3: Distribution of the data sample by country
Abr. Before 1990 (EU15) Between 1990-2005 (EU25) After 2005 (EU27) Number of Observations Percentage (in %)
Belgium BE 1 1273 2.57
Bulgaria BG 1 10199 20.57
Czech CZ 1 3300 6.65
Estonia EE 1 2384 4.81
Germany DE 1 2906 5.86
Greece GR 1 1543 3.11
Hungary HU 1 951 1.92
Iceland IS 680 1.37
Latvia LV 1 1993 4.02
Lithuania LT 1 1863 3.76
Norway NO 3548 7.15
Portugal PT 1 1804 3.64
Romania RO 1 7479 15.08
Slovakia SK 1 1734 3.50
Spain ES 1 8024 16.18
Total 49681
Source: Micro-Aggregated (Anonymized) CIS3 data (Eurostat, 2008)
6 CIS3 data covers the period 1998-2000, with the exception of Norway where the reference year was 1999 - 2001. The Czech Republic, Hungary, Latvia, Lithuania and Slovakia had a reference period of 1999-2001 while Romania had a reference period 2000-2002. Slovenia had a two-year reference period 2001-2002 and Bulgaria a reference period of 2001-2003. For more details about the data, see:
Almost one fifth of the observations are coming from just one country, namely Bulgaria. Also 16% and 15% is coming from Spain and Romania, respectively. Observations from these three countries represent half of the sample. Sample selection bias is always a problem for this type of survey. To handle this problem, it is possible to use a weighted regression which gives more unbiased and efficient estimates especially for the survey data. In the sample, a weight constructed by Eurostat based on the shares between the numbers of firms or the number of employees is used.
Table 4: Distribution of data sample by sector7
Abbreviation NACE Number of
Observations Percentage
Manufacturing 27,045 65.17
Low Technology (1) LT (1) 15-22,36,37 14,663 35.33 Medium Low Technology (2) MLT (2) 23,25-28 6,179 14.89 Medium High Technology (3) MHT (3) 24,29,31,34,35 5,102 12.29 High Technology (4) HT (4) 30,32,33 1,101 2.65
Knowledge Based Services 14,455 34.83
Less Knowledge Intensive Market Services (5)
LKMS (5)
51,60 9,229 22.24
Knowledge Intensive Financial Services (6)
KIFS (6)
65-67 1,336 3.22
Knowledge Intensive Market Services (7)
KIMS (7)
61,62,74 1,901
4.58
Knowledge Intensive High Technology Services (8)
KIHTS (8)
64,72,73 1,989 4.79
41,500 Source: Micro-Aggregated (Anonymized) CIS3 data (Eurostat, 2008)
34 sectors out of 38 are used in the econometric analysis. As can be seen in Table 4, the distribution of sectors consists of: 23 manufacturing industries and 11 knowledge intensive services. 65.17% of the observations belong to the manufacturing industry and the rest comes from knowledge based services (KIBS). 35.33% and 22.24% of the observations of the full sample relate to low technology manufacturing industry and knowledge intensive market services, respectively.
In the sample 65.10% of the firms are performing R&D meanwhile 52.76 % of the firms are exporters. 35.71% of the firms are both R&D performer and exporter, 17.85% of the firms do not perform any of these activities.
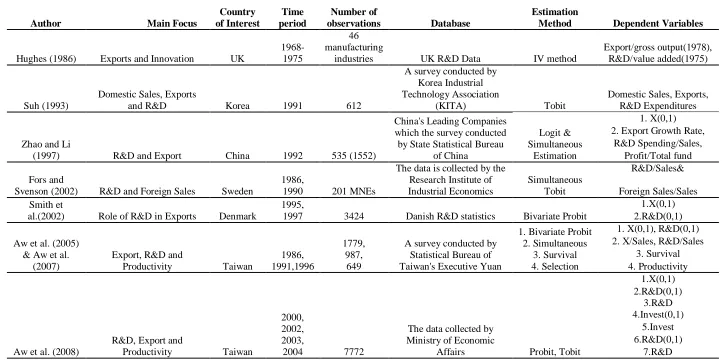
Figure 1: Scatter plot between LNRD and LNX
Source: Micro-Aggregated (Anonymized) CIS3 data (Eurostat, 2008)
The explicit relationship between volumes of R&D and export can be easily observed from Figure 1. Most of the firms are gathered around the centre and the figure exhibits that the relationship between the two variables is positive. The heteroscedastic structure is also visible. The variation for low levels of R&D and export is higher than that observed for high levels of R&D and export. Several outliers are also visible. For the cross-sectional data analysis, heteroscedasticity of the variables is a problem that needs to be addressed.
Figure 2: Scatter plot between LNRD and LNX by country
Source: Micro-Aggregated (Anonymized) CIS3 data (Eurostat, 2008)
0
5
10
15
20
ln
rd
0 5 10 15 20 25
lnx
0
5
10
15
20
0
5
10
15
20
0
5
10
15
20
0
5
10
15
20
0 10 20 30 0 10 20 30
0 10 20 30 0 10 20 30
BE BG CZ DE
EE ES GR HU
LT LV PT RO
SK Total
ln
rd
To check whether this relationship is also valid for each of the 13 EU countries and for each of the eight sectors, Figure 2 and Figure 3 are plotted. There are still differences between the countries and sectors but the direction of the relationship is still clearly positive. For Germany both the magnitude of R&D and export is higher compared to other countries. Particularly, in Greece both variables are characterised by very low volumes even less than the last two EU countries, Romania and Bulgaria. The elasticity between the R&D and export is higher in Germany, Spain and Belgium than other EU countries. Belgium and Hungary have more outliers than any other country.
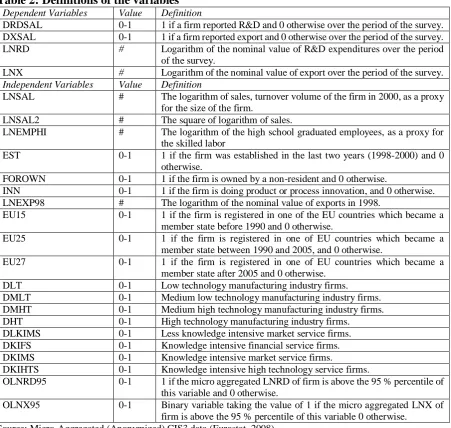
Figure 3: Scatterplot between LNRD and LNX by sector
Note: 1 = LT, 2 = MLT, 3 = MHT, 4 = HT, 5 = LKMS, 6 = KIFS, 7 = KIMS, 8 = KIHTS. Source: Micro-Aggregated (Anonymized) CIS3 data (Eurostat, 2008)
The relationship is more explicit at the sectoral level than at the country level. The first four figures present the relation in the manufacturing industry from low to high technology and the following four exhibits the relation in services sectors. It seems that at the sectoral level, the interaction between the R&D and export is elastic. Even in the knowledge intensive financial services (KIFS), with the limited data, the positive relation still holds.
Even if the positive relationship is apparent, this does not give any idea about the direction of the causality between the two variables, i.e. which one is affecting the other? From the figures, the only indication is that they are positively related, i.e. when one of them is higher, it can be expected that the other is also higher.
0
5
10
15
20
0
5
10
15
20
0
5
10
15
20
0 10 20 30 0 10 20 30 0 10 20 30
1 2 3
4 5 6
7 8 Total
ln
rd
lnx
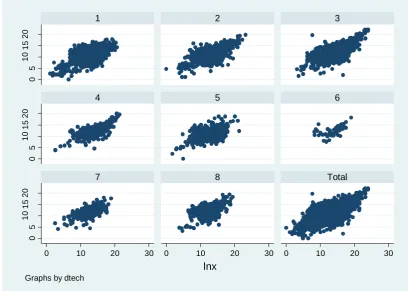
Figure 4: Mean of LNRD, LNX, DRDSAL and DXSAL by country
Source: Micro-Aggregated (Anonymized) CIS3 data (Eurostat, 2008)
The Figure 4 illustrates both the volume (on the left side figures) and the decision (on the left side figure) of R&D and exports. The upper and lower part of the figure exhibits the behaviour of R&D and export, respectively. Germany is not only the single country with the highest average R&D level but this country also exhibits the higher number of R&D performer, i.e. 62 % of the firms are performing R&D investments. Germany is followed by Belgium and Spain in R&D spending which are followed yet again by Belgium and Portugal. Greece is far behind in average R&D spending and Bulgaria is the last in R&D performance. In terms of export performance, Greece has the lowest average export level as R&D spending. The countries with high average R&D levels also turn out to be the ones with high average export levels, particularly Germany, Belgium and Spain.
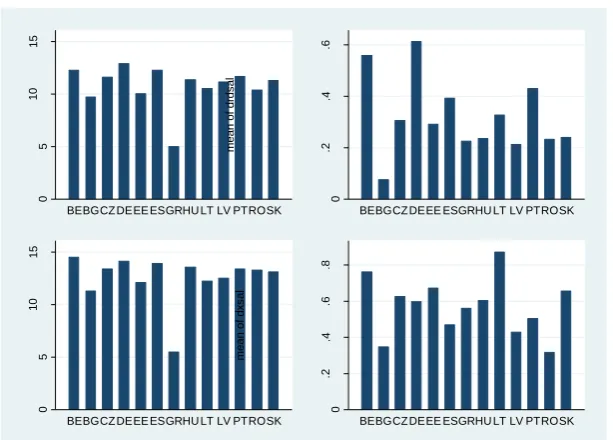
Figure 5: Mean of LNRD, LNX, DRDSAL and DXSAL by sector
Note: 1 = LT, 2 = MLT, 3 = MHT, 4 = HT, 5 = LKMS, 6 = KIFS, 7 = KIMS, 8 = KIHTS. Source: Micro-Aggregated (Anonymized) CIS3 data (Eurostat, 2008)
0 5 10 15 me a n o f ln rd
BEBGCZ DEEE ESGRHU LT LV PTROSK
0 .2 .4 .6 me a n o f d rd s a l
BEBGCZ DEEE ESGRHU LT LV PTROSK
0 5 10 15 me a n o f ln x
BEBGCZ DEEE ESGRHU LT LV PTROSK
0 .2 .4 .6 .8 me a n o f d x s a l
BEBGCZ DEEE ESGRHU LT LV PTROSK
0 5 10 15 me a n o f ln rd
1 2 3 4 5 6 7 8
0 .1 .2 .3 .4 .5 me a n o f d rd s a l
1 2 3 4 5 6 7 8
0 5 10 15 me a n o f ln x
1 2 3 4 5 6 7 8
0 .2 .4 .6 .8 me a n o f d x s a l
In the manufacturing industry, average R&D investments gradually increase from low to high technology sectors. This fact is even more apparent in terms of R&D performance. In the services, the difference between the less and high knowledge intensive sectors (5 and 8) is higher in terms of R&D performing. In the export performance, the medium high technology (MHT) sector has a slight advantage over the others. Due to the structure of the services sector, the exporters are lower when compared to manufacturing sectors although their average export is really high. The average R&D investments in KIFS and KIHTS are almost as high as the MHT and HT sectors. Both high technology sectors in manufacturing and services are the highest R&D performers. The highest average R&D investment is in KIFS. It is followed by the two high technology industries, HT and KIHTS.
Table 5: R&D Intensity by Export Intensity
R&D Intensity
Mean Std. dev. Number of Observations
Export/Sales=0 0.040 0.381 11331
0<Export/Sales<0.188 0.038 0.192 6338
Export/Sales≥0.188 0.048 0.482 9505
Export/Sales>=0 0.042 0.388 27177
Source: Micro-Aggregated (Anonymized) CIS3 data (Eurostat, 2008)
The threshold value of 0.188 is the average export intensity of all firms. In the literature two reported threshold levels are 0.1487 (Suh, 1993) and 0.1458 (Zhao and Li, 1997). Zhao and Li (1997) found positive relationship between the R&D intensity and export intensity which is not the case of Suh (1993). In our sample, the relationship is ambiguous since the exporting firms which are less than the threshold export intensity have a smaller R&D intensity than the non-exporters although the exporting firms which are higher than the threshold export intensity have higher R&D intensity than the exporting firms which are less than the threshold export intensity.
5. Estimation Results
Single and simultaneous estimation results are presented in Tables 6 and 7, where the first two regressions in both tables are the single equation estimations for R&D investments and export levels while the third regression presents the simultaneous estimation results. For the single equations, OLS and Probit are implemented while for the simultaneous equations, 3SLS and bivariate probit are applied.
EU15 countries have an advantage over both volume and decision of R&D investments. For export volume, EU27 countries have better benefit than the EU25 and EU15 countries although for the decision to export, EU25 countries has more advantage
In terms of sectors, the propensity to do R&D investments is higher in all manufacturing industry sectors and KIHTS meanwhile manufacturing industry sectors, especially MHT and HT, has advantage in propensity to export. The sectors with high probability to conduct R&D also have higher average R&D investments while, MHT and KIMS have higher average exports levels than the other sectors.
Being a newly established firm, with a maximum age of two years affects export, it is interesting to note that the effect of this variable differs between the volume and the decision to export. The new firms are less likely to decide to export but if they do, their volume is higher than the average. A simple explanation for this may be that the decision to export may be made right when the firm is being established.
Table 6: Robust estimation results of Probit and Bivariate Probit estimators
(1) (2) (3) (4)
VARIABLES DRDSAL DXSAL DRDSAL DXSAL
LNSAL 0.17*** 0.60*** 0.17*** 0.59***
-0.05 -0.04 -0.05 -0.05
LNSAL2 -0.00** -0.02*** -0.00** -0.02***
0.00 0.00 0.00 0.00
LNEMPHI 0.23*** 0.09*** 0.22*** 0.12***
-0.01 -0.01 -0.01 -0.01
EST -0.01 -0.04 -0.01 -0.116*
-0.06 -0.05 -0.06 -0.07
FOROWN 0.11*** 0.11*** 0.13*** 0.09***
-0.03 -0.03 -0.03 -0.03
EU25 -0.52*** 0.77** -0.50*** 0.65***
-0.03 -0.03 -0.03 -0.03
EU27 -0.88*** -0.39*** -0.86*** -0.84***
-0.03 -0.03 -0.03 -0.03
DMLT 0.19*** -0.03 0.17*** 0.03
-0.03 -0.03 -0.03 -0.03
DMHT 0.38*** 0.21*** 0.37*** 0.25***
-0.03 -0.03 -0.03 -0.04
DHT 0.57*** 0.15*** 0.58*** 0.17**
-0.06 -0.06 -0.06 -0.07
DLKIMS -0.34*** -0.68*** -0.38*** -0.75***
-0.03 -0.02 -0.03 -0.03
DKIFS -0.27*** -2.30*** -0.33*** -2.32***
-0.05 -0.07 -0.06 -0.08
DKIMS -0.19*** -0.92*** -0.21*** -0.94***
-0.05 -0.04 -0.05 -0.05
DKIHTS 0.13*** -0.90*** 0.12** -0.88***
-0.05 -0.04 -0.05 -0.05
OLNRD95 7.75*** 0.08
-0.06 -0.05
OLNX95 -0.32*** 7.85***
-0.04 -0.06
Constant -1.87*** -5.35*** -1.86*** -4.93***
-0.40 -0.33 -0.40 -0.42
athrho 0.15***
-0.01
Observations 19,103 26,964 19,693 19,693
Note: Robust standard errors in parentheses, *** p<0.01, ** p<0.05, * p<0.1 Estimated by using micro-aggregated (anonymized) CIS3 data (Eurostat, 2008).
R&D and to export but not on the volume of these variables. Hence, having skilled employees inspire the propensity to conduct R&D and to export although the level of skilled employees does not seem to play any particular role in the decision of how much to invest and export.
Table 7: Weighted and robust estimation results of OLS and 3SLS estimators
(1) (2) (3)
VARIABLES LNRD LNX LNRD LNX
LNSAL 1.55*** 0.29* 1.64*** 0.35***
-0.19 -0.15 -0.09 -0.07
LNSAL2 -0.03*** 0.00 -0.03*** 0.00
-0.01 -0.01 0.00 0.00
LNEMPHI 0.03 -0.03 0.04** -0.02
-0.04 -0.03 -0.02 -0.01
EST 0.06 0.43* 0.11 0.43***
-0.23 -0.25 -0.12 -0.09
FOROWN -0.44*** 0.12* -0.43*** 0.09***
-0.09 -0.07 -0.04 -0.03
EU25 -0.17** 0.18*** -0.18*** 0.17***
-0.07 -0.06 -0.06 -0.05
EU27 -0.46*** 0.28*** -0.52*** 0.26***
-0.09 -0.08 -0.13 -0.09
DMLT 0.15 0.00 0.14** 0.01
-0.10 -0.12 -0.06 -0.04
DMHT 0.29*** 0.22** 0.29*** 0.23***
-0.10 -0.10 -0.06 -0.04
DHT 0.71*** 0.08 0.77*** 0.13*
-0.14 -0.12 -0.09 -0.07
DLKIMS -0.57*** -0.19* -0.50*** -0.21***
-0.15 -0.11 -0.06 -0.05
DKIFS -0.63* -0.12 -0.67** -0.16
-0.36 -0.15 -0.29 -0.21
DKIMS 0.28 0.83*** 0.23*** 0.84***
-0.24 -0.27 -0.08 -0.06
DKIHTS 0.86*** 0.05 0.84*** 0.10
-0.17 -0.15 -0.09 -0.07
INN 0.04 0.08
-0.14 -0.05
LNX98 0.72*** 0.73***
-0.03 -0.01
OLNRD95 2.68*** 2.67***
-0.12 -0.07
OLNX95 0.63*** 0.51***
-0.13 -0.09
LNRD 0.07*** 0.02
-0.02 -0.02
LNX 0.17*** 0.20***
-0.02 -0.01
Constant -8.85*** -1.01 -9.71*** -1.28**
-1.37 -1.05 -0.65 -0.56
Observations 6,398 5,945 5,945 5,945
R-squared 0.97 0.96 0.97 0.96
The effect of foreign ownership is positive for both the decision to engage in R&D and to export, i.e. foreign owned firms are more willing to do R&D and to export. On the other hand, firms that are owned by foreigners have a higher export volume although they have a lower R&D volume. This might be an indicator of R&D internationalization. Most probably, foreign-owned firms prefer to perform R&D their home country (Cincera et al., 2014).
The second main hypothesis of the paper is to understand whether the magnitude of R&D investments and exports are directly affected by each other. In single estimation of R&D and export equations, it appears that they are influenced by each other. Actually in simultaneous estimation, unexpectedly R&D elasticity of export is insignificant. The export elasticity of R&D is 0.174 and 0.195 in the single and simultaneous estimations, respectively. Meanwhile, the R&D elasticity of export is 0.0737 and significant for single equation; 0.0239 and insignificant for simultaneous equation. In the simultaneous estimation, compared to the single estimation, the effect of exports on R&D is higher while the effect of R&D on exports is lower. The reason behind the insignificance of R&D elasticity of exports is due to the sectoral combination. When the equations are estimated separately for manufacturing and service sectors, the underlying mechanism of R&D and export will be clearer.
Zhao and Li (1997) find the R&D elasticity of exports to be 0.112 and export elasticity of R&D as 0.182 for China. Although the authors used a three-equation model, specifically export, R&D and profitability, the hypothesis about the higher effect of R&D on export is prominent.
As a third hypothesis, it can be constructed to understand whether this relationship is valid for manufacturing and knowledge intensive services. It is estimated separately for each sector. In Table A.1 and A.2 in appendix, it is estimated for manufacturing industry and in Table A.3 and A.4 in appendix for knowledge intensive services.
In the manufacturing industry, the decision of the R&D investments and exports are mutually dependent on each other. All the elasticities are significant and higher when compared to the full sample estimation. In manufacturing industry, they are more dependent on each other.
In the knowledge intensive services, the decisions are mutually dependent. Different from the manufacturing industry, the investment level of R&D has no influence on the level of exports. The export elasticity of R&D is lower than the full sample elasticities.
In both industries, knowledge spillovers are observed, i.e. export is affecting the R&D investments. In manufacturing industry, the firms utilize the R&D investments to gain competitiveness, i.e. to increase exports. In the knowledge intensive sectors, the level of R&D does not influence the level of exports.
For further analysis, it would be interesting to analyze the determinants of competitiveness in the knowledge intensive services. The behavior of elements in that sector is different than that in the manufacturing industry. Moreover, the analysis would be replicated for the new CIS
data sets.
6. Conclusion
Competitiveness is an important policy objective. Most of the countries are aiming to increase their R&D expenditures to achieve a competitive edge over others. Export is one of the indicators of competitiveness. Export is also an important channel of technology spillovers. R&D and export affect each other. In this study, the aim is to uncover this relationship.
is true for manufacturing industry only. R&D and export link is broken in the knowledge intensive sectors in which R&D is not affecting the competitiveness, i.e. export volumes. The structural character of the manufacturing and service sector is totally different from each other. Exporting ability of the firms in the knowledge intensive sectors is more limited than those in the manufacturing.
Two out of thirty two of policy areas of the EU are external trade and research and innovation (European Union, 2010). External trade and research and innovation are the two major EU policy areas that are usually treated independently. But the main question arises whether these policies are affecting each other or not. According to this study, both the decision and amount of R&D and export at firm level are found to be mutually dependent. For the sector specific policies, in the manufacturing industry, R&D and export are related, i.e. R&D or export oriented policies will affect each other.
Acknowledgement
This study was a project when the authors were working in Institute for Prospective Technological Studies (IPTS) as a researcher. The authors are thankful to the members of both the Knowledge for Growth unit (KfG) and Industrial Research and Innovation (IRI) team which works under KfG unit in IPTS.
References
Aw, B.Y., M.J. Roberts and T. Winston, (2005), The Complementary Role of Exports and R&D Investments as Sources of Productivity Growth, NBER Working Paper Series, WP 11774, Available at: http://www.nber.org/papers/w11774
Aw, B.Y., M.J. Roberts and T. Winston, (2007), Export Market Participation, Investments in R&D and Worker Training, and the Evolution of Firm Productivity, The World
Economy, 83-104. doi:10.1111/j.1467-9701.2007.00873.x
Aw, B.Y., M.J. Roberts and D.Y. Xu, (2008), R&D Investments, Exporting, and the
Evolution of Firm Productivity, American Economic Review: Papers& Proceedings,
98:2, 451-456. doi:10.1257/aer.98.2.451
Ball, R.J., (1963), The Significance of Simultaneous Methods of Parameter Estimation in Econometric Models, Journal of the Royal Statistical Society. Series C (Applied
Statistics), Vol. 12, No. 1, 14-25. doi:10.2307/2985907
Barrios, S, H, GORG AND E. STROBL, (2003), Explaining Firms' Export Behaviour: R&D Spillovers and the Destination Market, Oxford Bulletin of Economics and Statistics,
65, 4, 475-496. doi:10.1111/1468-0084.t01-1-00058
Bernard, A.B. and J.B. Jensen, (2004), Why Some Firms Export, The Review of Economics
and Statistics, May 2004, 86(2), 561-569. doi:10.1162/003465304323031111
Cincera, M., C. Cozza and A. Tübke, (2014), Main drivers for local and global R&D sourcing of European Multinational Enterprises, Eurasian Business Review, 4(2), 227-245.
Coe, D. T. and E. Helpman, (1995), International R&D Spillovers, European Economic
Review, 39, 859-887. doi:10.1016/0014-2921(94)00100-E
Durand M., J. Simon and C. Webb, (1992), OECD's Indicators of International Trade and Competitiveness, OECD Economics Department Working Paper No.120, Avaliable at: http://www1.eeg.uminho.pt/economia/priscila/intocaveis/LEA_CI/M00007153.pdf
EUROPEAN UNION, 2010, Topics of European Union, http://europa.eu/pol/index_en.htm, Access data: July 2010.
EUROSTAT, 2008, Anonymized Community Innovation Survey 3 (CIS3), Cd-Rom.
EUROSTAT, 2015a, Glossary: High-Tech Classification of Manufaturing Industries, http://ec.europa.eu/eurostat/statistics-explained/index.php/Glossary:High-tech_classification_of_manufacturing_industries, Access date: January 2015.
EUROSTAT, 2015b, Glossary: Knowledge Intensive Services (KIS),
http://ec.europa.eu/eurostat/statistics-explained/index.php/Glossary:Knowledge-intensive_services_(KIS), Access date: January 2015.
Fors, G. and R. Svenson, (2002), R&D and Foreign Sales in Swedish Multinationals: A
Simultaneous Relationship?, Research Policy, 31, 95-107.
doi:10.1016/S0048-7333(01)00105-6
Greene, W. H., (1997), Econometric Analysis, third edition, Prentice-Hall, Inc.
Gustavsson, P. and A. Poldahl, (2003), Determinants of Firm R&D: Evidence from Swedish Firm Level Data, FIEF Working Paper 178, October 2003.
Hughes, K.S., (1986), Exports and Innovation: A Simultaneous Model, European Economic
Review, 30, 383-399. doi:10.1016/0014-2921(86)90050-4
Keller, W., (1998), Are International R&D spillovers trade-related? Analyzing spillovers Among Randomly Matched Trade Partners, European Economic Review, 42,
1469-1481. doi:10.1016/S0014-2921(97)00092-5
Kleinknecht, A. and T. P. Ploot, (1992), Do Regions Matter for R&D, Regional Studies, 26:3,
221-232. doi:10.1080/00343409212331346921
Long, J. S., (1997), Regression Models for Categorical and Limited Dependent Variables, SAGE Publications, Inc.
Mairesse, J. and P. Mohnen, (2001), To Be or Not To Be Innovative: An Exercise in Measurement, NBER Working Paper No. W8644. Available at SSRN: http://ssrn.com/abstract=294083
Rodriguez, J. L. and R. M. G. Rodriguez, (2005), Technology and Export Behaviour: A Resource-Based View Approach, International Business Review, 14, 539-557.
doi:10.1016/j.ibusrev.2005.07.002
Roper, S. and J. H. Love, (2002), Innovation and Export Performance: Evidence from the UK and German Manufacturing Plants, Research Policy, 31, 1087-1102.
doi:10.1016/S0048-7333(01)00175-5
Schmidt, P., (1976), Econometrics, New York, Marcel Dekker.
Schumpeter, J. A., (1942), Capitalism, Socialism, and Democracy, New York: Harper and Brothers.
Sjoholm, F., (2003), Which Indonesian Firms Export? The Importance of Foreign Networks,
Papers in Regional Science, 82, 333-350. doi:10.1007/s10110-003-0163-1
Smith, V., E.S. Madsen and M. Dilling-Hansen, (2002), Export Performance and Investment in R&D, The Danish Institute for Studies in Research and Research Policies, WP 2002/4.
Suh, J., (1993), A Simultaneous Equation Tobit Analysis of Research and Development in Korean Manufacturing Firms, Journal of Economic Development, 18 (2), 127-149.
Wakelin, K., (1998), Innovation and Export Behaviour at the Firm Level, Research Policy,
26, 829-841. doi:10.1016/S0048-7333(97)00051-6
Wei, Y. and X. Liu, (2006), Productivity Spillovers from R&D, Exports and FDI in China's Manufacturing Sector, Journal of International Business Studies, 37(4), 544-557.
doi:10.1057/palgrave.jibs.8400209
Zellner, A. and H. Theil, (1962), "Three Stage Least Squares: Simultaneous Estimation of
Simultaneous Equations", Econometrica, 30, 63-68. doi:10.2307/1911287
Zhao, H. and H. Li, (1997), R&D and Export: An Empirical Analysis of Chinese
Manufacturing Firms, The Journal of High Technology Management Research, 8(1),
Appendix:
Table A.1: Robust estimation results of Probit and Bivariate Probit estimators for manufacturing industry
(1) (2) (3)
VARIABLES DRDSAL DXSAL DRDSAL DXSAL
LNSAL 0.14* 0.33*** 0.14* 0.36***
-0.08 -0.07 -0.08 -0.09
LNSAL2 0.00 0.00 0.00 0.00
0.00 0.00 0.00 0.00
LNEMPHI 0.23*** 0.05*** 0.22*** 0.09***
-0.01 -0.01 -0.01 -0.02
EST -0.05 -0.03 -0.04 -0.169**
-0.07 -0.07 -0.07 -0.08
FOROWN 0.08** -0.02 0.10*** -0.06
-0.03 -0.03 -0.03 -0.04 EU25 -0.502*** 0.77*** -0.474*** 0.62***
-0.03 -0.04 -0.04 -0.04 EU27 -0.83*** -0.22*** -0.79*** -0.66***
-0.04 -0.03 -0.04 -0.04
DMLT 0.20*** -0.02 0.18*** 0.04
-0.03 -0.03 -0.03 -0.03
DMHT 0.38*** 0.21*** 0.37*** 0.24***
-0.03 -0.03 -0.03 -0.04 DHT 0.58*** 0.18*** 0.58*** 0.21***
-0.06 -0.06 -0.06 -0.07
OLNRD95 7.67*** 0.06
-0.05 -0.07
OLNX95 -0.31*** 7.47***
-0.05 -0.04
athrho 0.15***
-0.02
Constant -1.78*** -3.87*** -1.83*** -3.92*** -0.56 -0.48 -0.57 -0.65
Observations 12,760 17,143 13,076 13,076 Note: Robust standard errors in parentheses, *** p<0.01, ** p<0.05, * p<0.1
Table A.2: Weighted and robust estimation results of OLS and 3SLS estimators for manufacturing industry
(1) (2) (3)
VARIABLES LNRD LNX LNRD LNX
LNSAL 1.23*** 0.10 1.29*** 0.09
-0.16 -0.13 -0.10 -0.07
LNSAL2 -0.02*** 0.00 -0.02*** 0.00
-0.01 0.00 0.00 0.00
LNEMPHI -0.04 -0.01 -0.02 -0.01
-0.03 -0.03 -0.02 -0.01
EST 0.07 0.29 0.06 0.30***
-0.27 -0.30 -0.13 -0.08
FOROWN -0.37*** 0.08 -0.37*** 0.07**
-0.09 -0.07 -0.05 -0.03
EU25 -0.20** 0.23*** -0.20*** 0.28***
-0.08 -0.06 -0.07 -0.05
EU27 -0.46*** 0.24*** -0.52*** 0.28***
-0.09 -0.08 -0.12 -0.08
DMLT 0.15 -0.02 0.155*** -0.02
-0.11 -0.12 -0.05 -0.04
DMHT 0.30*** 0.13 0.31*** 0.14***
-0.10 -0.11 -0.05 -0.04
DHT 0.76*** 0.02 0.84*** 0.04
-0.14 -0.12 -0.08 -0.06
OLNRD95 2.58*** 2.51***
-0.10 -0.08
OLNX95 0.42*** 0.29***
-0.13 -0.08
INN 0.07 0.10*
-0.09 -0.05
LNX98 0.80*** 0.81***
-0.04 -0.01
LNRD 0.09*** 0.07***
-0.02 -0.02
LNX 0.23*** 0.25***
-0.02 -0.01
Constant -6.83*** -0.21 -7.49*** -0.07
-1.16 -0.99 -0.73 -0.54
Observations 5,104 4,807 4,807 4,807
R-squared 0.97 0.97 0.97 0.97
Table A.3: Robust estimation results of Probit and Bivariate Probit estimators for knowledge based services
(1) (2) (3)
VARIABLES DRDSAL DXSAL DRDSAL DXSAL
LNSAL 0.14* 0.70*** 0.14* 0.48***
-0.07 -0.08 -0.07 -0.09
LNSAL2 0.00 -0.02*** 0.00 -0.02***
0.00 0.00 0.00 0.00
LNEMPHI 0.22*** 0.12*** 0.21*** 0.14***
-0.02 -0.01 -0.02 -0.02
EST 0.05 -0.05 0.03 -0.04
-0.09 -0.08 -0.09 -0.10
FOROWN 0.14*** 0.20*** 0.14*** 0.21***
-0.04 -0.04 -0.04 -0.04
EU25 -0.56*** 0.73*** -0.58*** 0.62***
-0.04 -0.04 -0.05 -0.05
EU27 -1.00*** -0.64*** -1.00*** -1.22***
-0.06 -0.04 -0.06 -0.06
DKIFS 0.09 -1.62*** 0.06 -1.56***
-0.06 -0.07 -0.06 -0.08
DKIMS 0.13** -0.39*** 0.12** -0.36***
-0.06 -0.05 -0.06 -0.06
DKIHTS 0.47*** -0.34*** 0.48*** -0.24***
-0.05 -0.05 -0.05 -0.06
OLNRD95 7.82*** 0.11
-0.08 -0.08
OLNX95 -0.45*** 8.21***
-0.14 -0.08 Constant -1.72*** -6.17*** -1.67*** -4.10***
-0.57 -0.60 -0.58 -0.68
athrho 0.14***
-0.03
Observations 6,343 9,821 6,617 6,617
Table A.4: Robust estimation results of OLS and 3SLS estimators for knowledge based services
(1) (2) (3)
VARIABLES LNRD LNX LNRD LNX
LNSAL 1.21** 1.07*** 0.61** 1.08***
-0.55 -0.39 -0.30 -0.24
LNSAL2 -0.02 -0.02* -0.01 -0.02***
-0.02 -0.01 -0.01 -0.01
LNEMPHI 0.20** -0.04 0.283*** -0.02
-0.09 -0.07 -0.04 -0.04
EST -0.03 0.81*** 0.41 0.81***
-0.46 -0.20 -0.28 -0.23
FOROWN -0.48*** 0.01 -0.42*** -0.01
-0.18 -0.15 -0.09 -0.08
EU25 -0.36* 0.07 -0.63*** 0.04
-0.19 -0.15 -0.16 -0.13
EU27 -0.50 0.37 -0.83* 0.33
-0.30 -0.34 -0.49 -0.41
DKIFS 0.00 0.43** -0.16 0.41
-0.43 -0.21 -0.37 -0.30
DKIMS 0.49 1.03*** 0.18 1.03***
-0.31 -0.25 -0.13 -0.10
DKIHTS 1.03*** 0.39 0.67*** 0.41***
-0.26 -0.20 -0.13 -0.11
OLNRD95 2.67*** 2.67***
-0.20 -0.14
OLNX95 0.92*** 0.90**
-0.18 -0.41
INN 0.13 0.21*
-0.26 -0.12
LNX98 0.63*** 0.63***
-0.04 -0.01
LNRD -0.01 -0.05
-0.05 -0.04
LNX 0.09** 0.14***
-0.04 -0.02
Constant -4.72 -6.11** 0.74 -6.12***
-4.55 -3.11 -2.47 -1.98
Observations 1,294 1,138 1,138 1,138
R-squared 0.57 0.82 0.54 0.82