Study On Electrostatic Extrusion Method For Synthesizing Calcium
Alginate Encapsulated Iron Oxide
Ken Giap Low
1and Soh Fong Lim
2 1,2Universiti Malaysia Sarawak, Kota Samarahan, Malaysia.
1
Email: [email protected],
2Email: [email protected]
Abstract
Electrostatic extrusion method is used to produce polymer beads by dripping polymer mixtures into hardening solution using syringing system with electrostatic charges. Through this method, iron oxide particles can be encapsulated into calcium alginate polymer beads. The changes in characteristics of the produced bead can be observed through changing the physical parameter values of applied voltage, height of electrodes, flow rate, and needle sizes of the system. From experimental study using Response Surface Methodology (RSM) modeling, the diameter of produced beads significantly decreases when applied voltage increases and needle size decreases. The optimum parameters from RSM is determined as 4kV applied voltage, 2cm of electrodes height and 0.4mm of needle diameter while flow rate does not contribute significant effect on the system. Furthermore, instrumental and analytical studies are carried out to characterize the produced bead based on the bead sizes, sphericity, surface area and surface morphology. Other than that, a mathematical model is developed from basic equations related to the system on production of calcium alginate encapsulated iron oxide. The model is then improvised and validated via experiment and it shows good agreement with the experiment result where error of the models is 0.4% for bead diameter and 2.5% for bead sphericity.
Keywords: polymer beads, RSM, electrostatic extrusion, encapsulation, modeling and simulation
1. Introduction
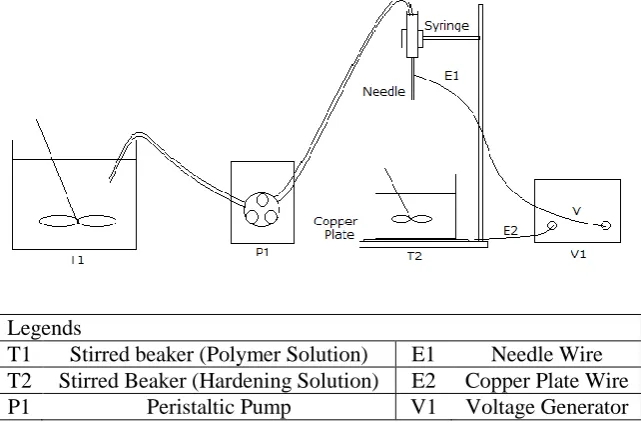
Electrostatic extrusion method is one of the methods to fabricate encapsulated multifunctional components such as adsorbent for water and waste water treatment [1]-[3]. Droplet extrusion allows the encapsulation of components into polymer beads, producing multicomponent beads. By applying electrostatic forces on to the droplet extrusion needle, the extrusion performance can be increased [3]-[4]. An electrostatic extrusion system is a system with needle setup and applied with electrostatic charge as in Figure 1 [3]-[5]. In this study, sodium alginate and iron oxide mixture as polymer liquid is dripped through the needle with applied electrostatic charge into the hardening solutions, calcium chloride. Voltage difference is applied between the needle and electrode plate beneath the hardening solution to create electrostatic forces during the dripping process.
of electrostatic extrusion system and the characteristics of calcium alginate encapsulated iron oxide beads, a suitable model of the extrusion system is required in order to further study and optimize the fabrication of polymer beads and its performances.
Figure 1. Schematic diagram on electrostatic droplet extrusion.
One of the objectives in this study is to perform experimental study using Response Surface Methodology (RSM) modeling to obtain experimental model as well as optimum operating parameters for bead extrusion, and the produced beads are then characterized via instrumental and analytical studies. Another objective is to develop a mathematical model of electrostatic extrusion system using the relation of physical parameters involved in the system to the characteristics of the produced beads, and the developed mathematical models are then validated via experiment.
2. Experiment and Method
2.1. Material Preparation
Raw materials used are iron (III) chloride (FeCl3) (≥97% purity, Sigma-Aldrich, France), sodium hydroxide (NaOH) (Sigma-Aldrich, France), sodium alginate (C5H7O4COONa) (≥99.9% purity, Aldrich, U.S.A), calcium chloride dihydrate (CaCl2.2H2O) (≥99.9% purity, Merck, Germany) and distilled water.
Iron oxides particles are prepared using hydrolysis method from FeCl3[10]. 100ml of 1M FeCl3 is mixed with 180ml of 5M NaOH in a 2L beaker with stirring rate of 750rpm on magnetic stirrer (MS300HS, Favorit, Korea). The mixture is then immediately diluted to 2L with distilled water. Then, the beaker is covered using aluminium foil and heated with 70oC inside incubator oven (KB240, Binder, U.S.A) for 60 hours. The mixtures are then filtered using filter paper and washed with distilled water until the filtrate reached pH 7. The iron oxide residues on the filter paper are dried in oven at 70oC for 24 hours and collected in powder form. The steps are repeated until approximately 50 grams of iron oxides are produced.
separate iron oxide particles in the polymer solution. CaCl2 hardening solution is prepared by dissolving 5.50g of CaCl2 into 100ml of distilled water and stirred using magnetic stirrer for one hour.
2.2. Apparatus Setup
The setup is as shown in Figure 2. T1 is 1L beaker setup with a stainless steel agitator stirrer (RW 20, Fisher Scientific, UK). An end of a rubber pipe is placed into T1 and another end is connected to the syringe setup (20ml Syringe, Terumo, USA) with needle installed (18G/20G/22G, Terumo, USA). A peristaltic pump, P1 (BT300-2J, Longer Pump, China) is setup on the rubber pipe near to T1. T2 is a beaker setup with magnetic stirrer and a 5cm×5cm×1mm standard copper plate placed beneath the beaker. Standard wires E1 and E2 are connected to needle and copper plate to a high voltage generator (6K3M, Witeg, Germany). E1 is connected to positive voltage pole of the voltage generator while E2 is connected to the negative voltage pole supply of the voltage generator.
Legends
T1 Stirred beaker (Polymer Solution) E1 Needle Wire T2 Stirred Beaker (Hardening Solution) E2 Copper Plate Wire P1 Peristaltic Pump V1 Voltage Generator
Figure 2. Schematic Apparatus Set Up for Electrostatic Extrusion.
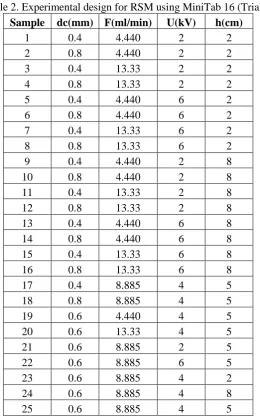
2.3. Design of Experiment
The number of sets of the experiment is determined via second order RSM equation as in (1) and RSM analytical function in MiniTab 16 (Trial). The code level setup of the experiment is tabulated as in Table 1, and the numbers of sets are tabulated as in Table 2.
(1)
Table 1. Uncoded matrixes of design parameters
Code level -1 0 1
Needle Size (I.D.), dc (mm) 0.4 0.6 0.8 Height of electrode, h (cm) 2 5 8
Voltage applied, U (kV) 2 4 6
Table 2. Experimental design for RSM using MiniTab 16 (Trial)
Sample dc(mm) F(ml/min) U(kV) h(cm)
1 0.4 4.440 2 2
2 0.8 4.440 2 2
3 0.4 13.33 2 2
4 0.8 13.33 2 2
5 0.4 4.440 6 2
6 0.8 4.440 6 2
7 0.4 13.33 6 2
8 0.8 13.33 6 2
9 0.4 4.440 2 8
10 0.8 4.440 2 8
11 0.4 13.33 2 8
12 0.8 13.33 2 8
13 0.4 4.440 6 8
14 0.8 4.440 6 8
15 0.4 13.33 6 8
16 0.8 13.33 6 8
17 0.4 8.885 4 5
18 0.8 8.885 4 5
19 0.6 4.440 4 5
20 0.6 13.33 4 5
21 0.6 8.885 2 5
22 0.6 8.885 6 5
23 0.6 8.885 4 2
24 0.6 8.885 4 8
25 0.6 8.885 4 5
2.4. Experiment Method
Polymer mixture is placed in T1 and stirred constantly to ensure even distribution. The CaCl2 solution is placed in T2 and also under constant stirring. The apparatus is set up as shown in Figure 2, and the physical set up parameters are according to design parameter from Table 1 and 2.
For each experiment, the polymer mixture is dripped through the needle using peristaltic pump P1. The pipe end at T1 is ensured to be immersed into the solution to prevent air inlet and affect extrusion performances. The dripping droplets from the needle end are to be dripped into the vortex of the stirring solution in T2 to ensure droplet shapes are maintained. The height of the needle has to be double checked to avoid immersion of needle into solution in T2.
Sp ericity, ( i- n mina )
( n mina N) (2)
(√
)
-(3)
Figure 3. Spheroid (solid line) with nominal diameter defined using the largest circle inscribed (dotted line).
The washed beads are dried using freeze dyer (7382033, Labconco, UK). For surface area analysis, the samples are degassed for 6 hours at 100°C. Liquid nitrogen is used as the adhesion gas molecule to perform the analysis by using BET (Brunauer–Emmett–Teller) Surface Area Analyzer (Autosorb-iQ, Quantachrome Instrument, USA). For surface morphology analysis, the samples are placed on an adhesive carbon tape with aluminum pieces and coated with platinum, then studied using scanning electron microscope (SEM) (JSM-6390LA, Jeol, Japan).
3. Mathematical Analysis
The mathematical analysis starts with the basic equations on the main forces acting on the liquid droplets of polymer mixtures as in Figure 4.
The equilibrium equations for the droplet suspension can be described as the surface tensional forces, (upward forces) against the gravitational forces, g and electrostatic forces, (downward force) as in (4).
g (4)
The general surface tensional forces can be defined as in (5). The surface tension of the liquid is affected by the electrostatic charges [12]-[14]. The surface tensional force can be further defined as in (6).
n (5)
Where, for c , n c for c , n
n (
-(
(( c ) ) ) ) (6)
, and is correlation factors, is the droplet diameter, c is the internal diameter of needle, is the original surface tension, is the permittivity of free space, and is applied voltage.
Newt n’s sec n aw gravity state t at t e c ange m ti n is proportional to the force and change applied along the straight line of force acts. The gravitational force, g, is expressed as (7).
g mg g (7)
The electrostatic force, acting on the droplets can be defined as in
(
8) [12].S (8)
Where, S √
r n r
√ n( )
From (8), S is the surface area of droplet, d is the diameter of droplet, E is the electrostatic field, U is the applied voltage and h is the height of electrodes.
By combining (6), (7) and (8), the general equation for the system describing the diameter of the produced droplet is as in (9).
n (
-(
(( c )
)
) )
Where, for c , n c for c , n
, , and is correlation factors, is the droplet diameter, c is the is the internal diameter of needle, is the original surface tension, is the permittivity of free space, is applied voltage, is the density of the liquid, g is the gravity acceleration, and is the height of electrode.
The sphericity of the produced bead can be determined by the change of deformation, where the produced beads are assumed to form prolate or oblate as in Figure 5 (Schmehl, 2002).
Figure 5. Oblate (left) and Prolate (right) deformation compared to sphere of the same volume (dotted circle) [15].
The equation of the deformation can be describe as in (10), and further simplified into (11) as n=2 for prolate and oblate deformation [15].
- nCn (n- )( n ) ( e) ( ) n(n- )(n ) ( e) (10)
Where e v On
√
e √On e
Where Cn is the constant pressure coefficient, is the measured variation of deformation, is the dynamic viscosity, is the velocity of the dripping droplets, is the surface tension of the droplets, T is the time profile for deformation, and is the type of deformation where n for spheroid [15].
-Cn g
(11)
For surface area of oblate, where S ate a ( -ee tan - e)
(12)
√
For surface area of prolate, where
S ate a ( aesin- e ) (13)
Where e -a
√
From the surface area equation in (12) and (13), the sphericity of the bead can be determined as in (14) [16]-[17].
S (14)
4. Results and Discussion
4.1. Experimental Results
From the experiment, the results are collected and inserted into RSM analysis software in MiniTab 16 (Trial). The expanded equation for diameter of the bead is as in (15) where for spehericity is as in (16). The coefficients of the equations are tabulated in Table 3.
c c c c c
c c c c c c (15)
c
c
c c
c
c
c
cc
cc
(16)
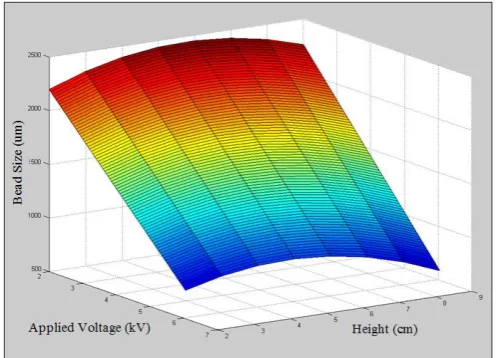
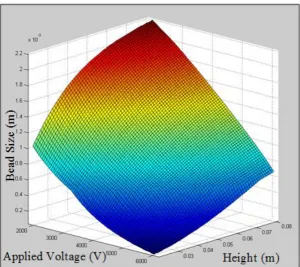
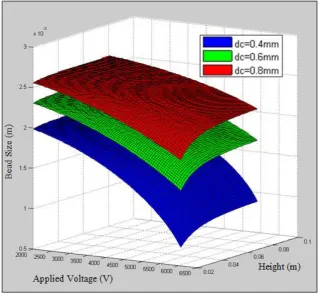
The surface plot using equation (15) is generated using MATHLAB R2009b as in Figure 6. From Figure 6, the surface profile shows that the diameter of the beads is linearly decreasing when the voltage increases. Also, it shows that when the height of the electrodes increases, the diameter of the beads increases, and then decreases when the height are above 4cm. Figure 7 and Figure 8 shows surface profile for different needle sizes, however, the surface profile is similar to Figure 6.
Table 3.RSM Equation Coefficients in Uncoded Units
Term, i i i
Constant, 0 3767 124.7 Needle Size, dc -4325 -99.30 Flow Rate, Q -75.77 -1.342 Voltage, U -470.8 2.420 Height, h 249.3 -1.471 Needle Size×Needle Size, dcdc 4568 76.19 Flow Rate×Flow Rate, QQ 2.162 0.08542
Voltage×Voltage, UU 0.1789 -0.3556
Height×Height, hh -17.92 -0.02970
Needle Size×Flow Rate, dcQ 34.65 -0.4928 Needle Size×Voltage, dcU 256.2 0.9359 Needle Size×Height, dch -69.75 1.522 Flow Rate×Voltage, QU 6.617 0.01638
Flow Rate×Height, Qh 0.1903 0.003515
Voltage×Height, Uh -8.296 0.02615
Figure 7. Surface plots using RSM results of bead size against applied voltage and height at needle size of 0.6mm.
Figure 8. Surface plots using RSM results of bead size against applied voltage and height at needle size of 0.8mm.
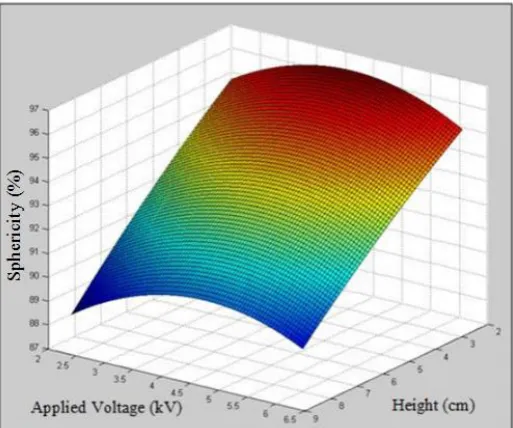
The sphericity of the beads is studied from the RSM model (16) and Figure 10 shows the surface plot for needle size of 0.4mm. The effect of applied voltage on sphericity at different needle sizes is illustrated as in Figure 11.
Figure 10. Surface plots using RSM results of sphericity against applied voltage and height at needle size of 0.4mm.
Figure 11. Graph of sphericity against applied voltage with various needle sizes at height of 2cm. The sphericity of the beads increases when the applied voltage increases, up to a region of 4kV to 5kV, the sphericity started to decrease. By increasing the voltage, the surface charge of the droplets increases, resulting in the increases of repulsive force between particles in the droplets form more spherical shape. However, further increasing the voltage will start to reduce the surface tensions and results in surface deformation.
4.2.
Mathematical Modeling
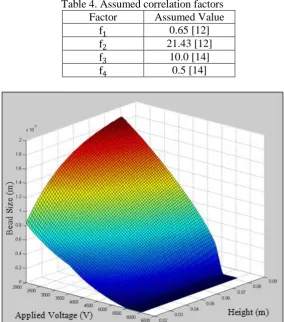
By using the general equation (9), and assumed correlation factors value as in Table 4, the results can be simulated using MATHLAB R2009b. Surface plot of the results is as in Figure 12, 13 and 14.
By comparing the three graphs, there is a region that occurred in Figure 12 at needle size of 0.4mm and does not occur at other two graphs in Figure 13 and 14. The region started to occur at applied voltage of approximately 5.5kV to 6.0kV where the diameter of the beads is unable to be determined. This is due to the extremely high electrostatic charge from high voltage that causes the surface tension of the droplets at that particular needle size become negligible, and the droplet formation become unpredictable from the model [12]. In Figure 13 and 14 there is a drastic decrease in diameter but the negligible surface tension region does not occur. However, the region still occur with higher applied voltage or change in chemical composition [12], [18].
Table 4. Assumed correlation factors Factor Assumed Value
0.65 [12] 21.43 [12]
10.0 [14] 0.5 [14]
Figure 13. Surface plots using simulation results of bead size against applied voltage and height at needle size of 0.6mm.
4.3.
Model Improvising and Validation
By using RSM model from experimental results, the correlation factors of mathematical model are improvised through simultaneous solving and iterations using MATHLAB. The improvised correlation factors are tabulated as in Table 5.
Table 5. Improvised Correlation Factors
Factor
Calculated Value0.5940
2.440
13.65
0.5000
By using the correlation factors in Table 5, the surface plot is generated again using (9). The result of the simulation is as in Figure 15.
Figure 15. Surface plot of bead size of simulation results against applied voltage and height with different needle sizes.
In Figure 15, the smaller needle size shows a steeper decreases in bead diameter. The parameter ranges in this study shows that all three surfaces do not have any negligible surface tension region as reported [12].
The sphericity mathematical model as in (11), (12), (13) and (14) are then simulated. From RSM results, height of the electrode majorly contributes to the sphericity of the beads. Hence, graph of sphericity against height from the sphericity mathematical model result is illustrated in Figure 16.
When the height of the electrode increases, the sphericity decreases drastically. This profile conforms to the behaviour of the bead sphericity from the RSM sphericity model, where increase the height will decrease the sphericity.
Figure 16. Graph of bead sphericity against height with different needle sizes.
To validate the mathematical model, an experiment is carried in fabricating polymer beads using the optimum parameter obtained from RSM model as in Table 6. The results for both experimental and mathematical model using optimum parameters are tabulated in Table 7.
Table 6. Optimum Parameters for Validation Experiments
Parameter Value
Needle Size, dc (mm) 0.4 Height of electrode, h (cm) 2 Voltage applied, U (kV) 4 Flow rate, F (m3/s) 4.44
Table 7. Results of Experiment and Mathematical Model for Validation Bead Diameter
(mm)
Bead Sphericity (%)
Experiment Result 1.6170 96.2
Mathematical Model Result 1.6107 98.7
Error (%) 0.4 2.5
4.4.
Surface Area and Morphology
The results from BET analysis are illustrated in Figure 17. From Figure 7 the surface area and pore volume of the beads are dependent on the bead diameter. The graph shows that the increment of squared bead diameter, d2, causes immediate decreases of surface area, SA. The decrement of surface area is drastic from bead diameter 0.7413mm to 2.1102mm. The smaller the sizes of beads contribute to higher number of beads per gram, and results in high surface area. At bigger bead sizes, where from 2.1102mm onwards, the numbers of beads are limited per gram, and the effect of bead sizes on the bead surface area is insignificant compared to smaller size bead.
Figure 17. Graph of surface area and pore volume against squared diameter with regression line. In SEM analysis of surface morphology,
despite that the parameters for beads fabrications
are different as in Table 8, the sample beads have similar microstructure, where the
crystalline-like cylindrical iron oxide particles are pointing out from the surface as shown in
Figure 18.
Table 8. Parameters of Fabricated Sample Beads for SEM Analysis
Sample dc(mm) F(ml/min) U(kV) h(cm)
A 0.4 4.44 2 8
B 0.6 8.885 4 2
C 0.4 13.33 2 2
Figure 18. SEM images of sample bead A (top left), B (top right), C (bottom left) and D (bottom right) at magnification of 5000 (circle shows some of the pointy cylindrical iron oxide).
5. Conclusion
The experimental studies of electrostatic extrusion method are conducted by using RSM design of experiment. The physical parameters that involve in the study are applied voltage (U), height of electrodes (h), needle sizes (dc) and flow rate (Q). Through the experiment, the relation of the physical parameters to the bead sizes and characteristics are then analyzed and modeled into the RSM model. The RSM model shows that the bead diameter and sphericity are highly dependent on the variation of voltage and needle sizes, whereas differences in height produces a specific diameter profile and decrease the bead sphericity when it increases. From the RSM model, the optimum condition for the electrostatic extrusion method is 4kV of applied voltage, 2cm of height of the electrode and 0.4mm of needle size.
A mathematical model of electrostatic extrusion system is developed for bead diameter model and bead sphericity model relative to physical parameters, which are needle sizes (dc), flow rate (F), height of the electrodes (h) applied voltage (U) and assumed correlation factors (f1, f2, f3 and f4).
Other than bead diameter and sphericity, surface area analysis and surface morphology analysis studies are carried out on the fabricated beads. From the analysis, the total surface area of the beads is dependent on the bead sizes where increasing in bead size decreases the total surface area. The surface morphology shows that the surface microstructures are similar for different fabrication parameters. However, the observations are not included in the development of the mathematical models.
the errors are 0.4% on bead diameter and 2.5% on bead sphericity. The mathematical models are validated as the result has less than 5% error.
Acknowledgements
The authors would like to thank Universiti Malaysia Sarawak for the use of laboratory facilities and equipments.
References
[1] Lim, S. F., Zheng, Y. M., Zou, S. W. and Chen, J. P. (2008). Characterization of Copper Adsorption onto an Alginate Encapsulated Magnetic Sorbent by a Combined FT-IR, XPS, and Mathematical Modeling Study. Environ. Sci. Technol., Vol. 42, 2551 – 2556.
[2] Li, G., Du, Y., Tao, Y., Deng, H., Luo, X., and Yang, J. (2010). Iron(II) Cross-linked Chitin-based Gel Beads: Preparation, Magnetic Property and Adsorption of Methyl Orange. Carbohydrate Polymers, Vol. 82, 706-713.
[3] Amsden, B. G. and Goosen, M. F. A. (1996). An Examination of Factors Affecting the Size, Distribution and Release Characteristics of Polymer Microbeads Made Using Electrostatics. Controlled Release, Vol. 43, 183-196.
[4] Nedovic, V., Manojlovic, V., Pruesse, U., Bugarski, B., Djonlagic, J., and Vorlop, K. (2005). Optimization of the Electrostatic Droplet Generation Process for Controlled Micrbead Production-Single Nozzel System. CIandCEQ Vol. 12, No. 1, 53-57.
[5] Poncelet, D., Babak, V. G., Neufeld, R. J., Goosen, M. F. A., and Burgarski, B. (1999). Theory of electrostatic dispersion of polymer solutions in the production of microgel beads containing biocatalyst. Advances in Colloid and Interface Science, Vol. 79, No. 2, 213-228.
[6] Lim, S. F. and Chen, J. P. (2007). Synthesis of an innovative calcium-alginate magnetic sorbent for removal of multiple contaminants. Applied Surface Science, Vol. 253, 5772–5775.
[7] Nedovic, V. A., Obradovic, B., Leskosek-Cukalovic, I., Trifunovic, O., Pesic, R., and Bugarski, B. (2001). Electrostatic Generation of Alginate Micorbeads Loaded with Brewing Yeast. Process Biochemistry. Vol. 37, 17-22.
[8] Knezevic, Z., Bobic, S., Milutinovic, A., Obradovic, B., Mojovic, L., and Burgarski, B. (2002). Alginate-immobilized Lipase by Electrostatic Extrusion for the Purpose of Palm Oil Hydrolysis in Lecithin/isooctane System. Process Biochemistry, Vol. 38, 313-318.
[9] Ohashi, T., Kuyama, H., Suzuki, K., and Nakamura, S. (2009). Control of Aqueous Droplets Using Magnetic and Electrostatic Forces. Analytica Chemica Acta, Vol. 612, 218-225.
[10] Cornell, R. M. and Schwermann, U. (2000). Iron Oxides in the Laboraory: Preparation and Characterization. Wiley-VCH. New York.
[11] Piazza, L. and Roversi, L. (2011). Preliminary Study on Microbeads Production by Co-extrusion Technology. Procedia Food Science, Vol. 1, 1374-1380.
[12] Kim, Y. J. and Ko, H. S. (2007). Numerical and experimental analysis of electrostatic ejection of liquid droplets. Journal of the Korean Physical Society, Vol. 51, S42-S46.
[13] Geankoplis, C. J. (2003). Transport Process and Separation Process Principles (Includes Unit Operations). Pearson Education, USA.
[14] Sato, M., Kudo, N. and Saito, M. (1998). Surface tension reduction of liquid by applied electric field using vibrating jet method. IEEE Trans. Ind. Appl., Vol. 34, 294-300.
[15] Schmehl, R. (2002). Advanced modelling of droplet deformation and breakup for CFD analysis of mixture preparation, ILASS-Europe.
[16] Cordoba, A. L., Deladino, L., and Martino, M. (2013). Effect of Starch Filler on Calcium-alginate Hydrogels Loaded with Yerba Mate Antioxidants. Carbohydrate Polymers, Vol. 95, 315-323.
[17] Aquino, R. P., Auriemma, G., ’ m re, M., ’ rsi, . M., Menc erini, ., an Gau i , P. . ( ). Piroxicam Loaded Alginate Beads Obtained by Prilling/Microwave Tandem Technique: Morphology and Drug Release. Caborhydrate Polymer , Vol. 89, 740-748.
Authors
Ken Giap Low
Ken Giap Low was a student in the Department of Chemical Engineering and Energy Sustainability, Faculty of Engineering, Universiti Malaysia Sarawak (UNIMAS). He had developed interest in polymer material characterization, modeling and simulation for environmental and energy application.
Soh Fong Lim
![Figure 4. Main force acting on droplet in electrostatic extrusion [12].](https://thumb-us.123doks.com/thumbv2/123dok_us/8774886.1758942/5.595.94.530.75.240/figure-main-force-acting-on-droplet-electrostatic-extrusion.webp)
![Figure 5 . Oblate (left) and Prolate (right) deformation compared to sphere of the same volume (dotted circle) [15]](https://thumb-us.123doks.com/thumbv2/123dok_us/8774886.1758942/7.595.106.503.228.313/figure-oblate-prolate-deformation-compared-sphere-volume-dotted.webp)