c
J.-P. Jamet and J.-M. Chaumet,Published by EDP Sciences2016 DOI:10.1051/ocl/2016044
Available online at: www.ocl-journal.org
Oilseeds & fats Crops and Lipids
OCL
R
esearch
A
rticle
– D
ossier
O
pen
A
ccess
O
IL CROPS AND SUPPLY CHAIN IN ASIA
L
a fili
ere ol
`
eagineuse en
´
A
sie
Soybean in China: adaptating to the liberalization
Jean-Paul Jamet
1and Jean-Marc Chaumet
2,1 Membre de l’Académie de l’agriculture de France, 18 rue de Bellechasse, 75007 Paris, France 2 Département économie de l’Institut de l’Elevage, 149 rue de Bercy, 75595 Paris Cedex 12, France
Received 18 July 2016 – Accepted 14 October 2016
Abstract – Since 1978 and its opening, China has undergone a process of nutrition transition, animal products taking an increasing share. Anxious to ensure a certain level of food independence, Chinese authorities have developed national livestock production. The increase in volumes and the development of large scale breeding have increased the demand for commercial feed and thus soymeal. Meanwhile, edible oil consumption rose sharply, accentuating the demand for soybeans. To meet this demand, soybean imports were liberalized early, leading the country to become heavily dependent. China has indeed made the choice to maintain its independence in cereals at the expense of other grains, such as soybeans. Competition between corn and soybeans has turned in favor of the cereal, soybean production levelling off then regressing. China’s dependence extends to the crushing sector, controlled by foreign companies. Public supports in place, such as minimum prices, have resulted in increasing the price gap with imported products, leading to a reform of soybean policy in 2014.
Keywords: China/soybean/import/soymeal/edible oil/crushing
Résumé – Le soja en Chine : l’adapation à la libéralisation. Depuis 1978 et l’ouverture de la Chine, l’alimentation de la population de la population chinoise s’est considérablement modifiée, les produits animaux prenant une part croissante. Soucieux de garantir un certain niveau d’indépendance alimentaire, les autorités chinoises ont développé les productions animales sur leur sol. La progression des volumes ainsi que la transformation des modes d’élevages ont accru la demande en alimentation animale commercialisée et donc en tourteau de soja. Parallèlement, la consommation humaine d’huile a fortement progressé, accentuant la demande en graine de soja. Pour satisfaire cette demande, les importations de soja ont été très tôt libéralisées, conduisant le pays à devenir fortement dépendant. La Chine a en effet fait le choix de chercher à conserver son indépendance en céréales aux dépens d’autres grains, comme le soja. La compétition entre le maïs et le soja a donc tourné à l’avantage de la céréale, la production de soja plafonnant puis régressant. La dépendance de la Chine s’étend jusque dans la trituration, celle-ci étant passée aux mains d’entreprises étrangères. Les soutiens mis en place, comme le prix minimum, n’ont eu comme conséquence que d’accroître l’écart de prix avec les produits importés, menant en 2014 à une réforme de la politique du soja.
Mots clés : Chine/soja/importations/tourteau/huile alimentaire/trituration
Chinese rulers have always paid great attention to agricultural production. Grains (mainly cereals but also soybean and tu-bers) were considered as the source of the country’s power and wealth. Lack of food has almost always been one of the reasons explaining the fall of dynasties.
Until the 20th century, China relied on its own resources to feed its population. Only imports of rice occasionally occurred in the south of the country in the 19th century. Self-reliance was also the general philosophy of Mao Zedong; imports were limited until the Great Leap Forward. Starting the beginning
Correspondence:[email protected]
of the 1960’s imports of cereals, especially wheat, gained mo-mentum as Chinese agriculture was unable to produce enough grain. Liberalization of agriculture in the early 80’s reversed the trend and China exported corn and wheat at the end of the 1980’s.
But the steady economic growth that distinguishes China since the 90’s has brought change in the lifestyle of many Chinese households. Looking at the demography, the rise in living standards and agri-food foreign trade, it seems that the Chinese economy is moving further away from achieving the self-sufficiency objective. Chinese agricultural production is clearly struggling to satisfy the increase in demand, whether
D
it emanates from consumers or livestock farmers. After the year 2003, the trade balance tipped into long-term deficit, in contrast with the high surpluses achieved in manufactured goods trading.
With its high level of imports, Chinese soybean sector is the symbol of this food dependency, a new era in Chinese history.
1 Origin and domestication of soybean
in China
Because China has a long history of growing soybean and a rich array, soybean germplasm has been bred through long-term natural and artificial selection, this provides a rich base for the selection and breeding of soybean varieties and for making a great contribution to soybean production and breed-ing in the world.
China has made extensive improvements in soybean vari-eties and the high-yield culture techniques of soybean continue to improve. There is still, great potential for further improve-ments in soybean yield.
The genus Glycine wild is divided in two subgenera Glycine perenialsandGlycine soja.
1.1 Distribution of annual wild soybean
Taxonomically both the annual wild soybean (G soja) and cultivated soybean (G Max L) are subgenera of soja.
The distribution of wild soybean in China is extensive. Fukuda (1933) a Japanese scholar thought that the origin of soybean is North-East China, based on the observation that the semi natural wild soybeans are extensively distributed in North-East China, but not in the other regions, that there are many soybean varieties in this region and that many of them possess “original” characteristics (Qiu and Chang,2010).
In fact, many small black soybean germplasms have “prim-itive” traits. They are extensively distributed in the lower and middle reaches of the Yellow River; especially in North Shaanxi and North Shanxi provinces. Therefore, their distri-bution area is much larger than North-East China alone (Qiu and Chang,2010).
Maliao Dou and Nidou (G Max L) which are closely re-lated to semi natural soybean are distributed even as far South as the Yangtze River Valley. Fukuda indicated that the num-ber of soybean varieties in this area is very large and that Shaanxi and Shanxi provinces alone have 3000 accessions of soybean germplasm resources. As well as these Spring-type soybeans, the number of varieties of summer planting types in the Yangtze River Valley is also developing considerably.
The genusGlycineis thought to be of ancient polyploid origin due to the high chromosome number in the majority of the species (n = 20) compared to closely related genera (mostlyn = 10 or 11, one withn = 14). Additional lines of evidence exist, including cytogenetic studies in haploïdGmax (Craneet al.,1982) supporting the hypothesis of polyploid ori-gin. Schuelteret al. (2004) found that the Glycine genome has gone through two major rounds of duplication, the first esti-mated at 41.6 million years ago and another at 14.5 million
years ago. Vanet al. (2008) looked at evolutionary events, vealing the recent divergence of two soybean homologous re-gions occurred at 60 and 12 million years ago, respectively.
Clarindoet al. (2007) found that the karyograms support soybean’s tetraploid nature (4x = 40), specifically for the presence of chromosomes with identical morphology and sug-gested that chromosome rearrangements may have occurred during the speciation ofGmax, the wild soybean was domes-ticated by ancient people under certain agricultural conditions. The first piece of evidence is that the number of chromo-somes is both the cultivated soybean and the wild soybean is 2n=40. The chromosome set in GG, if we cross the cultivated soybean with the wild soybean, the fertility and the seed – set-ting percentage of the F1 generation are normal and there is no obvious difference as compared to crosses with cultivated soybeans. This shows that there is no isolation between the cultivated soybean and the wild soybean and they are (at the very least) close relatives.
The second piece of evidence is that when the cultivated soybean is crossed with the wild soybean, the seed size, plant height, lodging and other traits are inherited as quantitative traits, with some intermediate types occurring, which show that the two groups accumulated minor variants of the under-lying genes.
Third, new variations have been identified in late-maturing variants with large seeds and thick stems are also minor varia-tions of quantitative traits.
The fourth piece of evidence is that among the rich germplasm resources in China, there are wild soybeans, semi wild soybeans and highly evolved cultivated soybeans.
People mainly use soybeans seeds. In long-term produc-tion activity and use, people have focused on selecproduc-tion of large seeds. While the seed of soybean has been enlarged, corre-spondingly the pod has been enlarged, the plant height reduced and the stem thickened. Reductions in plant height have been favorable for development from wine type to vertical type. The vertical type plant is easy to manage and good management conditions have promoted the selection of strong and lodging-resistant types.
1.2 Distribution across the provinces
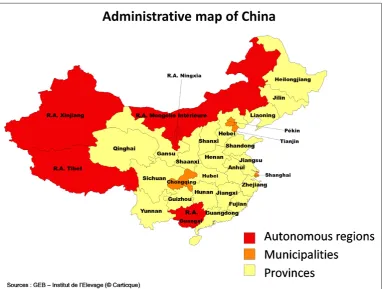
In China, three growing regions can be distinguished, ac-cording to the cropping system. The North-East Spring-sowing soybean region is the largest soybean-producing region in China. This region includes Heilongjiang, Jilin, Liaoning and the greater part of Inner Mongolia (see Fig. 1). Soybean is sown in Spring (the last ten days of April and the first ten days of May) and harvested in Autumn (from the middle ten days to the last ten days of September). The total production of soy-bean in Heilongjiang province ranked the first.
Fig. 1.Administrative map of China.
ten days of September to the first ten days of October before wheat sowing.
The South China multiple-sowing soybean region includes the provinces south of the Yangtze River. The region has spring, summer and autumn-soybeans. The spring soybean is sown in the Yangtze River Valley from March to the first ten days of July late-rice Winter wheat are planted after the soy-bean harvest. Summer soysoy-bean is sown after the harvest of winter rapeseed from the last ten days of May to the first ten days of June and harvested in October.
The autumn soybean is sown after the harvest of early rice from the last ten days of July to early August and harvested in the first ten days of November.
1.3 Utilization
Soybean use directly for food is today about 10 Mt, mainly in the form of traditional soybean products as bean curd (tofu), soybean milk, soybean paste and soja sauce, bean curd sticks. Less than 1 Mt is used for the production of modern processed products such as soybean milk powder and isolate soy proteins and concentrated soy proteins.
1.3.1 Processing and utilization
In Japan, the whole plant with the fresh green pods is har-vested. The whole plant is boiled with the pods, but only the cooked green beans are consumed. This is the preferred way
of enjoying edamame. Shelled green beans are sold fresh ev-ery day in markets in China and Taïwan. Due to a shortage of domestically produced vegetable soybean, instant quick frozen green vegetable soybean has found a market in Japan. Facto-ries established in Southern China export frozen vegetable soy-bean to Japan. Thailand, Indonesia and Vietnam currently have factories that process and export frozen vegetable soybeans.
In China, Japan and Korea soybean and soybean products are a common part of the diet. Tofu (or doufu) is thought to have originated in China, along with soy sauce and several varieties of soybean paste used as seasoning. Japanese food made from soya includes miso, natto, leniako and edamame as well as products made with tofu such as atsuage and aburaage. In Korean cuisine, soybean sprouts (kongnamul) are used in a variety of dishes and are the base ingredients in doenjang, cheonggukjang and ganjang.
1.3.2 Soya by-products
Tofu, also known as bean curd is a food made by coagulat-ing soy milk (2 types of coagulants are used commercially: salt or acid) and then pressing the resulting curds into soft white blocks. There are many different varieties of tofu, including fresh tofu and tofu that has been processed in some way. Tofu has a low calorie count and relatively large amount of protein. Soy sauce (also called soya sauce) is made from a fer-mented paste of boiled soybeans, roasted grain, brine and As-pergillus oryzaeorAspergillus sojaemolds. Like many salty condiments, soy sauce was originally a way to salt, histori-cally an expensive commodity. Traditionally soy sauces have
D
been made by mixing soybeans and grain with mold cultures such asAspergillus oryzaeand other related micro-organisms (the resulting mixtures is called “kôji” in Japan, used both for the mixture of soybeans, wheat and mold as well as for the mold itself). Some brands of soy sauce are made from acid hy-drolysed soy protein instead of being brewed in a traditional culture. This takes about three days. Although they have a dif-ferent flavor, aroma and texture, when compared to brewed soy sauces, they have a longer shelf live and are usually made for this reason.
Tempeh is a traditional soy product originating from Indonesia. It is made by a natural culturing and controlled fer-mentation. It is the only soy product that did not originate from the sinosphere cuisine. The production process begins with whole soybeans, which are softened by soaking and de-hulled, then partly cooked. A fermentation starter containing the spores of fungusRhizopus oligosporusorRhizopus oryzae is mixed in. The beans are spread into a thin layer and are al-lowed to ferment to 24 to 36 h at a temperature around 30◦C. Tempeh can be eaten alone or used in Chili, stir frys, soups, salads, sandwiches and stews. Tempeh’s complex flavor has been described as nutty, meaty and mushrooms-like.
Miso is a traditional Japanese seasoning produced by fer-menting soybeans with salt and the fungusAspergillus oryzae (see above) and sometimes rice, barley, wheat or other ingre-dients. The result is a thick paste used for sauce and spreads, pickling vegetables or meats and mixing with dashi soup stock to serve as miso soup called misoshiru, a Japanese culinary staple. Miso is still widely used in Japan, both in traditional and modern cooking and is gaining worldwide interest.
Natto is a traditional Japanese food made from soybeans fermented with Bacillus subtilis. Some eat it as a breakfast food. In Japan, Natto is most popular in Eastern regions. Many countries produce similar traditional soybean foods fermented withB. subtilissuch as Shuidouchi of China, Cheonggukjang of Korea, Thuanao of Thailand.
2 From 1st world producer to 1st world
customer
Dependency on soybean is relatively new in China’s his-tory. The country was the largest producer until the second half of the twentieth century. It was self-sufficient and its exports of beans were still very important to the USSR before the Great Leap Forward (1959–1961). Soybean production grew from 9 million tons in the 80’s to a peak at 16 million tons in 1994. In the following years, the production levelled off.
China remained a soybean net exporter until the 1990’s. Soybean exports exceeded one million tons in the end of the 80’s and in the beginning of the 90’s while imports were nonexistent.
But the Chinese soybean sector has undergone a big change in the 1990 and the 2000’s in line with the increas-ing openness of China to the global market and the growth in demand of soy products. China has switched from being a competitor of world big exporters as the USA, Brazil and Argentina to their biggest customer.
2.1 Increasing demand in new soy products
If human consumption of soy products accounted for the vast majority of soy use in the past, feed demand, along with the rise of animal production, and soy oil consumption in-crease have affected the structure of the soybean market.
2.1.1 Demand for modern animal production
The shift in feed demand is fueled by two factors: the growth in animal production and the changing structure of an-imal farms.
The beginning of China’s economic structural reform kick-started a continuous process of nutrition transition until to-day. Formerly centered on plant products, food consumption of Chinese households has diversified, with an increase in the consumption of meat products (cattle, pig and poultry meat) and dairy products. By 2013, total food availability was close to 3000 kcal per day per inhabitant, which includes a high pro-portion (above 20%) of animal calories (Chaumet and Pouch, 2012). According to Chinese data, pork production increased 3 fold between 1985 and 2015 and is still the major meat prod-uct in China, accounting for 57% of total meat prodprod-uction. Poultry meat increased 18 times, beef production 15 times and sheep production 7 times. These increases are driven by per capita consumption as well as population growth. Net popu-lation growth was around 7 million in 2014 but it will slow down in the next decades. The Chinese population will reach 1.5 billion by 2030 and then will reach a plateau.
The main drivers of the per capita consumption are in-creasing purchasing power and urbanization. In 2014, 55% of population were urbans, leaving a potential increase in ani-mal products among the 45% living in rural areas. According to USDA, China’s per capita consumption of meats stood at 33.6 kg and the per capita consumption of milk and dairy prod-ucts remained low at 12.6 kg in 2014 (Clever and Wu,2016). Both will increase in the next few years. But aging population might slow down the growth consumption rate and the end of the one child policy is unlikely to reverse the trend.
The increase in the consumption of animal products – specifically poultry and pig – leads to an accompanying crease in the consumption of crop production. In order to in-crease production volumes, demand for cereals and soy for animal feed rises.
For food safety and economic reasons large-scale and mod-ern animal production operations are pushed by the govmod-ern- govern-ment while traditional small-scale operations gradually dis-appear. Chinese data show a rapid expansion of large scale animal farming production. From 2002 to 2010, the percent-age of hogs raised in farms that sell more than 3000 animals per year, rose from 5% to 18%. In the dairy sector, the number of cows raised in farms with more than 1000 animals rose from 3% in 2002 to 20% in 2015. Hence the use of self-mix feed is decreasing and industrialized feed use is increasing, resulting in an increase in demand of soybean meal.
Peanut oil 9%
Rapeseed oil
Rapeseed oil
Palm oil 18%
Others oils 5%
Oil consumpon in China (in volume)
Soybean oil 44%
24%
Source : GEB-Instut de l'Elevage / Clever and Wu, 2016
Peanut oil
11% Others oils
5%
Oil producon in China (in volume)
29%
Soybean oil 55%
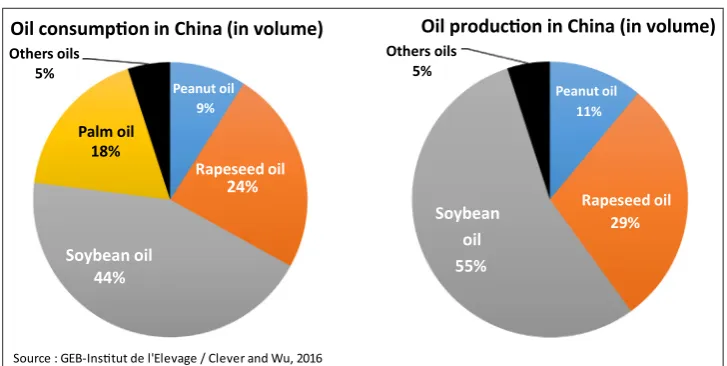
Fig. 2.Vegetable oil production and consumption in China.
the world largest feed producer, with close to 200 million tons of products.
2.1.2 Demand for soy oil
In line with the economic growth and urbanization, China’s edible vegetable oil consumption per capita rose from less than 8 kg in 1996 to 24 kg in 2014. China’s per capita consumption is lower than the US and European one but is higher than world average consumption. From the national consumption point of view, volumes increased from 10 Mt (million tons) to 33 Mt.
In addition to this sharp increase in total vegoil consump-tion, soybean oil took the leading position more than 10 years ago. Until 2002, rapeseed oil was the most consumed edible vegetable oil, followed by soybean oil, peanut oil and cotton-seed oil. Most of the oils used in China were marketed in a bulk crude format, reflecting regional preferences. Soybean oil was consumed in northeastern area while rapeseed oil was con-sumed in the Yangtze basin and peanut oil in the southern parts of the country. But new oil standards have modified this struc-ture of the market. The crude oil was unrefined, murky, and considered to be unhealthy. In 1992, the Chinese authorities published a standard called “salad oil” which led to the seg-mentation of the oil market. Next to the crude oil was then a deodorized oil. Taste and odor were not the first choice criteria anymore and price led the purchases of Chinese consumers.
Cheaper soybean oil became more attractive and in 2003, rapeseed oil lost its first place to soybean oil as the number one human consumption oil. According to the USDA (Clever and Wu,2016), soybean oil accounts for more than 44% of the market, followed by rapeseed oil (24%), palm oil (18%) and peanut oil (9%) (Fig.2).
In production terms, knowing that no palm oil is produced in China, soybean oil is the principal Chinese oil product, ac-counting for close to 55%, while rapeseed oil accounts for only 30% and peanut oil for 11% (Fig.2).
2.2 Liberalization of soy markets
2.2.1 China’s strategy and tariff policy
To meet this new demand in soy products, the Chinese authorities faced different choices. The policy regarding im-ports of oilseed products was not easy and the Chinese au-thorities dithered for some years. In 1995, China removed the 13% value added tax (VAT) on imported soymeal to enhance the development of the livestock industry and to ensure feed supply. The result was a sharp increase in soymeal imports, above 4 million tons in 1997/98 and a fall in domestic soy-bean prices as well as in crushing margin. Edible oil produc-tion went down and oil smuggling gained momentum (Hsu and Gale,2001). To address these problems, the government re-imposed VAT on soymeal imports in 1999 and decided to import whole and unprocessed soybeans and to process them domestically in order to capture crush margins and to develop crushing industry in line with its national economic develop-ment policy. China decided to put a 3% soybean single tariff policy into practice instead of a 180% tariff, a 40% preferen-tial tax and a 3% in-quota tax rate. This decision was intended to enhance the production of high-value-added goods (namely soy oil and meal), while preserving China’s food security strat-egy by leaving arable land for grain crops production. China’s agricultural trade strategy consisted of authorizing import in-creases only on certain “non-strategic” products (soy, meat), by imposing tariffrate quotas on cereals. In this way agricul-tural production can focus on strategic products, like grains, in order to maintain self-sufficiency in this sector. Cereals receive special attention because of their centuries-old political value: the rulers must meet the requirements in wheat and rice that form the basis of the diet.
This analysis show that the government has made a very clear geostrategic choice. Noting the dynamic development of crops – including soybeans – in Brazil and Argentina, it has decided to be dependent on these countries to support the de-velopment of domestic livestock by importing raw materials at competitive prices to feed animals. For example, if China were to produce 75 million tons (Mt) of imported soya it crushes
D
in its factories, it should devote 40 million hectares and in turn import at least 200 million tons of grains.
While the country has no arable land reserves, its acreage fell from 133 to 120 million hectares in thirty years due to eco-logical conservation, urbanization (in 2015, 54% of the pop-ulation live in cities), industrialization and multiple damage resulting from pollution, depletion and desertification, salin-ization and erosion.
To promote the imports of soybean and to prepare its entry to WTO (World Trade Organization), China allowed soybean imports to enter at a tariffas low as 3% since the end of 1990s, without tariffrate quotas. In contrast, tariffon soybean oil low-ered form 63% in 2001 to 9% in 2006 and tariffon soymeal remained at 5%.
Thus, since 2000, Chinese soybean production has been exposed to the forces of the world market. This sharply con-trasts with rice, wheat or corn production which benefit from tariffrate quotas (TRQ). The liberalization of the soybean mar-ket have brought about two major consequences to the domes-tic sector.
2.2.2 Sharp increase in soybean imports and decline in domestic production
Soybean imports skyrocketed since the end of the 90’s. In 2015, more than 80 Mt have entered China, compare to 4 Mt in 2000. China’s soybean production is not competitive with other large producers such as USA, Brazil and Argentina be-cause of the relative lower yield in soybean production and the limited arable land in China. Production is rarely mech-anized and small scale farms are not competitive with large scale North or South American farms. Even in Heilongjiang which has a relatively abundant land resource, soybean pro-duction farms rarely exceed 10 ha.
The price of domestic soybean is significantly higher than the bean produced in USA or Brazil and production cost keep rising. From 2004 to 2014, production costs increased 2 fold, according to Chinese data. Moreover, Chinese soy-bean price remained at high levels because it benefits from a minimum price since 2008, in an attempt to help soybean farmers facing a liberalized market. Soybean was indeed in-cluded in the program of “temporary reservation” initiated in 2008 and implemented in the producing provinces of the northeast. Announced every year in late October or early November, the minimum price related to the program has pro-gressed during four consecutive seasons, from 2009/2010 to 2012/2013, before stabilizing in 2013/2014 to 4600 RMB per ton (550 e). This setback is due to the growing differential between falling world prices and rising domestic prices that encouraged Chinese crushers to favor imports over domestic soybeans. In 2013, the import prices averaged USD 600 per ton (to which must be added 3% custom duties) while the price in the producing provinces exceeded USD 750. The produc-ers therefore had great difficulty to sell their products not only to manufacturers, but sometimes to buyers in charge of public reserves because, in addition to being expensive, their grains did not meet the minimum quality criteria. Public stocks nev-ertheless inflated, as well as costs for the state (procurement,
16 18 20
million million tons
6 8 10 12 14 16
0 2 4 6 8
1979 1981 1983 1985 1987 1989 1991 1993 1995 1997 1999 2001 2003 2005 2007 2009 2011 2013 2015
Source : GEB-Instut de l'Elevage / China Stascal Yearbook
0
1979 1981 1983 1985 1987 1989 1991 1993 1995 1997 1999 2001 2003 2005 2007 2009 2011 2013 2015
Producon Area
8 9 10
ha
3 4 5 6 7 8
0 1 2 3 4
0
Fig. 3.Soybean sown area and production volumes.
storage, . . . ) and many observers have described the minimum price as “subsidy” for imports and foreign growers.
The production in China is traditionally non-genetically modified soybean. But China’s GM free soybean does not hold an advantage over GM soybean imported as this bean is only used to produce oil and soymeal and is not intended for direct human consumption. Processors aim to get the cheapest prod-ucts and only pay attention to the higher oil extraction rate of GM soybeans, the oil content of domestic soybean is indeed 3% to 5% lower than that of the imported soybean. The market is then largely segmented: non GM domestic soybean is used at more than 60% in food use (tofu, soy milk . . . ) when 90% of GM imported soybean is crushed to make oil and soymeal.
Moreover, the layout of Chinese soybean production is un-balanced, with production areas mainly concentrated in the Northern provinces, namely in the “Dongbei” region and in Inner Mongolia. Before the 1990’s, China’s soybean crushing plants were mainly located in the soybean producing regions (Aubert et al., 2001). The sales areas are in the south and south-east parts of the country. Under this pattern, the price structure of soybean is low in the north and high in the south. Since the beginning of the imports, many new soybean crush-ing plants were built along the coastal region which leads to the circulation pattern of “north-to-south grain diversion”. It ap-pears more expensive for processors now located near the har-bors to purchase domestically produced soybeans rather than imported ones partly due to significant bottlenecks in China’s transportation system. The large quantity of imports has then changed the soybean trade pattern. The price differences are eliminated and the domestic soybean has lost its resource su-periority.
Unable to compete with imports, China’s soybean produc-tion has been in a steady decline since 2004. At 11 Mt in 2015, production was reduced by more than 35% while sown area decreased by more than 20% (Fig.3). However the country is still the 4th largest soybean producer in the world. Yield re-mained around 1.8 ton/ha and did not increase.
Peanut
32%
Coon
12%
Sunflower
5%
Rapeseed
28%
Soybean
23%
Source : GEB-Instut de l'Elevage / Clever and Wu, 2016
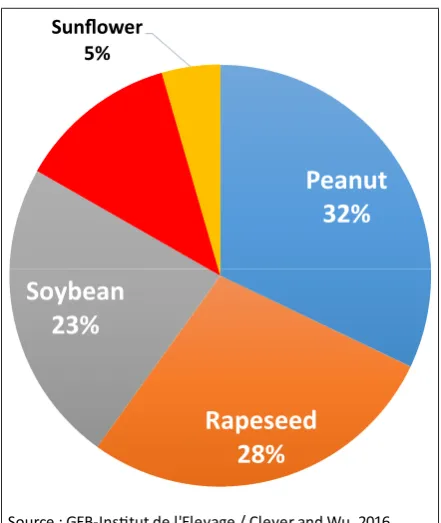
Fig. 4.Principal oilseed production in China (in volume).
60 70 80 90
Million tons
20 30 40 50 60 70
0 10 20 30
2001 2002 2003 2004 2005 2006 2007 2008 2009 2010 2011 2012 2013 2014 2015 Brazil USA Argenna Others
Source : GEB-Instut de l'Elevage / TradeMap
2001 2002 2003 2004 2005 2006 2007 2008 2009 2010 2011 2012 2013 2014 2015 Brazil USA Argenna Others
Fig. 5. Chinese soybeans imports (Source: GEB-Institut de l’Elevage/Chinese customs).
China has become dependent on foreign soybean, 80% of its consumption being imported. It now accesses more than 60% of the world trade in soybean. Soybean imports account for 1/3 of Chinese agricultural imports value that is to say 35 billion USD. And China is also dependent on 3 countries only, accounting for 95% of the volumes bought on the international market: Brazil, with 49% of the market share, US (35%) and Argentina (12%) (Fig.5). But this situation is in fact a mutual dependency. Three quarters of Brazilian soybean exports are sold to China as well as more than half of US soybean sales and close to 85% of Argentina exports.
Table 1.Increasing Chinese dependency rate in vegoil for the last 20 years.
1996/97 2000/01 2005/06 2014/15
Consumption (Mt) 10 12.3 21.45 33
Oil imported (Mt) 3.7 4.7 12.4 24.3
– directly 3.3 2 6.95 8.57
– through grains imports 0.4 2.7 5.4 15.7 Self-sufficiency rate (%) 63 61.8 42.2 26.4 Dependency rate (%) 37 38.2 57.8 73.6
The production of soymeal was around 59 Mt in 2014, ac-cording to the USDA, above the national consumption which is around 56 million tons and account for close to three quarter of the total protein meal volume consumed in China. If 1 Mt is used in industrial sector, more than 1.5 Mt is exported. China was and still is a net exporter of soymeal, to Japan, Vietnam and South Korea.
Despite the huge volume of seeds crushed in China and the country’s current self-sufficiency in soybean meal, it is a net importer of soybean oil. The imports peaked at 2.8 Mt in 2007 and decreased to 0.8 Mt in 2015. Although China has increased its soybean processing capacity since 2001, demand for soybean oil has risen even more quickly. Another reason explaining these imports might be found in oil and meal ex-traction rates. Chinese crushing industry seems to have con-centrated its activities on protein meal at the expense of oil. Their extraction rate for meal is above 79%, when the world average is 0.5% below and it is of 17.8%, well below the world average of 18.5% for soybean oil.
Regarding the oil sector as a whole, China dependency is increasing year after year (Tab. 1). The large volume of imported soybean and the growth in palm oil imports (from 1.5 Mt in 2001 to between 5 and 6 Mt since 2009) are the main reasons explaining this situation.
2.2.3 China’s crushing industry became foreign-owned
Soybean crushing capacity increased gradually every year, from 40 Mt in 2001 to close to 150 Mt in 2015. Taking into account that around 70 Mt are crushed every year, the sec-tor clearly shows an overcapacity. The biggest capacity is lo-cated in Shandong province (40 Mt), Jiangsu province (22 Mt), Guangdong province (20 Mt), Guangxi province (15 Mt), Liaoning province (8 Mt) and Tianjin (9 Mt), all far away from production areas. But since 2004 and the crisis in the Chinese crushing sector, a growing part is now in the hand of foreign companies.
When the soybean prices peaked in April 2004 at 360 USD/ton Chinese crushers bought US soybean, as instructed by the Chinese government. When the prices went down to 190 USD 6 months later, many buyers tried to default on their buying contracts but finally had to fulfill their contractual obli-gations. The overpaid soybean resulted in huge losses and in bankruptcy of many Chinese crushing companies, leaving the opportunity to international soy traders to enter the soy indus-try. The “soybean crisis” led to a power shift in the indusindus-try. The share of soybean trade from major international trading companies is now estimated in China at 70% even if two-third
D
of the crushing capacity is in the hands of local companies. The association ADM/Wilmar is the largest international com-pany in this filed in China and its partner Cofco (China Oil and Food Corporation) the leading public company in the field. Wilmar has 56 branches in trade and crushes 20 Mt of oilseed each year. Bunge entered the local crushing industry in 2005. It has three large facilities in Nanjing, Tianjin and Shanghai, as well as a joint venture with the Sanwei Group for crush-ing/refining plant in the port of Rizhao (Shandong). Cargill operates in China through 34 companies in direct control or joint venture. It is the operator of four oilseed crushing plants including three in Canton province and in Jiangsu, north of Shanghai.
2.3 Soybean policy regarding domestic and international competition
2.3.1 A corn-soybean competition
Chinese soybean is also challenged by the development of corn production which has extended its grip on land that was once assigned to soybean especially in the Manchurian plains, where corn has become a major production. Corn production has doubled in 15 years thanks to the 50% increase of surface area cultivated, but especially due to increased yields. These went up 20% to 59 quintal/ha.year due to improved planting density, improved fertilization, irrigation, use of plastic cov-ers and adoption few varieties. The trend is a net increase of 12 quintal/ha.year. The evolution recorded in the province of Heilongjiang illustrates this winning competition between corn and soy: it went from the largest soybean producing re-gion to the largest corn producing rere-gion and accounts today for 15% of corn national production. Changes in relative prices of corn and soybeans is to the advantage of corn. Indeed, while the corn yield is three times that of soybeans, corn is paid RMB 2 RMB/kg and that of soybeans 4.2 RMB/kg. Between 2008/09 and 2013/14 minimum price for corn increased by 50% while minimum price for soybean rose by only 30%. This support has enabled continued growth of the area and produc-tion of corn.
In addition, soybean yields and rapeseed have made little progress in recent decades, unlike cereals yields. The figures speak for themselves: 18 quintal/ha on average for soybeans and 19 for rapeed against 59 quintal/ha for corn, 50 for wheat, 47 for rice and 36 for peanuts.
As shown before, Chinese authorities have not tried to modify this situation which is unfavorable to soybean, as it was their strategy to promote corn and other cereals. The gov-ernment intention to induce a switch from soybean to corn can be traced back to its food security and grain self-sufficiency objective.
2.3.2 The soybean sector facing world market
Edible oils have become an everyday product for Chinese consumers forcing rulers to pay attention to the oilseed sector. As most of the edible oil is, directly or indirectly, imported, world prices changes are soon or later transmitted to the local market. Having liberalized the market, Chinese government
still has some ways to control the market and to mitigate its negative effects on Chinese consumers. If the soybean mini-mum price was intended to help farmers, Chinese authorities did hesitate to use authoritarian methods to protect consumers when prices increased sharply.
In 2010, the average retail price for of vegetable oil rose by 17% between October and mid-November. International soy-bean prices were on the rise in 2010 and peaked in May 2011. The Chinese authorities then requested the top four vegetable oil companies to freeze their prices as a temporary measure that lasted until mid-2011. In turn, small and medium compa-nies did not raise prices for fear of losing market share. Despite the sales of part of state rapeseed oil and soybean oil reserves, all companies lost money. Those that tried to raise prices were quickly asked not to do so. The government control loosened in the 2nd semester of 2011 when world prices decreased, re-ducing pressure on edible oil prices.
The same situation occurred in 2012, when world soybean and other oilseeds skyrocketed. The five leading oil proces-sors firms, Cofco, Wilmar China, Luhua Group, Jiusan Oil and Hopeful Grain and Oil, controlling 80% of the market were asked one more time to keep their prices steady.
But with the fall of world soybean prices since 2013, the nature of the problem has changed and cannot be solved by the same kind of measures. The growing price difference be-tween domestic and imported soybean strongly hurt Chinese soybean production even in its food use “niche”. Medias have reported a growing use of imported soybean by food proces-sors as it has become a lot cheaper than domestic soybean. This information has scared some Chinese consumers as imported soybean is GM.
Chinese authorities have then decided to change the soy-bean (but also rapeseed) support system in the 2014/2015 mar-keting year. It is now based on setting a “target price” and a “deficiency payment” for the difference between the “target price” and market prices. The new system is under the oper-ational responsibility of the provinces, but the administrative procedure remains running in 2016.
The purpose of this reform was to allow Chinese soy-bean price to decrease and to become more competitive with imported beans. Between January 2014 and December 2015, Chinese soybean price indeed decreased by 20%, but imports did not slow down, driven by animal feed and oil demand.
3 Conclusion: A break in the Chinese
soybean production trend?
In the medium term, Chinese authorities want to reduce the huge reserves of corn and to limit imports of corn substitutes. The “Crops structural adjustment plan 2020” calls for reduc-ing corn surfaces of 3.3 million hectares (–9%/2015), going back to a little over 34 million hectares, the 2011 level. After subsidizing corn, Chinese authorities will now spend 500 mil-lion euros to reduce the production of this cereal, encourag-ing farmers to grow or to rotated in width peanut, soybean, alfalfa . . .
and should not curb imports driven by demand for animal feed. In the next few years China’s imports of soybean will proba-bly level offas the country will tend to import more animal products to feed its population.
After many years of decline and very little interest from policy makers, soybean seems to benefit from the corn sector’s problems. The soybean price reform and the newly available land may change the soybean situation in Chinese agricultural landscape. Soybean imports will not decrease, but domestic production might find its place on the market and embrace a new future.
References
Aubert C, Dabat M-H, Li X. 2001.OCL8: 216–222.
Chaumet JM, Pouch T. 2012. La Chine au risque de la dépendance alimentaire.OCL19: 290–298.
Clarindo WR, de Carvalho CR, Alves BMG. 2007. Mitotic evidence for the tetraploid nature of Glycine max provided by high quality karyograms.Plant Systematics and Evolution265: 101–107. Clever J, Wu X. 2016. Prospects for China’s Oilseed Market Remain
Strong, Oilseeds and Products Annual, USDA.
Crane CF, Bwversdorf WD, Bingham ET. 1982. Chromosome pairing and associations at meiosis in haploid soybean (Glycine max).
Canadian Journal of Genetics and Cytology24: 293–300. Hsu HH, Gale F. 2001. China: Agriculture in Transition, Agriculture
and Trade Report No. (WRS-012), 76 p.
Qiu LJ, Chang RZ. 2010. The origin and History of Soybean, in The Soybean: Botany, Production and Uses, Guriqbal Singh (editor), CAB International, 494 p.
Schuelter JA, Dixon P, Granger C, et al. 2004. Mining the EST databases to resolve evolutionary events in major plant species.
Genome47: 868–876.
Van K, Kim DH, Cai CM, et al.2008. Sequence level analysis of recently duplicated regions in soybean [Glycine max (L.) Merr.] genome, in DNA Research, Apr. 30, 15: 93–102.
Cite this article as:Jean-Paul Jamet, Jean-Marc Chaumet. Soybean in China: adaptating to the liberalization. OCL 2016, 23(6) D604.