Please cite this article in press as: Roohi S, Baneshi MR, Noroozi A, Hajebi A, Bahrampour A. Comparing Bayesian regression and classic zero-inflated negative binomial on size estimation of people who use alcohol. J Biostat Epidemiol. 2016; 2(4): 173-9
J Biostat Epidemiol. 2016; 2(4): 173-9.
Original Article
Comparing Bayesian regression and classic zero-inflated negative binomial on
size estimation of people who use alcohol
Sepideh Roohi1, Mohammad Reza Baneshi2, Alireza Noroozi3, Ahmad Hajebi4, Abbas Bahrampour5*
1
HIV/STI Surveillance Research Center, and WHO Collaborating Center for HIV Surveillance, Institute for Futures Studies in Health AND Department of Biostatistics and Epidemiology, School of Public Health, Kerman University of Medical Sciences, Kerman, Iran
2
Modeling in Health Research Center, Institute for Futures Studies in Health AND Department of Biostatistics and Epidemiology, School of Public Health, Kerman University of Medical Sciences Kerman, Iran
3
Psychiatrist, Iranian National Center for Addiction Studies AND Department of Neuroscience and Addiction, School of Advanced Technologies in Medicine, Tehran University of Medical Sciences, Tehran, Iran
4
Department of Psychiatric, Research Center of Addiction and Risky Behavior, Iran University of Medical Sciences, Tehran, Iran
5
Department of Biostatistics and Epidemiology, Modeling in Health Research Center, Institute for Futures Studies in Health, Kerman University of Medical Sciences, Kerman, Iran
ARTICLE INFO ABSTRACT
Received 14.03.2016 Revised 25.08.2016 Accepted 13.09.2016 Published 1.12.2016
Background & Aim: Nowadays, we have some data in different sciences which number of zeros is more than expected, such data are called zero-inflated which can be modeled by regressions for count data. Many researches have been conducted in the field of classical method on count data. Most of Bayesian analysis which is conducted for these data used zero-inflated Poisson regression. Therefore, the main purpose of this research is comparison of Bayesian and classic approaches in regression of zero-inflated negative binomial (NB) on data for determining the size estimation of people who have used alcohol more than once in last year.
Methods & Materials: This research had been in two provinces of Fars and Kerman in 2011, a sample size of each province was formed proportional to people of that province, and totally the calculated sample size was 700. Zero-inflated NB regression was fitted to the data in two Bayesian and classical methods, and then two methods have been compared. Results of Bayesian method were extracted in OpenBUGS software and through related codes in R and results of classical method were extracted in R software too.
Results: After fitting classical method, variables of province, gender, age groups, and education had been effective on identifying number of alcoholics, but in Bayesian method, three variables of gender, age groups, and education have become significant. In this research, it was specified that obtained probability intervals from Bayesian method are much Widder than classical method. Conclusion: Results of this research indicate that Bayesian method has better function than the classic. Key words:
Bayesian; Markov chain;
Monte Carlo method; Zero-inflated; Bayesian analysis
Introduction
1Nowadays researchers face count data with
* Corresponding Author: Abbas Bahrampour, Postal Address: Department of Biostatistics and Epidemiology, Modeling in Health Research Center, Institute for Futures Studies in Health, Kerman University of Medical Sciences, Kerman, Iran.
Email: [email protected]
excess zero in many sciences such as medical,
road accidents, environmental health,
environment, agricultural sciences,
of continuous response cannot be applied in analysis of count data because response variable has normal distribution in the linear regression model, this issue is not valid for count data. The most common models which are used for discrete count data are Poisson regression and NB regression. When variance of a Poisson distribution to be more than (or less than) its mean it is called overdispersion (or underdispersion). Lawless and Famoye have suggested regression models of NB and generalized poisson (GN) to solve these problems (8-10).
NB regression can solve problem of overdispersion but when number of zero to be more than expected number it cannot be solved with Poisson distributions (p) and NB; so only zero-inflated models which have two parts are useful. In these models, the first part only produces number of zero or has a distribution. The second part has Poisson distribution or NB, if each one of distributions to be used for the second part is changed, (Poisson distribution or NB) name of zero-inflated distributions is changed too (11).
In Bayesian method inference for parameters are based on the posterior distribution. Furthermore, posterior distribution is a combination of observed data or some information due to previous researches or personal experiences (belief of the researcher) which is called as prior distribution. Bayesian theory is a unique tool that is used in all
conditions and has ease of use and
interpretation. Markov chain Monte Carlo method (MCMC) method is Bayesian method that is based on a combination of Markov chain and Monte Carlo simulation. This chain eventually converges to distribution of the purpose that in fact is posterior distribution. In general, Bayesian method has some differences to the classical method: using prior distribution, using Bayesian theory in all analysis, and using posterior distribution in estimation and prediction. While in many classical estimation methods, for example, maximum likelihood, elicitation is conducted based on asymptotic
normality assumption and accuracy of
estimation is not limited to the sample size in Bayesian analysis (12).
Several researchers have been formed about classical method on count data such as alcohol consumption and its effects on strata of society such as students (13), youth, understanding social norms (14), and notice of number of the people and which one of personal and social characteristics of the population causes to identification of the people (15). Furthermore, Bayesian researchers that were conducted on this type more had been included zero-inflated Poisson (ZIP) regression. Based on what was written, the main purpose of this research is
comparison of Bayesian and classical
approaches in models of zero-inflated NB (ZINB) regression on data of identifying number of alcohol users.
In a research that was conducted by Jang et al. (16) to Bayesian analysis for model of zero-inflated regression with power prior in applications to road safety countermeasures, finally two Bayesian and change all non-Bayesian to classic approaches were evaluated. After estimation of ZIP, ZINB, NB, Poisson (P) regression models to data and extraction of confidence interval of 95%, and the highest density has been obtained from regression coefficients. It seems that ZIP model is the most acceptable model, although chance of ZINB and NB models does not show much difference together. This paper shows that length of confidence intervals of Bayesian method is less than the classical model and Bayesian approach has better function than the classical model.
In a research that Ghosh et al. (17) have conducted to Bayesian analysis of zero-inflated regression models with the aim of introducing a flexible class of these models, regression model of ZIP had been more suitable among P, NB, and ZIP models. Simulation researchers have shown that function of Bayesian method is better than the classical method on the limited samples (finite), and also it has given narrower confidence interval (16).
European countries. The used model was mixture model of repeated measurements. The study showed that Bayesian method has acted better than the classical method in terms of flexibility.
In research that has been conducted by Yu et al. (19) to evaluate comparison of Bayesian and non-Bayesian methods in toxicity incidents in clinical trials, it was specified that Bayesian approach has acted better than the non-Bayesian method to control overall toxicity rate.
Fosu et al. (20) conducted a research to compare function of Bayesian and non-Bayesian methods in evaluating communication of maternal factors and birth weight among low weight infants of Ghana on data of 10963 fertile women in age of 15-49 years old from across the country. Results of the research showed that the functions of the both methods are same, but Bayesian method has provided better estimation of low birth weight among infants of Ghana.
Methods
Data of this research based on data of national study which was to estimate size of alcohol users in 2011 (21) was used for two provinces of Fars and Kerman. Random current data have been formed from pedestrians in busy streets of cities so that each city has been divided into three regions based on socioeconomic situation. Questioning in these regions was conducted based on questionnaire. Dependent variables of this research include province (Fars and Kerman), gender of responder (male and female), age of the responder (age groups fewer than 29 years old, 30-39 years old, and more than 40 years old), respondent’s education (under diploma, diploma, diploma to bachelor, and postgraduate) and respondent’s marital status (married and single), and the dependent variable is number of people who identify alcohol users in the previous year (one time or more). In this research, Bayesian and classic models of zero-inflated NB regression were fitted to data. Then function of Bayesian method was evaluated with the classical method.
Convergence: MCMC is based on a
combination of Markov chain and Monte Carlo estimation which eventually converges to the
target distribution (the posterior distribution). If a chain becomes convergent means the produced sample from the target distribution has been obtained correctly. In this regard, three methods were used including: (1) monitoring Monte Carlo error, (2) monitoring autocorrelation, (3) drawing trace plot, and (4) evaluation of Gelman-Rubin statistics.
First method - this method to evaluate convergence of monitoring Monte Carlo error and its low values show that the intended value has been calculated with accuracy.
Second method - this is monitoring on autocorrelation, high or low values of that show that convergence is in order of big or small. When the chain converges exactly, autocorrelation will be very small, and in the ideal mode, it can be said that it is free of correlation.
Third method is monitoring on trace plot or time series plot. Trace plot has been formed from two vertical and horizontal axes. Its vertical axis is repetition, and horizontal axis is produced values. If a chain reaches to convergency, this plot becomes centralized around a constant average. In general, it can be said that all values should be in an area without strong cyclic periods and without trend to be struck the convergence assumption (22).
Fourth method is diagnosis statistic of
convergence of Gelman-Rubin that was
suggested for the first time as the univariate statistic. However, it can be used for models more than double chains. If this value to be close to 1, the convergence is struck. This mode occurs rarely in the practice. In some texts, this value is acceptable up to 1.2 (10). In this research, confidence intervals and probability intervals, standard error of coefficients and also regression coefficients of the two methods were compared.
Data have been analyzed by OpenBUGS software (version 3.2.3, Free Software Foundation Inc., Boston, MA) for Bayesian part and R for classic.
Results
that among this share of women (53.3%) were more than men (46.7%). 56.9% of people were in age group of 15-29 years old. 25.3% of people were in age group of 30-39 years old and the rest was age group of more than 40 years old. About 80% of the people were in educational groups of diploma and diploma to bachelor, and 58.9% of the participants in this research were married.
Mean ± standard deviation of number of alcohol users who participants identified them in Fars province 8.89 ± 16.95, and in Kerman province, 7.13 ± 16.43 have difference more than one unit. This average in men 12.660 ± 21.508 approximately were 8 units more than women 4.03 ± 9.22 and in married participants 10.86 ± 18.46 it was approximately 5 units more than single participants 6.100 ± 15.105. Furthermore, mean of number of alcohol users who participants identified in age group of 15-29 years old was 10.19 ± 18.51 which was the highest value in different age groups.
This mean in the under diploma grade 10.1 ± 19.9 was 8 units more than people in educational grade of up to bachelor 2.18 ± 3.59. People with diploma to bachelor 9.02 ± 18.00 and under diploma approximately have equal average. Furthermore, mean of identifying number of alcohol users for diploma people approximately was 5 units more than people with upper than bachelor.
5 million repetitions have been formed to conduct Bayesian method that 4200 samples have been existed from the model (have been avoided) and using two chains of convergence of parameters which have been evaluated through Gelman-Rubin test (R software and CODA package, version 2, Free Software Foundation Inc., Boston, MA), value of this statistics should be more than 0.975 and close to 1 by referring to the table all variables are around 1. Therefore, it was specified that all variables are convergent. Then, results of posterior distribution of parameters were extracted.
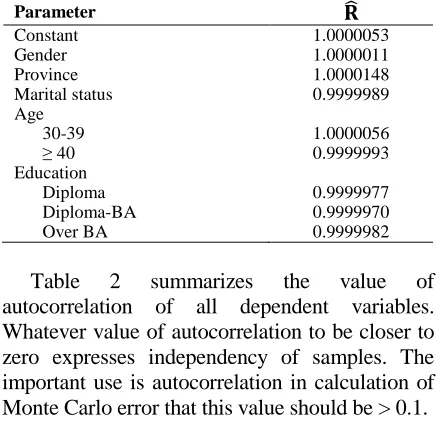
It has been expressed in the texts that value of reducing agent of potential scale or ̂ should be close to 1 but in practice, it is not possible in some cases (Table 1). Therefore, in some texts, if value of ̂ to be > 0.975 or < 1.05, 1.1, or 1.2 convergency is acceptable.
Table 1. Value of ̂ statistics to identify alcohol users
Parameter ̂
Constant 1.0000053
Gender 1.0000011
Province 1.0000148
Marital status 0.9999989
Age
30-39 1.0000056
≥ 40 0.9999993
Education
Diploma 0.9999977
Diploma-BA 0.9999970
Over BA 0.9999982
Table 2 summarizes the value of
autocorrelation of all dependent variables. Whatever value of autocorrelation to be closer to zero expresses independency of samples. The important use is autocorrelation in calculation of Monte Carlo error that this value should be > 0.1.
Table 2. Value of autocorrelation to identify number of
alcohol users
Parameter Value of autocorrelation
Constant 0.003139
Gender 0.000932
Province 0.0007604
Marital status 0.002926
Age
30-39 -0.001349
≥ 40 0.0011174
Education
Diploma 0.00031359
Diploma-BA -0.000006689
Over BA -0.000003125
Based on classic results of zero-inflated NB model, effected variables on identifying number of alcohol users who respondents knows them include: province, gender, age, and education so that it was specified that women know alcoholics 69% less than men. Citizens of Kerman province know alcohol users 22% less than citizens of Fars province.
Also report of identifying alcohol users in age group of 30-39 years old and more than 40 years old was 50% less than people under 30 years old and finally people in grades of diploma, diploma
to bachelor and upper than bachelor
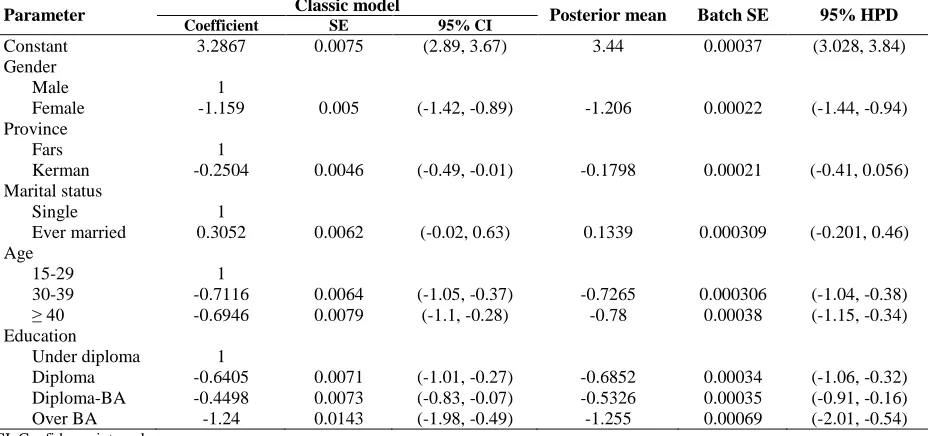
Table 3. Comparing Bayesian and classical models for alcohol users
Parameter Classic model Posterior mean Batch SE 95% HPD
Coefficient SE 95% CI
Constant 3.2867 0.0075 (2.89, 3.67) 3.44 0.00037 (3.028, 3.84)
Gender
Male 1
Female -1.159 0.005 (-1.42, -0.89) -1.206 0.00022 (-1.44, -0.94)
Province
Fars 1
Kerman -0.2504 0.0046 (-0.49, -0.01) -0.1798 0.00021 (-0.41, 0.056)
Marital status
Single 1
Ever married 0.3052 0.0062 (-0.02, 0.63) 0.1339 0.000309 (-0.201, 0.46) Age
15-29 1
30-39 -0.7116 0.0064 (-1.05, -0.37) -0.7265 0.000306 (-1.04, -0.38)
≥ 40 -0.6946 0.0079 (-1.1, -0.28) -0.78 0.00038 (-1.15, -0.34)
Education
Under diploma 1
Diploma -0.6405 0.0071 (-1.01, -0.27) -0.6852 0.00034 (-1.06, -0.32)
Diploma-BA -0.4498 0.0073 (-0.83, -0.07) -0.5326 0.00035 (-0.91, -0.16)
Over BA -1.24 0.0143 (-1.98, -0.49) -1.255 0.00069 (-2.01, -0.54)
CI: Confidence interval
Women know alcoholics 70% less than men and people of Kerman 17% less than people of Fars know alcohol users, also in age group of 30-39 years old and more than 40 years old to people > 30 years old have been reported that know alcoholics, respectively, 52% and 54% less and finally people in grades of diploma, diploma to bachelor and upper than bachelor acknowledged to know alcohol users 50%, 41%, and 70% less than people under diploma.
Results showed that variables of province, gender, and education had been effective in classical method and variables of gender, age, and education in Bayesian method.
Table 3 summarizes values of batch SE and SE of parameters of two Bayesian and classical methods related to variables of response of identifying alcohol users. Results showed that standard error of Bayesian method was less than the classical method. When the chain reached to full convergence value of batch SE becomes lower for each one of parameters. Comparing results of classic model of highest probability density intervals interval of 95% of two classical and Bayesian models have been shown in table 3. Confidence interval of 95% has been calculated based on likelihood ratio test. Whatever length of confidence interval to be narrower, a better model can be used. Length of confidence interval in
classical model in variable of alcohol response was obtained in this way: for variable of gender (0.53), province (0.5), marital status (0.65), age groups (0.68, 0.82), and education (0.74, 0.76, and 1.49). These values in Bayesian model were obtained, respectively, (0.5), (0.46), (0.66), (0.66 and 0.81) and (0.74, 0.54, and 1.47) which are lower and considered as an evidence for being better of the Bayesian model.
Discussion
The present research was formed on data of identifying number of alcoholics. In the classical
model existence of overdispersion was
variables of gender, age groups, and education have become significant.
Research of Jang et al. (16) that was formed to Bayesian analysis for regression model of zero-inflated with power prior in applications to road safety countermeasures shows that Bayesian approach has better function than the classical method. Research of Ghosh et al. (17) was formed to Bayesian analysis for regression model of zero-inflated with the target of introducing a flexible class of these models. Results of the research show that function of Bayesian method is better than the classical method. Research of Liu et al. (18) was formed to compare Bayesian and classical methods based on analysis of missing data on data of patients with schizophrenia which is a case study in clinical trials and showed that Bayesian method has acted better than the classical method in terms of flexibility.
Research of Yu et al. (19) which has been formed to evaluate comparison of Bayesian and classic methods in toxicity incidents in clinical trials, it was specified that Bayesian approach has acted better than the classic method to control overall toxicity rate. Research of Fosu et al. (20) has been formed to compare function of Bayesian and classic methods in evaluating communication of maternal factors and birth weight among low weight infants of Ghana has shown that function of both methods had been same.
Conclusion
Results of this research indicate that Bayesian method has better function than the classic.
Conflict of Interests
Authors have no conflict of interests.
Acknowledgments
We would like to thank Iranian Ministry of Health and Institute for Futures Studies in Health of Kerman University due to this data.
References
1. Bohning D, Dietz E, Schlattmann P,
Mendonca L, Kirchner U. The zero-inflated poisson model and the decayed, missing and filled teeth index in dental epidemiology. J R Stat Soc Ser A Stat Soc 1999; 162(2): 195-209.
2. Shankar V, Milton J, Mannering F. Modeling accident frequencies as zero-altered probability processes: An empirical inquiry. Accid Anal Prev 1997; 29(6): 829-37.
3. Zhou XH, Tu W. Confidence intervals for the mean of diagnostic test charge data containing zeros. Biometrics 2000; 56(4): 1118-25.
4. Agarwal DK, Gelfand AE, Citron-Pousty S. Zero-inflated models with application to spatial count data. Environ Ecol Stat 2002; 9(4): 341-55.
5. Hall DB. Zero-inflated poisson and binomial regression with random effects: A case study. Biometrics 2000; 56(4): 1030-9.
6. Heilbron D, Gibson D. Shared needle use and health beliefs concerning AIDS: Regression
modeling of zero-heavy count data.
Proceedings of the 6th International Conference on AIDS that was held; 1990 June 20-24; San Francisco, CA.
7. Lambert D. Zero-inflated poisson regression,
with an application to defects in
manufacturing. Technometrics 1992; 34(1): 1-14.
8. Famoye F. Restricted generalized poisson regression model. Commun Stat Theory Methods 1993; 22(5): 1335-54.
9. Lawless JF. Negative binomial and mixed Poisson regression. Can J Stat 1987; 15(3): 209-25.
10. Ozmen I, Demirhan H. A bayesian approach for zero-inflated count regression models by using the reversible jump markov chain monte carlo method and an application. Commun Stat Theory Methods 2010; 39(3): 2109-27.
11. Zaninotto P, Falaschetti E. Comparison of methods for modelling a count outcome with excess zeros: Application to Activities of
Daily Living (ADL-s). J Epidemiol
statistics. 2nd ed. New York, NY: John Wiley & Sons; 2013.
13. Neal DJ, Sugarman DE, Hustad JT, Caska CM, Carey KB. It's all fun and games...or is it? Collegiate sporting events and celebratory drinking. J Stud Alcohol 2005; 66(2): 291-4. 14. Steers ML, Coffman AD, Wickham RE,
Bryan JL, Caraway L, Neighbors C. Evaluation of alcohol-related personalized normative feedback with and without an injunctive message. J Stud Alcohol Drugs 2016; 77(2): 337-42.
15. Bloomfield K, Gmel G, Wilsnack S. Introduction to special issue 'Gender, Culture and Alcohol Problems: A Multi-national Study'. Alcohol Alcohol Suppl 2006; 41(1): i3-i7. 16. Jang H, Lee S, Kim SW. Bayesian analysis
for zero-inflated regression models with the power prior: Applications to road safety countermeasures. Accid Anal Prev 2010; 42(2): 540-7.
17. Ghosh SK, Mukhopadhyay P, Lu JC.
Bayesian analysis of zero-in?ated
regressionmodels. J Stat Plan Inference 2017; 136(4): 1360-75.
18. Liu GF, Han B, Zhao X, Lin Q. A Comparison of frequentist and bayesian model based approaches for missing data analysis: Case study with a schizophrenia
clinical trial. Stat Biopharm Res 2016; 8(1): 116-27.
19. Yu J, Hutson AD, Siddiqui AH, Kedron MA. Group sequential control of overall toxicity incidents in clinical trials-non-Bayesian and Bayesian approaches. Stat Methods Med Res 2016; 25(1): 64-80.
20. Fosu MO, Jackson OA, Twum SB. Bayesian and frequentist comparison: An application to low birth weight babies in Ghana. Br J Appl Sci Technol 2016; 16(2): 1-15.
21. Nikfarjam A, Shokoohi M, Shahesmaeili A,
Haghdoost AA, Baneshi MR,
Haji-Maghsoudi S, et al. National population size estimation of illicit drug users through the network scale-up method in 2013 in Iran. Int J Drug Policy 2016; 31: 147-52.
22. Toft N, Innocent GT, Gettinby G, Reid SWJ. Assessing the convergence of markov chain monte carlo methods: An example from evaluation of diagnostic tests in absence of a gold standard. Prev Vet Med 2007; 79(2): 244-56.