Int. J. Data Envelopment Analysis (ISSN 2345-458X)
Vol.7, No.2, Year 2019 Article ID IJDEA-00422, 16 pages Research Article
Application of Data Envelopment Analysis Method
to Study the Dust Phenomenon in Lorestan Province
N. Birjandi1*, S. Papi2, Z. Cheraghali3, E. Moradifard4
(1,4)
Department of Environmental Science, Faculty of Agriculture and Natural Resources, Lorestan University, Khorramabad, Iran, P.O. Box: 6813717133
(2)
Department of Mathematics, Faculty of Science, Lorestan University, Khorramabad, Iran (3)
Department of Mathematics, Faculty of Math Science, Shahid Beheshti University, Tehran, Iran
Received 15 August 2018, Accepted 21 January 2019
Abstract
Dust storm is one of the environmental threats in arid and semi-arid regions of the world like Iran which causes serious damages in these areas. Lorestan province is one of the most vulnerable western provinces exposed to dust storm. In this study, climatic parameters includes precipitation, temperature, the maximum wind speed and predominant wind direction were collected from 5 meteorological stations (Khorramabad, Borujerd, Aligudarz, Nurabad and Pol dokhtar) on the basis of monthly and annually scale during 10 years (2001-2010) and thirty dust storm systems were selected as indicator. Then, the correlation between climatic parameters and dust storms was analyzed by Data Envelopment Analysis (DEA) method. The results showed that the maximum and minimum numbers of dusty days in the study area were in 2008 and 2003, respectively. Also, Peak of dust storm frequency was recorded in July which is highly related to
temperature in semi-arid climate including Lorestan province. The DEA method along with the window analysis showed that at some of the stations examined, over time the viewing angle was lower with the passage of time and in some other places was more, the viewing angles had not changed in some stations. It was also found that the average temperature index was the most sensitive index. It is concluded that by moving from the western to the eastern parts of Lorestan province by increasing distance from neighbor countries, local dust sources has become more important than foreign sources and dust storm intensity decreased.
Keywords: Dust storm; Climatic parameters; Data Envelopment Analysis; Iran; Lorestan Province.
*. Corresponding author: Email: [email protected], [email protected]
Introduction
Nowadays dust storm is one of the most important environmental threats in arid and semi-arid regions of world. People have been naturally affected by airborne dust during previous years and have adapted themselves to it but the intensity
of this problem as an environmental
hazard has increased dramatically for residents of cities and villages during two recent decades [1]. Dust generally consists of 0.05-0.1 mm atmospheric particles can be transported thousands of kilometers at high altitude from surface ground and even effects on all cities of a country or even all countries of a continent [2]. Dust storms impact on animals and plants as severe as humans. For instant, hardening of stones, coral reefs devastating, plant growth inhibition and fruit set disorder, decreasing agricultural yield and livestock products also, reduction of sunny hours per day are environmental consequences of dust. The most serious anthropogenic impacts of dust includes air pollution, asthma occurrence and other respiration disorder, business failures, machinery problems, water pollution and digestive diseases [3]; [4]. Sahara desert, the vast desert area that covers the western parts of Mali, southern part of Algeria and eastern part of Mauritania are the main dust hotspots [5]. The western and southwestern provinces of Iran like Khuzestan, Ilam, Kermanshah and Lorestan have been largely affected by dust transported from deserts located in the northwest of Iraq, the west of Syria and the east and southeast of Saudi Arabia. Dried parts of Huge Lagoon
(Huralazim) near Iran-Iraq border and
lagoons of Khuzestan are indoor sources of dust in Iran [6]. Dust storms mainly occur in spring and summer and sometimes with less intense in fall and winter. The main factor in dust borne is wind speed. As wind speed increases over erosion threshold speed, significant amount of particles arise from deserts and
researchers illustrated that high temperature, low precipitation, poor vegetation and high speed winds provide substrate for happening dust storm [15]; [16] found that dust borne is affected by climatic conditions, ground vegetation and soil moisture [16]. Cheng and Feng. [17] in the research regarding "numerical simulation and synoptic analysis of dust emission and transport in East Asia" showed that a dust storm may develop when a synoptic system moves to deserts of the northeast Asia with a surface wind speed exceeding 6 m s− 1. Liu and Park [18] studied impacts of dust storms on air pollution in large cities like China. Meshat and Avad [19] by studying effects of synoptic patterns on numbers of dusty days identified two different meteorological systems (high and low pressure) in the western and southern parts of Saudi Arabia. Sang et al. [20] by surveying the temporal and spatial changes of springtime dust storm in the northern China found that the maximum numbers of dust storms occur in deserts of study area. They also showed that dust diffusion decreased in spring. Alijani [21] expressed Khuzestan has more than fifty dusty days annually by plotting the temporal and spatial maps of dust in Iran. Studies of Farajzadeh and Alizadeh [22] showed that Zabol station had the maximum numbers of dusty days. They reported that the maximum and minimum numbers of dusty days were recorded in June and December, respectively. Ansari Renani [2] investigated the correlation of dust storm with different climatic parameters and found that the maximum and minimum correlation of dust borne were observed with wind speed and humidity, respectively. Yarahmadi et al. [23] studied the effects of meteorological
changes on dust storm in the western and southern parts of Iran and found that numbers of dusty days increase in recent years by decreasing precipitation and enhancing temperature and wind speed by studying on chronological changes of dust storms in Khorramabad reported that of dust storm is increasing dramatically at Khorramabad station and happening in nearly all months of year and all seasons except winter [24]. Considering the importance of dust storm phenomenon and also limited studies about it in Lorestan province, the present study was conducted to investigate the relationship between climatic parameters and dust occurrence by DEA method in Lorestan province as one of the most susceptible provinces to dust borne.
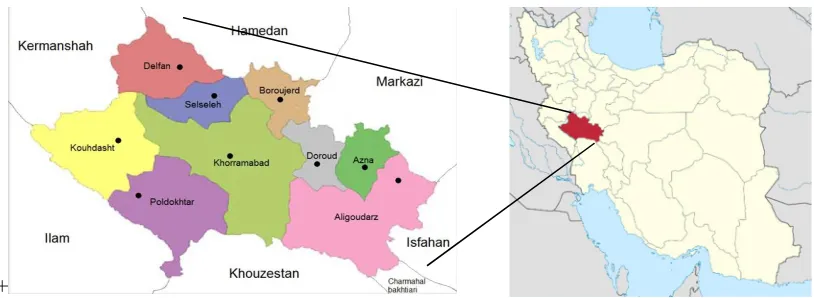
Materials and Methods (Study area) The study area located in Lorestan province (east of 46° 51′ to 50° 30′ longitude and north of 32° 37′ to 34° 22′ latitude), situated in the western part of Iran with a total area of 28559 km2 (Fig. 1). Lorestan has 4 different seasons meteorologically, diversity in seasons is observed from the north to the south and the west to the east as cold snowy weather in north and mild rainy weather in south happen simultaneously. Recorded difference of the maximum and minimum absolute temperature in different cities of Lorestan reaches more than 80 ºC. The maximum and minimum absolute temperature in Lorestan were recorded 47.4 ºC and -36 ºC, respectively. Lorestan has the third place after Gilan and Mazandaran in annual precipitation with 550 mm of rainfall equivalent annually.
+
Fig 1. Situation of Lorestan province
Meteorological stations
Four different climatic parameters including precipitation, temperature, the maximum wind speed and predominant wind direction were selected from 5 synoptic meteorological stations due to their most important role in causing dust phenomenon. The stations were selected based on covering the entire province. The geographical characteristics of the meteorological stations was shown in Table 1.
Data analysis
Considering the fact that decreasing precipitation and enhancing temperature increase susceptibility of dust particles to lift from dried soils by wind. After selecting the station and obtaining climatic parameters information from the General Meteorological Office of Iran, the annual and seasonal trends of four parameters of temperature, precipitation, the maximum wind speed and predominant wind direction were investigated using Excell 2016 software. Then DoMarton dryness coefficient was
calculated using Formula 1 and annual climate was determined based on Table 2 for each station. Eventually, final model for dust storm analysis was presented using DEA method.
I = (1)
Formula 1 as:
Where I = dryness coefficient, P = annual precipitation, and T = annual temperature.
The DEA model
The data envelopment analysis method is a non-parametric method for calculating the performance of the data. The Data envelopment analysis models are divided into two categories input-oriented or output-oriented. In this research, the output-oriented multiple BCC model was used to evaluate the performance of Decision-Making Units (DMU). The calculation process is as follows:
∑ −
S.T ∑ − ∑ + ≤ 0
∀ (Model 1)
∑ = 1
Table 1. The longitude and latitude of synoptic stations in the study area
Station Longitude (degree) Latitude (degree) Altitude (meter)
Khorramabad 48.17 33.26 1147
Borujerd 48.45 33.55 1629
Aligudarz 49.42 33.24 2022
Nurabad 48.00 34.30 1851
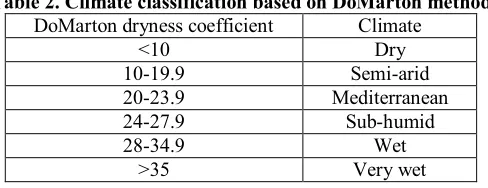
Table 2. Climate classification based on DoMarton method
DoMarton dryness coefficient Climate
<10 Dry
10-19.9 Semi-arid
20-23.9 Mediterranean
24-27.9 Sub-humid
28-34.9 Wet
>35 Very wet
Where n is the number of DMUs whose performance is computed (j = 1, 2, ..., n), are inputs and are outputs of the model. It should be noted that the BCC model used in this study was accompanied by a window analysis. A window analysis examines the efficiency changes of the units under evaluation over a given time period. This kind of analysis is useful when the number of evaluation units is low compared to the number of indicators. In a window analysis, each DMU in each year is assumed as one DMU. This analysis is as follows:
W = k-p + 1, np (2)
Where n is the number of DMUs, p, the length of the window (p≤k), np the number of units under evaluation in each window, k the number of periods of time examined and w represents the number of windows.
Results and Discussion
Investigation periodic changes of dust occurrence in the study area
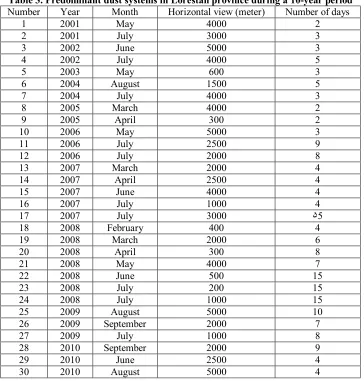
To investigate the state of dust all around the province, statistics of dusty days were collected from Iran Meteorological Organization during the 10-year period. Dusty day mean the day abounding with dust as horizontal visibility becomes below 10 km and wind speed reaches to 15 m s-1 or even more [8]. Accordingly, thirty effective dust systems with less
Table 3. Predominant dust systems in Lorestan province during a 10-year period
Number Year Month Horizontal view (meter) Number of days
1 2001 May 4000 2
2 2001 July 3000 3
3 2002 June 5000 3
4 2002 July 4000 5
5 2003 May 600 3
6 2004 August 1500 5
7 2004 July 4000 3
8 2005 March 4000 2
9 2005 April 300 2
10 2006 May 5000 3
11 2006 July 2500 9
12 2006 July 2000 8
13 2007 March 2000 4
14 2007 April 2500 4
15 2007 June 4000 4
16 2007 July 1000 4
17 2007 July 3000 ۵5
18 2008 February 400 4
19 2008 March 2000 6
20 2008 April 300 8
21 2008 May 4000 7
22 2008 June 500 15
23 2008 July 200 15
24 2008 July 1000 15
25 2009 August 5000 10
26 2009 September 2000 7
27 2009 July 1000 8
28 2010 September 2000 9
29 2010 June 2500 4
30 2010 August 5000 4
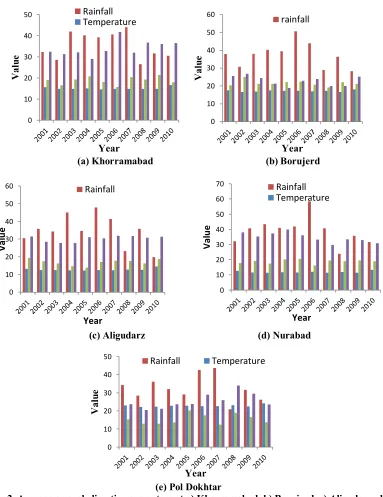
Average annual amount of climatic parameters at the study stations
Average amount of climatic parameters (precipitation, temperature, the maximum wind speed and predominant wind direction) recorded during 10 years at five meteorological stations (including Khorramabad, Borujerd, Aligudarz, Nurabad, and Pol dokhtar) are shown in Fig 2. Data illustrated that while temperature trend was uniform at all study stations, precipitation trend had fluctuation during 10 years. It is observed that the minimum precipitation and the maximum dusty days were recorded in 2008. Abdoveis et al. [27] by investigating effects of precipitation on dust borne in Khuzestan province
Khuzestan province (The South). Average wind speeds during 10 years were 23, 34, 30, 35, and 26 m s-1 at Khorramabad, Borujerd, Aligudarz, Nurabad, and Pol dokhtar stations, respectively which were upper the threshold speed (15 m s-1) at all
study stations. Average wind speed in 2008 with the maximum numbers of dusty days during a 10-year period was recorded 31 m s-1 which was upper the threshold speed.
(a) Khorramabad (b) Borujerd
(c) Aligudarz (d) Nurabad
(e) Pol Dokhtar
Fig 2. Average annual climatic parameters at a) Khorramabad, b) Borujerd, c) Aligudarz, d) Nurabad, and e) Pol dokhtar stations
0 10 20 30 40 50
V
al
u
e
Year
Rainfall Temperature
0 10 20 30 40 50 60
V
al
u
e
Year
rainfall
0 10 20 30 40 50 60
V
a
lu
e
Year
Rainfall
0 10 20 30 40 50 60 70
V
al
u
e
Year
Rainfall Temperature
0 10 20 30 40 50
V
al
u
e
Year
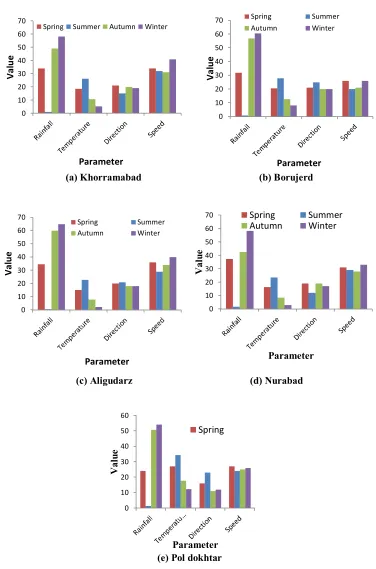
Average amount of climatic parameters during season at the study stations Average amount of climatic parameters including precipitation, temperature, the maximum wind speed and direction of predominant wind during season at the study stations are shown in Fig 3. The minimum precipitations at all stations were recorded in summer that showed significant difference with other seasons. It is concluded that the minimum precipitation and the maximum temperature had positive correlation with the maximum numbers of dusty days. Therefore, inner parts of Lorestan and near provinces like Khuzestan were defined as dust hotspots in summer because of decreasing soil moisture enhances ability of soil particles to transfer [8]. So dust storms entered into Khuzestan province, located in the southwest of Lorestan province, intensified in dried lagoons of Khuzestan and the western and eastern parts of Karkhe River and moved indoor dust particles to other regions [7]. Average wind directions at Khorramabad station during a 10-year period were recorded 213, 245, 198, and 201 degree in spring, summer, fall and winter, respectively. The direction of predominant wind at Khorramabad station was the southwest. Average wind directions in spring, summer, fall and winter were 213, 153, 195, and 191 degree, respectively at Borujerd and 187, 122, 194, and 174 degree at Aligudarz stations. Average wind direction were 188 degree (with the south direction) at Borujerd and 169 degree (with the southeast direction) at Aligudarz stations for all seasons. Average wind directions measured in
(a) Khorramabad (b) Borujerd
(c) Aligudarz (d) Nurabad
(e) Pol dokhtar
Fig 3. Average amount of climatic parameters during season at a) Khorramabad, b) Borujerd, c) Aligudarz, d) Nurabad, and e) Pol dokhtar
0 10 20 30 40 50 60 70
V
al
u
e
Parameter
Spring Summer Autumn Winter
0 10 20 30 40 50 60 70
V
a
lu
e
Parameter
Spring Summer
Autumn Winter
0 10 20 30 40 50 60 70
V
a
lu
e
Parameter
Spring Summer
Autumn Winter
0 10 20 30 40 50 60 70
V
al
u
e
Parameter
Spring Summer
Autumn Winter
0 10 20 30 40 50 60
V
al
u
e
Parameter
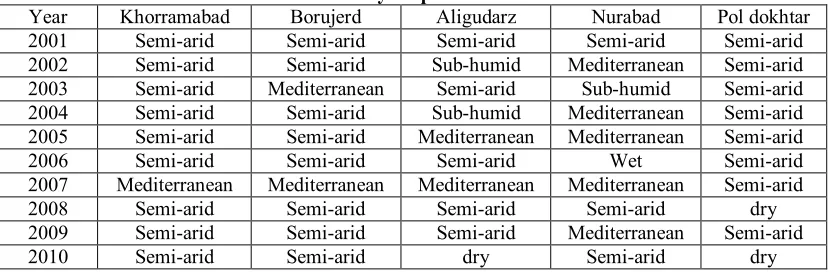
Table 4. Climate determination at different meteorological stations in the study area during a 10-year period
Year Khorramabad Borujerd Aligudarz Nurabad Pol dokhtar
2001 Semi-arid Semi-arid Semi-arid Semi-arid Semi-arid
2002 Semi-arid Semi-arid Sub-humid Mediterranean Semi-arid 2003 Semi-arid Mediterranean Semi-arid Sub-humid Semi-arid 2004 Semi-arid Semi-arid Sub-humid Mediterranean Semi-arid 2005 Semi-arid Semi-arid Mediterranean Mediterranean Semi-arid
2006 Semi-arid Semi-arid Semi-arid Wet Semi-arid
2007 Mediterranean Mediterranean Mediterranean Mediterranean Semi-arid
2008 Semi-arid Semi-arid Semi-arid Semi-arid dry
2009 Semi-arid Semi-arid Semi-arid Mediterranean Semi-arid
2010 Semi-arid Semi-arid dry Semi-arid dry
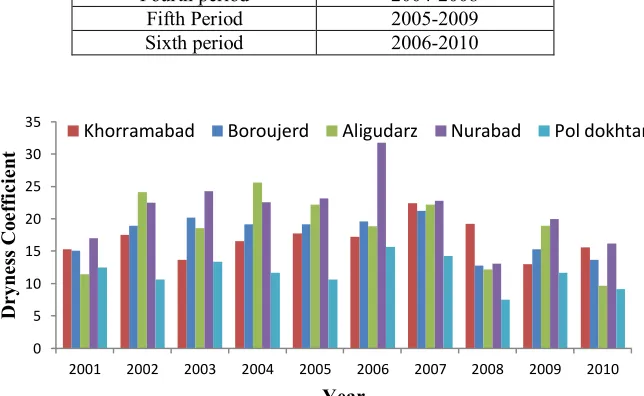
Semi-arid climate is the predominant climate in Lorestan province. But Mediterranean and humid climates were observed at Aligudarz and Nurabad stations in some years. Table 4 illustrated that the maximum and minimum dryness coefficients were calculated at Nurabad (in 2006) and Pol dokhtar (in 2008) stations. The lower dryness coefficient became, climate tend to become dryer as arid and semiarid climates showed the lower dryness coefficients and humid and wet climates were observed in stations with higher dryness coefficients. Generally, by moving from the southern and the western parts of the province to north and east parts, humidity increased and temperature decreased in consequence of mountains and going through higher longitude. Zandi [28] found the same results by climate determination in Khorasan Razavi province using DoMarten method.
Investigation of the relationship between dust phenomena and climatic parameters using DEA
The research community in this applied study was the 5 meteorological stations in Lorestan province. Information was compiled through library documentation, Internet sites, statistics management and information technology of the meteorological organization of the province during the period from 2001 to 2010. Using the Analytical Hierarchy
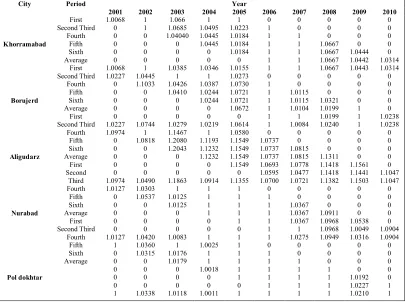
viewing angle, fixed slope, indicating that the viewing angle do not change and the negative slope of diagram indicates that the viewing angle is bad at the station under study. As you can see, the Nurabad station has a slope of ascension during the period from 2006 to 2008, indicating that the viewing angle is increasing. Pol dokhtar Station has a constant slope during the years 2006 to 2008 indicating that the viewing angle of the station has not changed during the mentioned time period. Also, Khorramabad Station has a slope of descending in the years 2003 to 2006, which indicates that the viewing angle of the station is decreasing in the mentioned years. In order to achieve this goal, which indicator is more critical at each station, that means this indicator more effects on the angle of view, the data of a station in the mentioned 10 years was examined. In the method when the number of units under investigation is less
than 3 times than the sum of the input and output indicators, in order to achieve a better result, the unit under investigation can be removed from the data set when the model is executed, which in fact results It is called the super efficiency, and as a result, the Model 1 turns out as follows:
∑ −
S.T ∑ − ∑ + ≤ 0
∀ ≠ (Model 2)
∑ = 1
The weights u1 to u2 are related to the indicators, as shown in Table 7, and, as can be seen, the average temperature indicator is more sensitive for evaluating climatic conditions. Then, the total weight for each index was calculated at each station during these 10 years. The results are shown in Table 8 and whatever the total weight be larger, it is more affected on the viewing angle.
Table 5. The considered time periods in the window analysis
Years Periods
2001-2005 First period
2002-2006 Second period
2003-2007 Third Period
2004-2008 Fourth period
2005-2009 Fifth Period
2006-2010 Sixth period
Fig 4. Dryness coefficient at different meteorological stations in the study area during 10-year period
0 5 10 15 20 25 30 35
2001 2002 2003 2004 2005 2006 2007 2008 2009 2010
D
r
yn
e
ss
C
o
e
ffi
c
ie
n
t
Year
Fig 5. The viewing angle of the stations studied in the period of 10 years
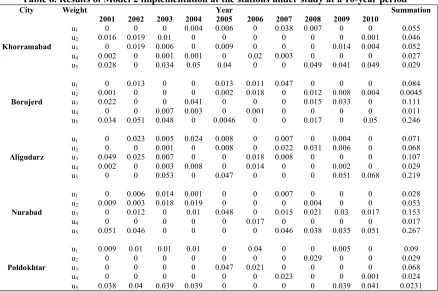
Table 6. Results of the implementation of Model 1 at the stations under study in the 10-year period
Table 7. The weights and the indicators 0.90
1.00 1.10 1.20 1.30
2001 2002 2003 2004 2005 2006 2007 2008 2009 2010
V ie w A n gl e Year
Khorramabad Aligudarz Boroujerd
Year Period City 2010 2009 2008 2007 2006 2005 2004 2003 2002 2001 0 0 0 0 0 1.0314 1.0314 0 0 0 0 0 1.0238 1.0238 0 0 0 0 0 1.1047 1.1047 0 0 0 0 0 1.0904 1.0904 0 0 0 0 0 1 1 0 0 0 0 1.0444 1.0442 1.0443 0 0 0 0 1 1 1 0 0 0 0 1.1561 1.1441 1.1503 0 0 0 0 1.0538 1.0049 1.0316 0 0 0 0 1.0192 1.0227 1.0210 0 0 0 1.0667 1.0667 1.0667 1.0667 0 0 0 1.0321 1.0199 1.0199 1.0240 0 0 0 1.1311 1.1418 1.1418 1.1382 0 0 0 1.0911 1.0968 1.0968 1.0949 0 0 0 1 1 1 1 0 0 1 1 1 1 1 0 0 1.0115 1.0115 1.0104 1 1.0084 0 0 1.0815 1.0815 1.0778 1.0477 1.0721 0 0 1.0367 1.0367 1.0367 1 1.0275 0 0 1 1 1 1 1 0 1 1 1 1 1 1 0 1 1 1 1 1 1 0 1.0737 1.0737 1.0737 1.0693 1.0595 1.0700 0 1 1 1 1 1 1 0 1 1 1 1 1 1 1 1.0223 1.0184 1.0184 1.0184 0 1.0155 1.0273 1.0730 1.0721 1.0721 1.0672 0 1.0614 1.0580 1.1549 1.1549 1.1549 1.1549 0 1.1355 1 1 1 1 1 0 1 1 1 1 1 1 0 1 1 1.0495 1.0445 1.0445 0 0 1.0346 1 1.0387 1.0244 1.0244 0 0 1.0219 1 1.1193 1.1232 1.1232 0 0 1.0914 1 1 1 1 0 0 1 1.0025 1 1 1.0018 0 0 1.0011 1.066 1.0685 1.04040 0 0 0 1.0385 1 1.0426 1.0410 0 0 0 1.0279 1.1467 1.2080 1.2043 0 0 0 1.1863 1 1.0125 1.0125 0 0 0 1.0083 1 1.0176 1.0179 0 0 0 1.0118 1 1 0 0 0 0 1 1.0445 1.1033 0 0 0 0 1.0744 1 1.0818 0 0 0 0 1.0490 1.0303 1.0537 0 0 0 0 1.0420 1.0360 1.0315 0 0 0 0 1.0338 1.0068 0 0 0 0 0 1.0068 1.0227 0 0 0 0 0 1.0227 1.0974 0 0 0 0 0 1.0974 1.0127 0 0 0 0 0 1.0127 1 0 0 0 0 0 1 First Second Third Fourth Fifth Sixth Average First Second Third Fourth Fifth Sixth Average First Second Third Fourth Fifth Sixth Average First Second Third Fourth Fifth Sixth Average First Second Third Fourth Fifth Sixth Average Khorramabad Borujerd Aligudarz Nurabad Pol dokhtar Weights Indicators u1 Aridity index u2
Average wind speed
u3
Average wind direction
u4
Average precipitation
u5
Table 8. Results of Model 2 implementation at the stations under study at a 10-year period
Conclusion
Dust storm as an important environmental threat impacts on residents in the western and southwestern parts of Iran by decreasing solar radiation and vegetative growth. Lorestan province in the western part of Iran has been influenced by suspended dust in the atmosphere. The objective of present study was to evaluate the effects of climatic parameters (including precipitation, temperature, the maximum wind speed and direction of predominant wind) on dust storm occurrence in Lorestan province. Results showed that the maximum and minimum numbers of dusty days during a 10-year period were recorded in 2008 and 2003, respectively. It is also concluded that the maximum and minimum dust storm occurrence were observed in Pol dokhtar (in the west) and Aligudarz (in the east) cities, respectively. Considering the fact that dust storm intensity decreases by moving from the west (location of indoor
dust hotspot like dried lagoons of Khuzestan and outdoor dust sources like the northern deserts of Saudi Arabia, the south of Iraq and the east of Syria) toward the east, frequency of dust occurrence were varied in different cities of Lorestan province based on the geographic position of cities. The maximum and minimum numbers of dusty days per year were recorded in June and February, respectively. Taking importance of air dryness as an effective factor on dust borne into account, it is reasonable that dust storm frequency is more in warmer period of time. Therefore, it is assumed that the main dust borne sources in Lorestan province are indoor. Climatic determination showed that climate changes (including diminishing precipitation and increasing temperature) in recent years changed the predominant climate in the southern and western parts of the study area to semiarid. The maximum and minimum fluctuation in
References
[1] Anselin L, Syabri I, Kho Y (2009) An Introduction to Spatial Data Analysis. In Fischer MM, Getis A (eds) Handbook of applied spatial analysis, Berlin, Heidelberg and New York, Springer.
[2] Ansari Renani M (2011) Statistic alanalysis of climatic dust Zahedan province during the period 1986-2005, The first international congress of dust phenomena and its harmful effects, Ahwaz, Iran (in Persian)
[3] Marsafari M, Asoudor M, Qurdi S (2011) The causes of dust phenomena and its consequences in the agricultural sector, The First International Congress on the Dust and the Critical Impact of It, Ahvaz, Iran, February 26-28.
[4] Nowzar M, Tavakoli K, Nasori M (2011) Investigation of Economic Damage of Agricultural Drought and Fossils on Plant Production in Bushehr Province. The first international congress of dust phenomena and counteracting its harmful effects. Ahwaz, Iran (in Persian)
[5] Darwishi Blurani A, Nabavi O, Azizi R, Dehghani M (2011) Determining the centers of dust in the western middle of Iran using remote sensing techniques, wind interception and environmental characteristics of the region. The International Congress on Dust and Dangerous Disasters, Ramin University of Agriculture and Natural Resources. February 26-28, Iran (in Persian)
[6] Turkashvand M, Kayani Gh (2017) Analysis of Air Pollution Situation Due to the Climatic Effects of Fragrances and Hurricanes in the Southern Regions of Hamadan Province. Journal of Environmental Science and Technology, 19 (4).
[7] Atay H, Ahmadi F (2010) Study of dust as one of the environmental problems of the Islamic world. Case study of Khuzestan province. The Fourth International Congress of Geographers of the Islamic World. Zahedan 138.
[8] Mehrabi Sh, Soltani S, Jafari R (2015) Investigation of the relationship between climatic parameters and occurrence of microcosms (Case study: Khuzestan province). Journal of Agricultural Science and Technology of Agriculture and Natural Resources, Water and Soil Science, 19 (71).
[9] Charnes A, Cooper W.W, Rhodes E (1978) Measuring the efficiency of DMUs European, Journal of Operational Research, 429-444.
[10] Banker R.D, Charnes A, Cooper W.W (1984) Some models for estimating technical and scale inefficiencies in data envelopment analysis. Management Science, 30, 1078-1092.
[11] Han Y, Long C, Geng Z, Zhang K (2018) Carbon emission analysis and evaluation of industrial departments in China: An improved environmental DEA cross model based on information entropy. Journal of Environmental Management, 205, 298-307.
[12] Huan J, Ren J, Xu M (2013) Study on performance evaluation of CO2 emission reduction in China based on three-stage DEA. J. Res. Sci. 35 (7), 1447-1454.
[14] Zhu Z, Wang K, Zhang B (2014) Applying a network data envelopment analysis model to quantify the eco-efficiency of products: a case study of pesticides. J. Clean. Prod. 69, 67-73.
[15] Yoshino M (2002) Climatology of yellow sand (Asian sand, Asian dust or Kosa) in East Asia. Science in china series dearth. Science 45, 59-70.
[16] Li N, GU W (2004) Threshold value response of soil moisture to dust storms. Functioning and management. Cambridge universe- a case study of Midwestern of Inner Mongolia. Journal of Nat. Disast.13 (1): 44-49.
[17] Feng Q, Cheng K (2002) Storms in China: A case study of dust storm varation and dust characteristics, Bull Eng Geol Env 61, 61.
[18] Liu G, Park U (2007) The logarithm-linear relationship of the occurrence frequency to the duration of sand- dust storm: Evidence from observational data in china, Journal of Arid Environments, 71: 243-249.
[19] Avad A; Mashat A.W (2014) The Synoptic Patterns Associated with Spring Widespread Dusty Days in Central and Eastern Saudi Arabia, Atmosphere, 5, (4):889-913.
[20] Sang H, Zhang K, Piao, Sh, Wan Sh (2016) Spatial and temporal variations of spring dust emissions in northern China over the last 30 years, Atmospheric Environment, 126: 117–127.
[21] Alijani B (2005) Iran's Weather, Second Edition, Payame Noor University Press, Tehran (in Persian)
[22] Farajzadeh M, Alizadeh Kh (2011) Time and location analysis of storm dust
in Iran, planning and Space arrangement, 15 (1). 65-84.
[23] Yarahmadi D, Nasiri B, Khashkish A, Nikbakht H (2014) Effect of climate fluctuations on occurrence of dust phenomena (case study of dust and dust in west and southwest of Iran), ecosystem engineering in desert, 5, 19-28.
[24] Ghavidel Y, Farajzadeh Lashani Zand M (2018) Analysis of Time Changes in Khorramabad Dust and Hurricanes, Journal of Applied Geosciences Research, eighteenth year, 15.
[25] Farajzadeh M, Razi M (2011) Investigation of temporal and spatial distribution of storms and winds in Iran. Watershed research. 91, 22-23.
[26] Jafarpour E (1998) Climatology, Fourth Edition, Tehran University Press (in Persian)
[27] Abdoveis S, Zakeri F, Hosseini Niri Rad M, Bastard N (2011) Investigating the effect of rainfall reduction on frequency of occurrence of dust phenomenon in Khuzestan province, The first international congress on dust phenomena and its harmful effects. Ahwaz, Iran (in Persian)