IJE TRANSACTIONS A: Basics Vol. 31, No. 7, (July 2018) 1066-1073
Please cite this article as: M. Ebrahimi, R. Tavakkoli-Moghaddam, F. Jolai, Bi-objective Build-to-order Supply Chain Problem with Customer Utility, International Journal of Engineering (IJE), IJE TRANSACTIONS A: Basics Vol. 31, No. 7, (July 2018) 1066-1073
International Journal of Engineering
J o u r n a l H o m e p a g e : w w w . i j e . i rBi-objective Build-to-order Supply Chain Problem with Customer Utility
M. Ebrahimia, R. Tavakkoli-Moghaddam*b, c, F. Jolaib
a Department of Industrial Engineering, Albourz Campus, University of Tehran, Tehran, Iran b School of Industrial Engineering, College of Engineering, University of Tehran, Tehran, Iran c LCFC, Arts et Métiers Paris Tech, Metz, France
P A P E R I N F O
Paper history:
Received 18 September 2017
Received in revised form 24 December 2017 Accepted 9 March 2018
Keywords: Build-to-order Bi-objective Model Supply Chain Customer Utility
Multi-objective meta-heuristics
A B S T R A C T
Taking into account competitive markets, manufacturers attend more customer’s personalization. Accordingly, build-to-order systems have been given more attention in recent years. In these systems, the customer is a very important asset for us and has been paid less attention in the previous studies. This paper introduces a new build-to-order problem in the supply chain. This study focuses on both manufacturer's profit and customer's utility simultaneously where demand is dependent on customer's utility. The customer's utility is a behavior based upon utility function that depends on quality and price and customer's preferences. The new bi-objective non-linear problem is a multi-period, multi-product and three-echelon supply chain in order to increase manufacturer's profit and customer's utility simultaneously. Solving the complicated problem, two multi-objective meta-heuristics, namely non-dominated ranked genetic algorithm (NRGA) and non-non-dominated sorting genetic algorithm (NSGA-II), were used to solve the given problem. Finally, the outcomes obtained by these meta-heuristics are analyzed
doi: 10.5829/ije.2018.31.07a.09
NOMENCLATURE
Backordered inventory cost for product p at period t
𝐶𝐵𝑃𝑡
Indices
Cost associated product p in period t
𝐶𝑃𝑡 Suppliers
𝑣
Capacity for producing component n
𝑁𝑈𝑛 Raw materials
𝑟
Capacity for producing product p
𝑃𝑈𝑝 Final products
𝑝
Maximum procurement capacity of supplier v for raw material r at period t
𝑅𝑆𝑈𝑟𝑣𝑡 Components
𝑛
Maximum inventory capacity for raw material r at period t
𝑅𝐼𝑈𝑟𝑡 Customers
𝑗
Maximum inventory capacity of component n at period t
𝑁𝐼𝑈𝑛𝑡 Periods
𝑡
Type or customer preferences for customer j
𝑣j Parameters
Decision Variables Anticipated demand of product p at period t
𝐷𝑝𝑡^
Amount of procurement of raw material r by supplier v in period t
𝑅𝑇𝑄𝑟𝑣𝑡 Real demand of product p at period t
𝐷𝑝𝑡
Inventory level for raw material r in period t
𝑅𝐼𝐿𝑟𝑡 Anticipated demand for component n in period t
𝐷𝑁𝑛𝑡
Amount of manufactured component n in period t
𝑁𝑄𝑛𝑡 Unit purchasing cost for supplier v to procure raw material
r at period t
𝑅𝐶𝑟𝑣𝑡
Inventory level for component n in period t
𝑁𝐼𝐿𝑛𝑡 Proportion of raw material r needed for each component n
𝛾𝑛𝑟
Amount of product p manufactured in period t
𝑄𝑃𝑝𝑡 Inventory holding cost for raw material r at period t
𝑅𝐻𝐶𝑟𝑡
1 if customer j chooses product p in period t, 0 otherwise 𝑋pjt
Fabrication cost of component n in period t
𝑁𝐶𝑛𝑡
Price of product p in period t
𝑊pt Inventory cost for component n in period t
𝑁𝐻𝐶𝑛𝑡
Quality of product p in period t
𝑈pt Units of n required per unit of product p
𝜇𝑝𝑛
Backorder of product p in period t
𝐵𝑝𝑡 Manufacturing cost of product p in period t
𝐶𝑃𝑝𝑡
1. INTRODUCTION
The integrated supply chain with the suitable network design helps the management reducing their costs and leads to success and efficiency [1]. On the other hand, customization and related systems are growing owing to competition on the rise. Especially, a build-to-order (BTO) supply chain is taken into account because of several companies’ success, such as Dell and BMW [2]. It is a pull system that begins with a customer demand. The system compounds specifications of both assemble-to-order (ATO) and make-assemble-to-order (MTO) strategies. Standard parts and sub-assemblies are produced relying on the short-term forecast, while a final assembly of products is initiated after taking orders and determining detailed product specification [3]. There are two benefits to pursue BTO processes. Firstly, BTO processes are guided by the product customization effectively. Customization can facilitate a match between products and customer's needs and hence enhance satisfaction and loyalty. Secondly, BTO operations help a manufacturer save cost and especially decrease inventories and warehouse space [4].
BTO and lean production have changed the market performance. BTO operations improve the marketing accountability. Thus, supply management substitutes demand management in marketing [4]. In BTO, manufacturing and marketing should be strongly linked because manufacturing begins with demand and prediction and as a result; it helps in saving the cost of these systems. On the other hand, most studies are theoretical and issues (e.g., supplier, supplier selection, proximate supply and flexibility, knowledge management and information technology) have been studied in BTO systems [5-15]. Additionally, in mathematical models, some issues (e.g., modularity and return policy [16, 17]) are considered. A few of studies considered customers in the literature. For example, Li and Chen [18] modeled a cost function based on customer's views and Li and Chen [19] presented two segments customers. Some studies modeled the BTO in the supply chain in a fuzzy programming model [20], a robust optimization model [21], two-phase problem [3, 22], in which their differences are in a solution approach mostly or had case study [23]. Therefore, one of the significant gaps in the BTO problems is that a few studies have considered the customer’s needs in a BTO system and customer’s preferences have not been modeled in a supply chain. In addition, manufacturing and customer's preferences did not consider simultaneously. Therefore, to the best of our knowledge, the manufacturing and customer's utility are studied in a supply chain simultaneously.
It is a novel issue in BTO systems coordinating the manufacturer's costs and customer's preferences that is incorporated in our model. Furthermore, in the previous
studies of the BTO, the customer and their utility have not been investigated. It is clear that the customer's utility is an important issue in this field. If managers are able to specify utility of any customers, a better answer to the customer's need can be given [4].That is why the demand will be forecasted by calculating the utility of each customer. However, one of the gaps in the BTO problems is that demands in almost all of the previous studies have been depended on lead time [24], price [25] or determined parameters [21] or decision variable [3]. The other contribution of our lecture is that forecasted demand is dependent on customer's utility. Furthermore, two objectives are considered here from which one is maximizing customer's utility. There have been many multi-objective studies on the supply chain network in the literature; however, a few of them are in a BTO environment. Chi and Chiang [2] is the only multi-objective study in the BTO literature. They proposed three objective functions including the cost, delivery, and quality. They did not consider customer's utility as an object. In this paper, a three-echelon BTO supply chain is formulated which has two objects in terms of maximizing manufacturer's profits and maximizing customer's utility in which demand is dependent on customer's satisfaction.
The rest of the paper is organized as follows. A literature review of BTO studies is presented in Section 2. Section 3 illustrates the notations and formulation of the problem. Section 4 gives solution algorithms involving NSGA-II and NRGA. Some numerical examples by using a meta-heuristic algorithm, results and some comparisons are given in Section 5. Finally, Section 6 gives conclusion and some suggestions for the future.
2. LITERATURE REVIEW
In the field of BTO, most of the studies focus on theoretical and conceptual models but only a few have mathematical formulation. For example, supplier, supplier selection, and proximate supply are theoretical issues that have been studied in BTO systems [5-10].
Moreover, flexibility has been given attention in this field [11-13], and there have been two studies as regards
with knowledge management and information
technology [14-15]. Christensen et al. [26] studied downstream BTO and upstream JIT strategy and examined the effect of them on the applied supply chain knowledge and market performance. The factors that mutually influence both of supply chain and market performances are very important. Accordingly, Sharma and Laplaka [4] noted marketing function by studying a long-term impact of adoption BTO systems on them.
1068 M. Ebrahimi et al. / IJE TRANSACTIONS A: Basics Vol. 31, No. 7, (July 2018) 1066-1073
product design in order to solve the difficulties of return policy. They entitled the benefits of BTO systems and returned policy. After three years, Konstantaras et al. [17] extended their work by getting the price of the product as a decision variable. They compared the system without return policy and the full refund policy system. Rahmani-Ahranjani et al. [27] modeled a closed-loop supply chain and presented a fuzzy bi-objective goal programming model. They also used their model in a paper industry. Li and Chen [18] modeled a cost function in a BTO environment that is based on the customer's views. Li and Chen [19] modeled by a queuing theory considering price and capacity as a decision variable in a BTO system. They suggested using this model in hospitals for the future study. Due to the uncertainty existing in reality, Demirli and Yimer [20] formulated a BTO supply chain in a fuzzy programming model that integrated production and distribution planning. They transferred the proposed model to a multi-objective linear model to solve it.
Lalmazloumian et al. [21] proposed a robust optimization model in the field of a BTO problem. Cost and demand parameters were uncertain. Yimer and Demirli [3] proposed a two-phase problem too. First, assembly and scheduling distribution are performed by receiving the customer’s order. Then based on this schedule, component and raw materials demands are determined. A genetic algorithm (GA) based on resolution process is proposed to solve this problem. Lalmazloumian et al. [22] formulated a BTO mixed-integer linear model too. They studied a computer firm. Lin and Wang [23] proposed a two-stage stochastic programming problem considering supply and demand uncertainty. They used l-shape decomposition. Pricing is a competitive decision policy. So, Lin and Wu [24] investigated a BTO manufacturing problem that determined prices and supply chain network design simultaneously to maximize profits. In their study, the demand is random and depends on the price. Furthermore, they applied l-shape decomposition. In BTO systems, assembling products will begin after receipt of order. Thus, lead time is critical. The way distribution centers are determined and how these centers are assigned to retailers influence the lead time. Therefore, Shi et al. [25] formulated a Lagrangian-based solution algorithm for the BTO supply chain, in which the demand is dependent on the lead time.
Given the breadth of BTO problems, multi-objective models may have a significant role in enhancing the quality of these issues. However, very little research has been done multi-objectively in the field of BTO. For example, Chi and Chiang [2] proposed a multi-objective mathematical model in which suppliers, product assembly, and logistics distribution system were integrated. They also used a modified Pareto genetic algorithm (MPaGA) to solve the problem and compare the results with the Pareto genetic algorithm (PaGA).
3. PROBLEM DEFINITION
This section illustrates mathematical notations, objective function, and constraints.
3. 1. Problem Statement and Assumptions As
noted earlier, this paper is a three-level centralized supply chain in a BTO environment. There are multiple suppliers, one manufacturer, and one retailer. The demand is anticipated by calculating customer's utility. In other words, market knowledge or measurement of the customer, profitability helps us to decide on demand. Thus, the price and quality influence on demand through customer satisfaction. Products intended for different quality levels, in which each product is introduced only at a level of quality of its own. Each higher level of quality has all the characteristics of the lower quality level. By increasing product index (counters), the quality level gets lower. 𝑈1> 𝑈2> ⋯ > 𝑈𝑘. So, number one product has the highest degree of quality (𝑈H= 𝑈1). Assumptions are given below:
Shortage pertaining to lost sales is allowed. The anticipated demand is dependent. The quality has different levels.
Each product is introduced only at a quality level of its own.
Potential customers depending on the type or preferences are assumed to have a normal or uniform distribution [26].
Quality and price of each product are decision variables.
Each quality level has its own related costs considering in cost function [26].
According to the BTO system, the final product inventory is not considered for retailers and manufacturers. The manufacturer has the inventories of raw materials and components.
3. 2. Mathematical Model By employing the
notations above and assumptions, the associated mathematical model can be formulated by:
𝑍1= max 𝜋 = ∑ [∑ [(𝑊𝑡 𝑝 𝑝𝑡− 𝐶𝑝𝑡). 𝑄𝑃𝑝𝑡]−
𝐶𝑅𝑡− 𝐶𝑁𝑡− 𝐶𝐶𝐵𝑡]
(1)
𝑍2= max 𝛿 = ∑ ∑ ∑ 𝐴𝑡 𝑝 𝑗 𝑗𝑝𝑡. 𝑋𝑗𝑝𝑡 (2)
s.t.
𝐶𝑝𝑡= 𝐶𝑃𝑝𝑡+ 𝐶𝑈𝑡∗ 𝑈𝑝𝑡 (3)
𝐶𝐶𝐵𝑡= ∑ 𝐶𝐵𝑝 𝑝𝑡. 𝐵𝑝𝑡 (4)
𝐶𝑅𝑡= ∑ ∑ 𝑅𝐶𝑣 𝑟 𝑟𝑣𝑡𝑅𝑇𝑄𝑟𝑣𝑡+ ∑ 𝑅𝐻𝐶𝑟 𝑟𝑡𝑅𝐼𝐿𝑟𝑡 (5)
𝑅𝐼𝐿𝑟𝑡= 𝑅𝐼𝐿𝑟,𝑡−1+ ∑ 𝑅𝑇𝑄𝑣 𝑟𝑣𝑡− ∑ 𝛾𝑛 𝑛𝑟(𝑁𝑄𝑛𝑡) (7)
𝑁𝐼𝐿𝑛𝑡= 𝑁𝐼𝐿𝑛,𝑡−1+ 𝑁𝑄𝑛𝑡− 𝐷𝑁𝑛𝑡 (8)
∑ 𝑋𝑗 𝑗𝑝𝑡. 𝑄𝑗𝑝𝑡= 𝐷𝑝𝑡^ (9)
𝐷𝑁𝑛𝑡= 𝑚𝑎𝑥{∑ 𝐷𝑝 𝑝𝑡^ . 𝜇𝑝𝑛, ∑ 𝑄𝑃𝑝 𝑝𝑡. 𝜇𝑝𝑛} (10)
𝐵𝑝𝑡= 𝐷𝑝𝑡− 𝑄𝑃𝑝𝑡 (11)
𝑅𝑇𝑄𝑟𝑣𝑡 ≤ 𝑅𝑆𝑈𝑟𝑣𝑡 (12)
𝑁𝑄𝑛𝑡≤ 𝑁𝑈𝑛 (13)
𝑄𝑃𝑝𝑡≤ 𝑚𝑖𝑛 {𝑃𝑈𝑝, 𝐷𝑝𝑡} (14)
0 ≤ 𝑅𝐼𝐿𝑟𝑡≤ 𝑅𝐼𝑈𝑟 (15)
0 ≤ 𝑁𝐼𝐿𝑛𝑡≤ 𝑁𝐼𝑈𝑛 (16)
𝑊𝑝𝑡 > 𝐶𝑝𝑡+ (
𝑄𝑃𝑝𝑡
∑ 𝑄𝑃𝑝 𝑝𝑡) × (𝐶𝑅𝑡+ 𝐶𝑁𝑡) (17)
𝑈𝑝𝑡> 𝑈𝑝+1,𝑡 (18)
𝑊𝑝𝑡 > 𝑊𝑝+1,𝑡 (19)
0 ≤ 𝑈𝑝𝑡≤ 𝑀 (20)
𝐴𝑗𝑝𝑡= 𝜗𝑗. 𝑈𝑝𝑡− 𝑊𝑝𝑡 (21)
𝑋𝑗𝑝𝑡. 𝐴𝑗𝑝𝑡≥ 0 (22)
𝑋𝑗𝑝𝑡= 0,1 (23)
𝑈𝑝𝑡, 𝑊𝑝𝑡, 𝑁𝐼𝐿𝑛𝑡, 𝑅𝐼𝐿𝑟𝑡 , 𝑄𝑃𝑝𝑡, 𝑄𝑝𝑗𝑡, 𝑁𝑄𝑛𝑡, 𝑅𝑇𝑄𝑟𝑣𝑡, 𝐵𝑝𝑡≥ 0
In the above-mentioned model, the first objective function maximizes manufacturer's profit (or entire supply chain) that will be counted as the difference between income and cost. The second objective function maximizes the customer' utility. Constraint (3) shows the total cost of each product in each period. Constraints (4) to (6) are related to the cost of shortage, the cost of raw materials and cost of components in each period, respectively. Inventory balance of raw materials and components is shown in Constraints (7) and (8), respectively. Forecasted demand is supposed to be the sum of forecasted customer's decisions (9). In other words, forecasted demand is a function of the customer’s utility, which is influenced by the quality and price. Hence, if the product p on the quality 𝑈𝑝𝑡has utility for the j-th customer, 𝑋𝑝𝑗𝑡variable has the value of one; otherwise, it has the value of zero. Component demand is determined by Constraint (10).
Shortage of the final product in each period is shown in Constraint (11). The procurement capacity for raw
materials is expressed in Constraint (12) to (14) which are related to the fabrication capacity of components and assembly or production capacity of the final product, respectively. Constraint (15) and (16) indicate the inventory capacity of raw materials and components. A sale price of product p should be higher than its cost (17). Increasing index (numerator) of products causes their quality levels to reduce which is shown in Constraint (18). A product with a higher quality level should have a higher price (19). Considering a customer with v type, the utility of customer j for product p with the specified quality level is determined by Constraint (21). Given that 𝑋𝑝𝑗𝑡 is a decision variable of customer j, who does not purchase a product, which has a negative utility stated in Constraint (22). The positive and binary variables are determined by Constraint (23).
4. PROPOSED ALGORITHMS
The accuracy of the model is validated by considering some small-sized problems solved by GAMS software using Bonmin Solver. Since GAMS software does not solve the large-sized problems, meta-heuristic algorithms are required. NRGA and NSGA-II are used for solving the model in large-sized problems. Then, their results are compared in order to identify the superior algorithm. This section explains these algorithms.
Before explanation of the algorithms, some related work is mentioned. Chan et al. [27] formulated a multi-objective supply chain problem that is solved by a non-dominated sorting genetic algorithm (NSGA-II) as a solution approach. Zhang and Chiong [28] proposed a bi-objective scheduling model and developed a multi-objective hybrid genetic algorithm (MOHGA) to solve it. Then, they compared the results with NSGA-II. Pasandideh et al. [29] formulated the supply chain network design and solved this multi-objective problem by a non-dominated ranked genetic algorithm (NRGA) and NSGA-II. Maghsoudlou et al. [30] proposed a multi-objective three-echelon supply chain problem and used the NRGA and NSGA-II as well as two other algorithms. Mosavi et al. [31] used the NRGA and NSGA-II for solving a bi-objective model. The NRGA and NSGA-II were also used for a multi-objective job shop problem [29]. Hassanzadeh et al. [32] developed two heuristic algorithms which have been assessed by multi-objective particle swarm optimization (MOPSO) and NSGA-II. Hassanzadeh et al. [33] developed a hybrid evolutionary algorithm based on PSO and GA solving integrated supply chain problem.
1070 M. Ebrahimi et al. / IJE TRANSACTIONS A: Basics Vol. 31, No. 7, (July 2018) 1066-1073
4. 2. Non-dominated Ranked Genetic Algorithm It belongs to multi-objective methods too. It is similar to NSGA-II. In the NRGA, the roulette wheel strategy is used to select parents. First, a front is selected by a roulette wheel and then a solution is chosen from the selected front by a roulette wheel too. The front that has the highest rank gets the highest selection probability and among solutions with the same rank those that have the highest crowding distance are being selected. The roulette wheel choice is repeated until the required number of solutions is chosen [31].
4. 3. Parameters Setting The parameter's optimal value applying in the NRGA and NSGA-II is demonstrated in Table 1.
5. COMPUTATIONAL RESULTS
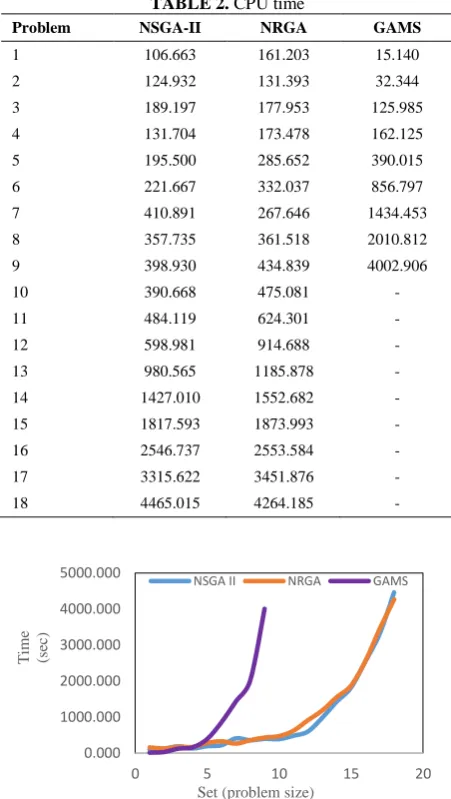
The model is solved by NSGA-II and NRGA using Matlab R2015a software with Core i7-2620M CPU @ 2.70 GHzIntel and GAMS software using different data sets to compare computational time and solution quality. The random data sets involved small-sized to large-sized problems. Table 2 shows CPU time needed to obtain an optimal solution. By increasing the size of problems, the computational time is increased as well. GAMS software can solve examples up to nine despite the fact that solving large-sized problems is impossible. Figure 1 compares computation time when meta-heuristic algorithms and GAMS software are applied. The rate of an increase in computational time for GAMS software is exponential. Meta-heuristic algorithms follow fairly a similar pattern in increasing the time by increasing the problem sizes. It is noticeable that GAMS software needs less time for small-sized problems. In other words, evolutionary structure and population features of employed algorithms make increase the time of calculations and thus computational time will be more than an exact method in small sizes. Nevertheless, with the growth in problem sizes, the efficiency of meta-heuristics is more than that of exact methods.
5. 1. Sensitivity Analyses The results for different
values of two parameters are shown in this section. Thus, the model is tested in medium sizes with different quantity of demand parameter and M parameter.
TABLE 1. Optimal value of input parameters
Parameter Optimal value
𝑛𝑝𝑜𝑝 100
𝑃𝑐 0.8
𝑃𝑚 0.1
𝑃𝑟 0.1
𝐼𝑡𝑟 100
TABLE 2. CPU time
Problem NSGA-II NRGA GAMS
1 106.663 161.203 15.140
2 124.932 131.393 32.344
3 189.197 177.953 125.985
4 131.704 173.478 162.125
5 195.500 285.652 390.015
6 221.667 332.037 856.797
7 410.891 267.646 1434.453
8 357.735 361.518 2010.812
9 398.930 434.839 4002.906
10 390.668 475.081 -
11 484.119 624.301 -
12 598.981 914.688 -
13 980.565 1185.878 -
14 1427.010 1552.682 -
15 1817.593 1873.993 -
16 2546.737 2553.584 -
17 3315.622 3451.876 -
18 4465.015 4264.185 -
Figure 1. CPU time of two meta-heuristic algorithms and
the exact method
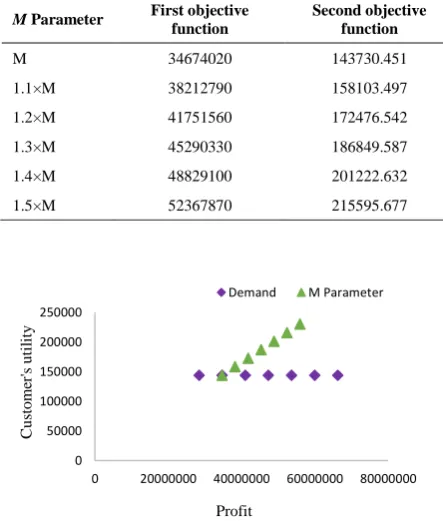
The results are reported in Tables 3 and 4 as well as Figure 2. According to Table 3, the first objective function increases with an addition in demands but does not have any influence on the second objective function because the second object is the customer's utility and an increase in demand does not have a sharp impact on it. It is notable that if demands growth exceeds twice as much as their prior value too, the current resources cannot supply them. M parameter influences both objects, an increase in M results in a growth in the first and second objects as shown in Table 4. Therefore, the highest quality has benefits for both manufacturer and customer.
5. 2. Comparison between two Algorithms Different evaluation measures are applied determining the quality of multi-objective solutions [34]. In this paper, the number of Pareto solution (NOPS), diversity
0.000 1000.000 2000.000 3000.000 4000.000 5000.000
0 5 10 15 20
T
ime (sec)
Set (problem size)
(D), mean ideal distance (MID) and CPU time are applied to compare two algorithms. Figures 3 to 6 and Table 5 show these comparison criteria. According to Figure 3, the average number of Pareto solutions of NSGA-II is higher than that of NRGA. Likewise, NSGA-II in 50% of cases has better NOPS than NRGA, while NRGA in 27.87% cases has better NOPS than the NSGA-II. However, a better performance of NRGA in the MID measurement is resulted in due to a lower average in comparison to NSGA-II. NRGA in 55.56% has a lower MID than NSGA-II too (Figure 4). NSGA-II in average has a lower diversity, but in 55.56% has a higher diversity than NRGA (Figure 5).
TABLE 3. Objective functions for different values of demands
Demand First objective function Second objective function
D-0.2×D 28367280 143730.451
D 34674020 143730.451
1.2×D 40980760 143730.451
1.4×D 47287500 143730.451
1.6×D 53594240 143730.451
1.8×D 59900980 143730.451
2×D 66207720 143730.451
2.2×D Infeasible Infeasible
TABLE 4. Objective functions for different values of M
M Parameter First objective function
Second objective function
M 34674020 143730.451
1.1×M 38212790 158103.497
1.2×M 41751560 172476.542
1.3×M 45290330 186849.587
1.4×M 48829100 201222.632
1.5×M 52367870 215595.677
Figure 2. Objective values for different values of demands
and M parameters
Figure 3. Illustrative comparison of the NOPS criterion
Figure 4. Illustrative comparison of the MID criteria
Figure 5. Illustrative comparison of the D criteria
Figure 6. Illustrative comparison of the CPU time criteria
TABLE 5. Outstanding algorithms in each criterion
Criteria Outstanding algorithm
NOPS NSGA-II
MID NRGA
D No difference
CPU Time NSGA-II
0 50000 100000 150000 200000 250000
0 20000000 40000000 60000000 80000000
C
u
st
o
me
r's
u
ti
li
ty
Profit
Demand M Parameter
0 5 10 15 20
1 2 3 4 5 6 7 8 9 10 11 12 13 14 15 16 17 18
N
O
P
S
Problem
NSGA II NRGA
0 50,000,000 100,000,000 150,000,000 200,000,000
1 2 3 4 5 6 7 8 9 101112131415161718
M
ID
Problem
NSGA II NRGA
0 50,000,000 100,000,000 150,000,000 200,000,000 250,000,000 300,000,000
1 2 3 4 5 6 7 8 9 10 11 12 13 14 15 16 17 18
D
Problem
NSGA II NRGA
0.000 1000.000 2000.000 3000.000 4000.000 5000.000
1 2 3 4 5 6 7 8 9 10 11 12 13 14 15 16 17 18
C
P
U
Problem NSGA II
1072 M. Ebrahimi et al. / IJE TRANSACTIONS A: Basics Vol. 31, No. 7, (July 2018) 1066-1073
The main reason is that the average CPU time of NSGA-II is lower than that of NRGA. A better performance of NSGA-II in term of CPU time is resulted (Figure 6).
6. CONCLUSION
In the literature of build-to-order (BTO) systems, most studies have been conceptual and theoretical, a few existing mathematical models have studied BTO in the supply chain. Also, customer’s preferences or marketing have not been considered in these systems in previous studies. What is more, the demand has been depended on lead time or has considered a certain or decision variable in past studies. Due to the importance of customers and their utility in BTO systems, the aim of this paper was to increase manufacturer's profit and customer's utility simultaneously. Furthermore, the forecasted demand was assumed to be dependent on customer's utility in this paper. This paper was the first attempt to consider manufacturer's profit and customer's utility simultaneously that is very profitable because it assists in deciding over the best price and quality. As a result, the bi-objective supply chain model was developed. It was three-echelon, multi-period and multi-product model including multiple suppliers, one manufacturer, and one retailer.
The GAMS software was used to verify the model. Non-dominated ranked genetic algorithm (NRGA), and non-dominated sorting genetic algorithm (NSGA-II) were used to find a near-optimal Pareto solution solving large-sized problems. The results indicated that in the CPU time and Pareto solution numbers, the NSGA-II was better. However, a better performance of the NRGA was concluded in the mean ideal distance measure whereas in diversity both of them showed a similar behavior. For future work, a queue model can be used in BTO systems. Different utility functions can be applied for which not only price and quality but also other factors can have some influence. To contact with customers, information technology can directly be used in BTO systems. Also, the model can be used in real problems for future work. New meta-heuristics can be used in the future studies.
7. REFERENCES
1. Ghomi-Avili, M., Tavakkoli-Moghaddam, R., Jalali, G. and Jabbarzadeh, A., "A network design model for a resilient closed-loop supply chain with lateral transshipment", International Journal of Engineering-Transactions C: Aspects, Vol. 30, No. 3, (2017), 374-383.
2. Che, Z. and Chiang, C.-J., "A modified pareto genetic algorithm for multi-objective build-to-order supply chain planning with product assembly", Advances in Engineering Software, Vol. 41, No. 7-8, (2010), 1011-1022.
3. Yimer, A.D. and Demirli, K., "A genetic approach to two-phase optimization of dynamic supply chain scheduling", Computers & Industrial Engineering, Vol. 58, No. 3, (2010), 411-422.
4. Sharma, A. and LaPlaca, P., "Marketing in the emerging era of build-to-order manufacturing", Industrial Marketing Management, Vol. 34, No. 5, (2005), 476-486.
5. Noorul Haq, A. and Kannan, G., "Design of an integrated supplier selection and multi-echelon distribution inventory model in a built-to-order supply chain environment", International Journal of Production Research, Vol. 44, No. 10, (2006), 1963-1985. 6. Nugroho, Y.K., "Production ramp up in built-to-order supply
chains", Journal of Modelling in Management, Vol. 6, No. 2, (2011), 143-163.
7. Miemczyk, J. and Howard, M., "Supply strategies for build-to-order: Managing global auto operations", Supply Chain Management: An International Journal, Vol. 13, No. 1, (2008), 3-8.
8. Lyons, A., Coronado, A. and Michaelides, Z., "The relationship between proximate supply and build-to-order capability", Industrial Management & Data Systems, Vol. 106, No. 8, (2006), 1095-1111.
9. Joshi, K., Singh, K. and Kumar, S., "Two-sided supplier-manufacturer selection in bto supply chain", Journal of Modelling in Management, Vol. 7, No. 3, (2012), 257-273. 10. Howard, M., Miemczyk, J. and Graves, A., "Automotive supplier
parks: An imperative for build-to-order?", Journal of purchasing and supply management, Vol. 12, No. 2, (2006), 91-104. 11. Engelhardt-Nowitzki, C., "Improving value chain flexibility and
adaptability in build-to-order environments", International Journal of Physical Distribution & Logistics Management, Vol. 42, No. 4, (2012), 318-337.
12. Coronado M, A.E. and Lyons, A.C., "Evaluating operations flexibility in industrial supply chains to support build-to-order initiatives", Business Process Management Journal, Vol. 13, No. 4, (2007), 572-587.
13. Salvador, F., Rungtusanatham, M., Forza, C. and Trentin, A., "Mix flexibility and volume flexibility in a build-to-order environment: Synergies and trade-offs", International Journal of Operations & Production Management, Vol. 27, No. 11, (2007), 1173-1191.
14. Chow, H.K., Choy, K.L. and Lee, W., "Knowledge management approach in build-to-order supply chains", Industrial Management & Data Systems, Vol. 107, No. 6, (2007), 882-919. 15. Sharif, A.M., Irani, Z. and Lloyd, D., "Information technology and performance management for build-to-order supply chains", International Journal of Operations & Production Management, Vol. 27, No. 11, (2007), 1235-1253.
16. Mukhopadhyay, S.K. and Setoputro, R., "Optimal return policy and modular design for build-to-order products", Journal of Operations Management, Vol. 23, No. 5, (2005), 496-506.
17. Konstantaras, I., Skouri, K. and Papachristos, S., "Optimal pricing, return and modular design policy for build-to-order (bto) products in a two parties supply chain system", IMA Journal of Management Mathematics, Vol. 22, No. 1, (2011), 1-12. 18. Li, H. and Chen, R., "Modelling cost from customer perspective
20. Demirli, K. and Yimer, A.D., "Fuzzy scheduling of a build-to-order supply chain", International Journal of Production Research, Vol. 46, No. 14, (2008), 3931-3958.
21. Lalmazloumian, M., Wong, K.Y., Govindan, K. and Kannan, D., "A robust optimization model for agile and build-to-order supply chain planning under uncertainties", Annals of Operations Research, Vol. 240, No. 2, (2016), 435-470.
22. Lalmazloumian, M., Wong, K.Y. and Ahmadi, M., A mathematical model for supply chain planning in a build-to-order environment, in Enabling manufacturing competitiveness and economic sustainability. 2014, Springer.315-320.
23. Lin, C.-C. and Wang, T.-H., "Build-to-order supply chain network design under supply and demand uncertainties", Transportation Research Part B: Methodological, Vol. 45, No. 8, (2011), 1162-1176.
24. Lin, C.-C. and Wu, Y.-C., "Optimal pricing for build-to-order supply chain design under price-dependent stochastic demand", Transportation Research Part B: Methodological, Vol. 56, (2013), 31-49.
25. Shi, J., Zhang, G. and Sha, J., "A lagrangian based solution algorithm for a build-to-order supply chain network design problem", Advances in Engineering Software, Vol. 49, (2012), 21-28.
26. Li, M., Feng, H., Chen, F. and Kou, J., "Optimal versioning strategy for information products with behavior-based utility function of heterogeneous customers", Computers & Operations Research, Vol. 40, No. 10, (2013), 2374-2386.
27. Chan, F.T., Jha, A. and Tiwari, M.K., "Bi-objective optimization of three echelon supply chain involving truck selection and loading using nsga-ii with heuristics algorithm", Applied soft computing, Vol. 38, (2016), 978-987.
28. Zhang, R. and Chiong, R., "Solving the energy-efficient job shop scheduling problem: A multi-objective genetic algorithm with enhanced local search for minimizing the total weighted tardiness and total energy consumption", Journal of Cleaner Production, Vol. 112, (2016), 3361-3375.
29. Pasandideh, S.H.R., Niaki, S.T.A. and Asadi, K., "Bi-objective optimization of a multi-product multi-period three-echelon supply chain problem under uncertain environments: Nsga-ii and nrga", Information Sciences, Vol. 292, (2015), 57-74.
30. Maghsoudlou, H., Kahag, M.R., Niaki, S.T.A. and Pourvaziri, H., "Bi-objective optimization of a three-echelon multi-server supply-chain problem in congested systems: Modeling and solution", Computers & Industrial Engineering, Vol. 99, (2016), 41-62.
31. Mousavi, S.M., Sadeghi, J., Niaki, S.T.A. and Tavana, M., "A bi-objective inventory optimization model under inflation and discount using tuned pareto-based algorithms: Nsga-ii, nrga, and mopso", Applied soft computing, Vol. 43, (2016), 57-72. 32. Ahmadi, E., Zandieh, M., Farrokh, M. and Emami, S.M., "A multi
objective optimization approach for flexible job shop scheduling problem under random machine breakdown by evolutionary algorithms", Computers & Operations Research, Vol. 73, (2016), 56-66.
33. Hassanzadeh, A., Rasti-Barzoki, M. and Khosroshahi, H., "Two new meta-heuristics for a bi-objective supply chain scheduling problem in flow-shop environment", Applied soft computing, Vol. 49, (2016), 335-351.
34. Jalali, S., Seifbarghy, M., Sadeghi, J. and Ahmadi, S., "Optimizing a bi-objective reliable facility location problem with adapted stochastic measures using tuned-parameter multi-objective algorithms", Knowledge-Based Systems, Vol. 95, (2016), 45-57.
Bi-objective Build-to-order Supply Chain Problem with Customer Utility
M. Ebrahimia, R. Tavakkoli-Moghaddamb, c, F. Jolaib
a Department of Industrial Engineering, Albourz Campus, University of Tehran, Tehran, Iran b School of Industrial Engineering, College of Engineering, University of Tehran, Tehran, Iran c LCFC, Arts et Métiers Paris Tech, Metz, France
P A P E R I N F O
Paper history:
Received 18 September 2017
Received in revised form 24 December 2017 Accepted 9 March 2018
Keywords: Build-to-order Bi-objective Model Supply Chain Customer Utility
Multi-objective meta-heuristics
هدیکچ
یشرافس هب رتشیب ناگدننکدیلوت ،یتباقر رازاب هب هجوت اب هدروآ یور یزاس
متسیس ،ورنیا زا .دنا شرافس ساسا رب تخاس یاه
هتفرگ رارق هجوت دروم رتشیب متسیس نیا رد هک ییاجنآ زا .دنا
هژیو هاگیاج یرتشم ،اه هب رتمک هتشذگ تاعلاطم رد و دراد یا
یسررب شرافس ساسا رب تخاس نیمات هریجنز دیدج لدم کی ،هلاقم نیا رد .تسا هدش هجوت نآ یم
نامزمه روط هب هک دوش
متسیس یزاس هنیهب هب یم هدننکدیلوت دوس و یرتشم تیبولطم رظنم ود زا شرافس ساسا رب تخاس یاه
هک یروط هب دزادرپ
یم یرتشم تاحیجرت و تیفیک ،تمیق زا یعبات یرتشم تیبولطم و تسا یرتشم تیبولطم هب هتسباو اضاقت دیدج لدم .دشاب
هئارا هفده ود یطخریغ هرود دنچ ،هدش
یرتشم تیبولطم و هدننکدیلوت دوس شیازفا فده اب یحطسدنچ و یلوصحمدنچ ،یا
بترم کیتنژ متیروگلا و بولغمریغ یدنب هبتر کیتنژ متیروگلا یراکتبارف شور ود زا هدافتسا اب هک تسا نامزمه روط هب
یم لح بولغمریغ یزاس یم رارق لیلحت دروم جیاتن نایاپ رد .دنوش
دنریگ .
doi: 10.5829/ije.2018.31.07a.09