organic carbon concentration in PM
2.5in the ambient air of Sina
Hospital district, Tehran, Iran
Hossein Arfaeinia1, Seyed Enayat Hashemi2, Ali Asghar Alamolhoda3, Majid Kermani4
1 Department of Environmental Health Engineering, School of Public Health, Bushehr University of Medical Sciences, Bushehr AND Iran University of Medical Sciences, Tehran, Iran
2 Department of Environmental Health Engineering, School of Public Health, Bushehr University of Medical Sciences, Bushehr, Iran
3 Institutes of Water and Energy, Sharif University of Technology, Tehran, Iran
4 Research Center for Environmental Health Technology AND Department of Environmental Health Engineering, School of Public Health, Iran University of Medical Sciences, Tehran, Iran
Abstract
In the present study, carbon species including organic carbon (OC), elemental carbon (EC), and water-soluble organic carbon (WSOC) concentration in PM2.5 were assessed at an urban site of Tehran, Iran during March to June 2014. The PM2.5 samples were collected using an frmOMNITM Ambient Air Sampler. Thermal gravimetric analysis (TGA) was used to analyze OC and EC. The results showed that PM2.5 concentrations varied from 14.32 to 74.45 µg/m3 with an average value of 41.39 µg/m3. The results also showed that carbon species varied from 5.52 to 23.21 (15.35 ± 6.05) µg/m3 for OC and 1.03 to 4.16 (2.25 ± 0.65) µg/m3 for EC. As the findings indicated, the mean PM2.5 level in the sampling area was higher than the annual average determined by the United States Environmental Protection Agency (EPA) as the ambient air quality standard. On average, carbon species (OC, EC, and WSOC) account for almost 60% of PM2.5 mass in the atmospheric outflow from a downwind site. OC and EC concentrations in atmospheric PM2.5 collected at the sampling site were lower than the values reported for other urban areas with high or medium vehicular traffic and/or industrial sources. Moreover, the results obtained in this research can provide a valuable data base for health risk evaluation of the local residents and prioritization of control actions.
KEYWORDS: Air Pollution, Particulate Matter, Analysis, Standards
Date of submission: 17 Oct 2015, Date of acceptance: 12 Jan 2016
Citation: Arfaeinia H, Hashemi SE, Alamolhoda AA, Kermani M. Evaluation of organic carbon,
elemental carbon, and water soluble organic carbon concentration in PM2.5 in the ambient air of Sina
Hospital district, Tehran, Iran. J Adv Environ Health Res 2016; 4(2): 95-101.
Introduction
1Particulate matter (PM) considerably affects the atmospheric chemistry, air quality, vision purview, and the radiation funds of the Earth. PM is generated either by numerous natural processes or due to various human activities. PM has been broadly studied in recent decades because of its potential effects on air
Corresponding Author: Majid Kermani
Email: majidkermani@yahoo.com
quality and health.1-6 Various studies have
shown that a key representative agent of air quality is the concentration of aerosols, particularly fine mode particles (PM with diameters less than 10 or 2.5 µm). However, aerosols have a complicated chemical composition and it has been proposed that some of the observed serious impacts are related to PM chemical mixture.7-9 The
(BBE), fossil-fuel combustion (FFC), vehicular emission, industries, soil dust emission, biomass burning, photochemical responsible for the production of inorganic secondary aerosol, and other human made sources.10-12
There are a very large number of organic constituents in both the particulate and gas phase of the atmosphere. Determining exposure to all particular components is not possible yet. One way that has been used in many researches is to determine elemental carbon (EC) and organic carbon (OC) as more general indices of air quality. EC is an extremely polymerized black fraction that is refractory to oxidation at temperatures below 400 ºC.13 EC particle surface consists of
plentiful adsorption sites that are able to improve catalytic processes. EC is highly associates with black smoke (BS), black carbon (BC), and PM absorbance ability and is used as an indicator of traffic diesel emissions.14-16
On the other hand, OC is a combination of organic compounds such as aromatic hydrocarbons, acids, and etcetera. Water-soluble organic carbon (WSOC) is a part of OC and within urban air, WSOC is approximately 20-35% of OC fraction and 90% of it consists of oxygenated organic aerosol.17 Most forms of
WSOC are oxygenated organic compounds such as carboxylic acids, aldehydes, ketones, alcohols, and peroxides that are emitted directly from combustion, industrial and natural sources (primary) and/or are formed through secondary processes such as homogeneous gas-phase and/or heterogeneous aerosol-phase oxidation (secondary).18-19 The distinction between EC
and OC are usually obtained by evaluating various parameters such as thermal, chemical, and optical factors.8 Carbonaceous loading
PM, containing OC and EC, are present in the ambient air and contribute considerably (~10– 70%) to the formation of PM2.5 and PM10.20-22
Particles of smoke consist of ~60% OC and ~5– 10% EC. EC consists of various types of unadulterated carbon and is an important part of PM. The main sources of EC are incomplete combustion of biomass burning and fossil
fuel, such as jungle fires.23,24 As a main
constituent of fine mode aerosol, EC is associated with harmful impacts on human health due to absorbing detrimental and carcinogenic substances such as polycyclic aromatic hydrocarbons (PAHs).25
Tehran (Iran) is one of the most polluted cities in Asia and even in the world in which extreme sources of pollution include heavy industry, combustion of fossil fuels by local heating systems, and old cars that are not equipped with up-to-date catalysts and particle filters. Consequently, the present study has been carried out in view of the importance and sensitivity of the properties of carbonaceous aerosols over Tehran. The study reported in this manuscript assessed the abundance of carbonaceous species including EC, OC, and WSOC at an urban location of Tehran for the period of March to June 2014.
Materials and Methods
Tehran, the capital of Iran, has a geographic area of 686.3 km2 and is situated at 35º 45' 20.
90"N, 51º 23' 40. 40" E, and 1,200 above sea
level. The monitoring site was located between two large squares in the center of Tehran. There were many busy roads with unique transportation including buses, gasoline passenger cars, taxis, and diesel trucks near the sampling site. Moreover, around 100 m from the sampling site, many local roads intermingle and a large number of motor vehicles travel through them on a daily basis. The traffic congestion at the sampling site was about 600-700 vehicles/hour during the sampling period. Moreover, there were a large number of workshops and commercial centers, and a bus terminal adjacent to the sampling site. The map of Tehran showing the sampling site is given in figure 1.
The samples of PM2.5 were collected using
an frmOMNItm Ambient Air Sampler (BGI,
Figure 1. Location of the sampling site in Tehran
The instruments were installed 10 m above the ground. From March 2013 to June 2014, 31 PM2.5 samples were collected every 3
days. Sampling duration was 24 hours, yielding sample volumes of 7.2 m3. The filters
were weighed twice before and after sampling using an analytical microbalance (M/s. Mettler-Toledo, resolution ± 1 μg) to obtain PM2.5 concentration. After weighing,
the filters were wrapped in aluminum foil to protect them from sunlight, and stored under dry conditions at temperature of -20 ºC in a deep-freezer prior to analysis.26
Thermal gravimetric analysis (TGA) (Columbia, MD, USA) was used to analyzed OC and EC of ambient PM2.5 samples (n = 31)
with negative pyrolysis areas zeroed. TGA is based on the preferential oxidation of OC and EC at various temperatures. The sample was heated to four temperature points (140, 280, 480, and 580 ºC) in pure helium, and three temperature points (580, 740, and 840 ºC) in 98% helium and 2% oxygen. The performance of TGA was based on the fact
that OC can be volatilized from the sample deposit in a non-oxidizing helium atmosphere, while EC must be combusted by an oxidizer. The main performance of the optical component (laser reflectance and transmittance) of the analyzer is to emend for pyrolysis, and charring of OC compounds into EC. The thermal optical reflectance (TOR) charring reforms are not presently the same, due to charring of organic vapors within the quartz filters.27 For the analysis of
WSOC, 1/8 segment of particle-loaded filter was extracted with 30.0 ml of Milli-Q water (Millipore Inc., Specific Resistivity N 18.2 MΩ-cm). Later, the obtained solutions were filtered through pre-heated GF/F filters (Whatman Inc., USA) and WSOC measurement was conducted on a TOC analyzer (Shimadzu Inc., Japan).28,29
Table 1. Mass concentration of PM2.5 in different months during sampling
Periods Sample number Mean Maximum Minimum Median SD
March-April 7 31.69 47.87 14.32 33.76 10.62
April-May 13 48.11 76.45 33.97 43.32 11.38
May-June 11 39.64 57.34 27.65 38.98 8.94
Total 31 41.39 76.45 14.32 38.62 12.28
SD: Standard deviation
Results and Discussion
Particles matter concentrations
PM concentrations (mean ± SD) in different months during sampling are provided in table 1. As shown in this table, PM2.5 concentrations
varied from 14.32 to 74.45 µg/m3 with an
average value of 41.39 µg/m3. The maximum
and minimum values of PM2.5 concentrations
are related to March-April and April-May periods with an average of 48.11 and 31.69 µg/m3, respectively. As the findings indicated,
the PM concentrations in some days were higher than the United States Environmental Protection Agency (EPA) standard values (EPA 1997) used in Iran.30 In comparison with other
researches, the concentrations of PM obtained in the present study are in the low to medium level.31-33 For example, Leili et al. reported that
in the atmosphere of Tehran, the arithmetic means of 151 ± 44 μg/m3 and 90 ± 38 μg/m3
were determined for total suspended particulate matter (TSP) and PM10,
respectively.34
Organic carbon and elemental carbon concentration and their temporal variability
The levels of carbon species show pronounced temporal variability during the sampling period (March to June 2013) from 5.52 to 23.21 (15.35 ± 6.05) µg/m3 for OC and
1.03 to 4.16 (2.25 ± 0.65) µg/m3 for EC
(Table 2). OC and EC constitute 37.27% and 5.46% of PM2.5 mass, respectively. It is
noteworthy that a strong linear relationship was observed between OC and PM2.5 mass
(R2 = 0.82; P-value < 0.001; N = 31;
slope = 0.36). This suggests the dominant contribution (~37%) of OC to PM2.5 aerosols
in the atmosphere of the studied site. However, a similar temporal abundance
pattern was observed for all chemical components. It is notable that OC concentration dominates the fine mode aerosol mass (i.e., up to 40%). Relatively high levels were found for winter months in comparison to that in spring. This is related to low boundary layer height during the winter and effective trapping of aerosols in the lower atmosphere.35 The contribution of
the unidentified mass of carbonaceous fraction of PM2.5 at the sampling site in
Tehran could be attributed to carbonate rich minerals, aluminosilicates, calcium sulphate, and etccetera.36
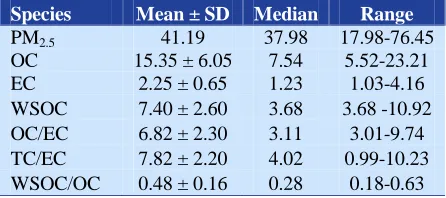
Table 2. Mass concentrations (µg/m3) of PM2.5
-related carbonaceous species during the study period at the sampling site
Species Mean ± SD Median Range
PM2.5 41.19 37.98 17.98-76.45
OC 15.35 ± 6.05 7.54 5.52-23.21
EC 2.25 ± 0.65 1.23 1.03-4.16
WSOC 7.40 ± 2.60 3.68 3.68 -10.92 OC/EC 6.82 ± 2.30 3.11 3.01-9.74 TC/EC 7.82 ± 2.20 4.02 0.99-10.23 WSOC/OC 0.48 ± 0.16 0.28 0.18-0.63
OC: Organic carbon; EC: Elemental carbon; WSOC: Water-soluble organic carbon; SD: Standard deviation; TC: Total carbon Comparison of organic carbon and elemental carbon levels in PM from other areas
The OC and EC levels in PM2.5 were
compared with other international researches (Table 3). As shown in table 3, the values for OC and EC obtained in the current study are lower than those obtained in Milan (Italy). In general, concentrations of carbon species determined in the present study were higher than those measured in an urban area in India with recognized primary and secondary particle sources. Moreover, as shown in table 3, carbonaceous levels in PM2.5
Table 3. Comparison of organic carbon (OC) and elemental carbon (EC) levels in PM from other areas
Area PM OC EC TC References
Tehran 41.19 15.35 2.25 17.6 This research
Italy 20.1-200 12-70 0.2-6 12.2-76 (37)
India 177.9 26.7 6.1 32.8 (10)
Northern India 89.7 30.7 4.5 35.2 (2)
India 183.0 22.0 5.1 27.1 (38)
Japan 31.0 9.5 5.3 14.8 (39)
Mumbai (India) 188.7 35.0 8.4 43.4 (40)
Gwangju (South Korea) 95.5 4.6 2.1 6.7 (41)
Kanpur 203.3 47.4 6.1 53.5 (42)
OC: Organic carbon; EC: Elemental carbon; TC: Total carbon
the cities of Mumbai and Kanpur (India), Japan, and Gwangju (South Korea). It is noteworthy that concentrations of OC and EC depend on various parameters such as meteorological and geographical statuses, sampling technique, extraction technique of the study, sampling periods, and origins of pollutants. These parameters can be reasons for the difference in the findings among various geographical areas around the world. The results of the comparisons between data of different areas are vague and may lead to incorrect conclusions.
Conclusion
In the present study, OC, EC, and WSOC concentrations in PM2.5 were assessed at an
urban site in Tehran. As the findings indicated, the mean PM2.5 level for the
sampling area was higher than the annual average of the EPA ambient air quality standard. On average, carbon species (OC, EC, and WSOC) account for almost 60% of PM2.5 mass in the atmospheric outflow from a
downwind site. OC and EC concentrations in atmospheric PM2.5 collected at the sampling
site were lower than the values reported for other urban areas with high or medium vehicular traffic and/or industrial sources. Moreover, the results obtained in this research can provide a valuable data base for health risk evaluation of the local residents and prioritization of control actions.
Conflict of Interests
Authors have no conflict of interests.
Acknowledgements
This study was supported by funding received from the Institute for Environmental Research (IER) of Tehran University of Medical Sciences (Grant No.: 21046). We would like to also thank the Institute of Water and Energy of Sharif University of Technology for providing us with sampling devices.
References
1. Li X, Wang S, Duan L, Hao J, Nie Y. Carbonaceous aerosol emissions from household biofuel combustion in China. Environ Sci Technol 2009; 43(15): 6076-81.
2. Ram K, Sarin MM, Sudheer AK, Rengarajan R. Carbonaceous and secondary inorganic aerosols during wintertime fog and haze over urban sites in the indo-gangetic plain. Journal of Aerosol and Air Quality Research 2012; 12(3): 359-70.
3. Sharma SK, Rohtash MK, Saraswati NCG, Saxena M, Mandal TK. Characteristics of ambient ammonia over Delhi, India. Meteorol Atmos Phys 2014; 124(1): 67-82.
4. Anenberg SC, Balakrishnan K, Jetter J, Masera O, Mehta S, Moss J, et al. Cleaner cooking solutions to achieve health, climate, and economic cobenefits. Environ Sci Technol 2013; 47(9): 3944-52.
5. Stanek LW, Sacks JD, Dutton SJ, Dubois JJB. Attributing health effects to apportioned components and sources of particulate matter: An evaluation of collective results. Atmospheric Environment 2011; 45(32): 5655-63.
6. Kelly FJ, Fussell JC. Size, source and chemical composition as determinants of toxicity attributable to ambient particulate matter. Atmospheric Environment 2012; 60: 504-26.
8. Jedynska A, Hoek G, Eeftens M, Cyrys J, Keuken M, Ampe C, et al. Spatial variations of PAH, hopanes/steranes and EC/OC concentrations within and between European study areas. Atmospheric Environment 2014; 87: 239-48.
9. Sharma M, Kishore S, Tripathi S, Behera SN. Role of atmospheric ammonia in the formation of inorganic secondary particulate matter: A study at Kanpur, India. Journal of Atmospheric Chemistry 2007; 58(1): 1-17.
10.Sharma SK, Mandal TK, Saxena M, Sharma A, Datta A, Saud T. Variation of OC, EC, WSIC and trace metals of PM10 in Delhi, India. Journal of Atmospheric and Solar-Terrestrial Physics 2014; 113: 10-22.
11.Sharma SK, Mandal TK, Saxena M, Rohtash R, Sharma A, Gautam R. Source apportionment of PM10 by using positive matrix factorization at an urban site of Delhi, India. Urban Climate 2014; 10(Part 4,): 656-70.
12.Goldstein AH, Galbally IE. Known and unexplored organic constituents in the earth's atmosphere. Environ Sci Technol 2007; 41(5): 1514-21.
13.Penner JE, Novakov T. Carbonaceous particles in the atmosphere: A historical perspective to the Fifth International Conference on Carbonaceous Particles in the Atmosphere. J Geophys Res 1996; 101(D14): 19373-8.
14.Cyrys J, Heinrich J, Hoek G, Meliefste K, Lewne M, Gehring U, et al. Comparison between different traffic-related particle indicators: elemental carbon (EC), PM2.5 mass, and absorbance. J Expo Anal Environ Epidemiol 2003; 13(2): 134-43.
15.Schaap M, van der Gon D. On the variability of Black Smoke and carbonaceous aerosols in the Netherlands. Atmospheric Environment 2007; 41(28): 5908-20.
16.Keuken MP, Jonkers S, Zandveld P, Voogt M, van den Elshout S. Elemental carbon as an indicator for evaluating the impact of traffic measures on air quality and health. Atmospheric Environment 2012; 61: 1-8.
17.Lewandowski M, Jaoui M, Kleindienst TE, Offenberg JH, Edney EO. Composition of PM2.5 during the summer of 2003 in Research Triangle Park, North Carolina. Atmospheric Environment 2007; 41(19): 4073-83.
18.Yang H, Yu JZ, Ho SSH, Xu J, Wu WS, Wan CH, et al. The chemical composition of inorganic and carbonaceous materials in PM2.5 in Nanjing, China. Atmospheric Environment 2005; 39(20): 3735-49.
19.Pathak RK, Wang T, Ho KF, Lee SC. Characteristics of summertime PM2.5 organic and elemental carbon in four major Chinese cities: Implications of high acidity for water-soluble organic carbon (WSOC). Atmospheric
Environment 2011; 45(2): 318-25.
20.Jacob DJ. Heterogeneous chemistry and tropospheric ozone. Atmospheric Environment 2000; 34(12-14): 2131-59.
21.Kanakidou M, Seinfeld JH, Pandis SN, Barnes I, Dentener FJD, Facchini MC, et al. Organic aerosol and global climate modelling: a review. Atmos Chem Phys 2005; 5: 1053-123.
22.Fuzzi S, Andreae MO, Huebert BJ, Kulmala M, Bond TC, Boy M, et al. Critical assessment of the current state of scientific knowledge, terminology, and research needs concerning the role of organic aerosols in the atmosphere, climate, and global change. Atmos Chem Phys 2006; 6: 2017-38. 23.Cooke WF, Cachier LH, Feichter J. Construction of
a 1 × 1 fossil fuel emission data set for carbonaceous aerosol and implementation and radiative impact in the ECHAM4 model. J Geophys Res 1999; 104(D18): 22137-62.
24.Masiello CA. New directions in black carbon organic geochemistry. Marine Chemistry 2004; 92(1-4): 201-13.
25.Dachs J, Eisenreich SJ. Adsorption onto aerosol soot carbon dominates gas-particle partitioning of polycyclic aromatic hydrocarbons. Environ Sci Technol 2000; 34(17): 3690-7.
26.Sharma SK, Singh AK, Saud T, Mandal TK, Saxena M, Singh S, et al. Study on water-soluble ionic composition of PM10 and related trace gases over Bay of Bengal during W_ICARB campaign. Meteorol Atmos Phys 2012; 118(1): 37-51.
27.Chow JC, Watson JG, Chen LW, Arnott WP, Moosmuller H, Fung K. Equivalence of elemental carbon by thermal/optical reflectance and transmittance with different temperature protocols. Environ Sci Technol 2004; 38(16): 4414-22. 28.Ram K, Sarin MM, Tripathi SN. A 1 year record of
carbonaceous aerosols from an urban site in the Indo-Gangetic Plain: Characterization, sources, and temporal variability. J Geophys Res 2010; 115: D24313.
29.Rengarajan R, Sarin MM, Sudheer AK. Carbonaceous and inorganic species in atmospheric aerosols during wintertime over urban and high-altitude sites in North India. J Geophys Res 2007; 112: D21307.
30.United States Environmental Protection Agency. Air quality planning and standards [Online]. [cited 1997]; Available from: URL:
https://www3.epa.gov/airquality/
31.Chaloulakou A, Kassomenos P, Spyrellis N, Demokritou P, Koutrakis P. Measurements of PM10 and PM2.5 particle concentrations in Athens, Greece. Atmospheric Environment 2003; 37(5): 649-60.
aerosols in the northeastern Mediterranean. Atmospheric Environment 2007; 41(34): 7351-68. 33.Glavas SD, Nikolakis P, Ambatzoglou D,
Mihalopoulos N. Factors affecting the seasonal variation of mass and ionic composition of PM2.5 at a central Mediterranean coastal site. Atmospheric Environment 2008; 42(21): 5365-73.
34.Leili M, Naddafi K, Nabizadeh R, Yunesian M, .Mesdaghinia A. The study of TSP and PM10 concentration and their heavy metal content in central area of Tehran, Iran. Air Qual Atmos Health 2008; 1(3): 159-66.
35.Srinivas B, Sarin MM. PM2.5, EC and OC in atmospheric outflow from the Indo-Gangetic Plain: Temporal variability and aerosol organic carbon-to-organic mass conversion factor. Science of The Total Environment 2014; 487: 196-205.
36.Zhang QH, Zhang J, .Xue HW. The challenge of improving visibility in Beijing. Atmos Chem Phys 2010; 10: 7821-7.
37.Fermo P, Piazzalunga A, Vecchi R, Valli G, Ceriani M. A TGA/FT-IR study for OC and EC quantification applied to carbonaceous aerosol collected in Milan (Italy). Atmospheric Chemistry and Physics Discussions 2005; 5(4): 4335-71. 38.Perrino C, Tiwari S, Catrambone M, Torre SD,
Rantica E, Canepari S. Chemical characterization of atmospheric PM in Delhi, India, during different periods of the year including Diwali festival. Atmospheric Pollution Research 2011; 2(4): 418-27. 39.Tarek Mohamed N, Yuji Y, Kazuhiko S, Qingyue
W, Kazuhiko S. Chemical Composition of PM2.5 and PM10 and Associated Polycyclic Aromatic Hydrocarbons at a Roadside and an Urban Background Area in Saitama, Japan. Asian journal of atmospheric environment 2008; 2(2): 90-101. 40.Gupta AK, Karar K, Srivastava A. Chemical mass
balance source apportionment of PM10 and TSP in residential and industrial sites of an urban region of Kolkata, India. Journal of Hazardous Materials 2007; 142(1-2): 279-87.
41.Park SS, Bae MS, Schauer JJ, Ryu SY, Kim YJ, Cho SY, et al. Evaluation of the TMO and TOT methods for OC and EC measurements and their characteristics in PM2.5 at an urban site of Korea during ACE-Asia. Atmospheric Environment 2005; 39(28): 5101-12.